A few months ago, we introduced the new Search Console. Here are some updates on how it's progressing.
Welcome "URL inspection" tool
One of our most common user requests in Search Console is for more details on how Google Search sees a specific URL. We listened, and today we've started launching a new tool, “URL inspection,” to provide these details so Search becomes more transparent. The URL Inspection tool provides detailed crawl, index, and serving information about your pages, directly from the Google index.
Enter a URL that you own to learn the last crawl date and status, any crawling or indexing errors, and the canonical URL for that page. If the page was successfully indexed, you can see information and status about any enhancements we found on the page, such as linked AMP version or rich results like Recipes and Jobs.
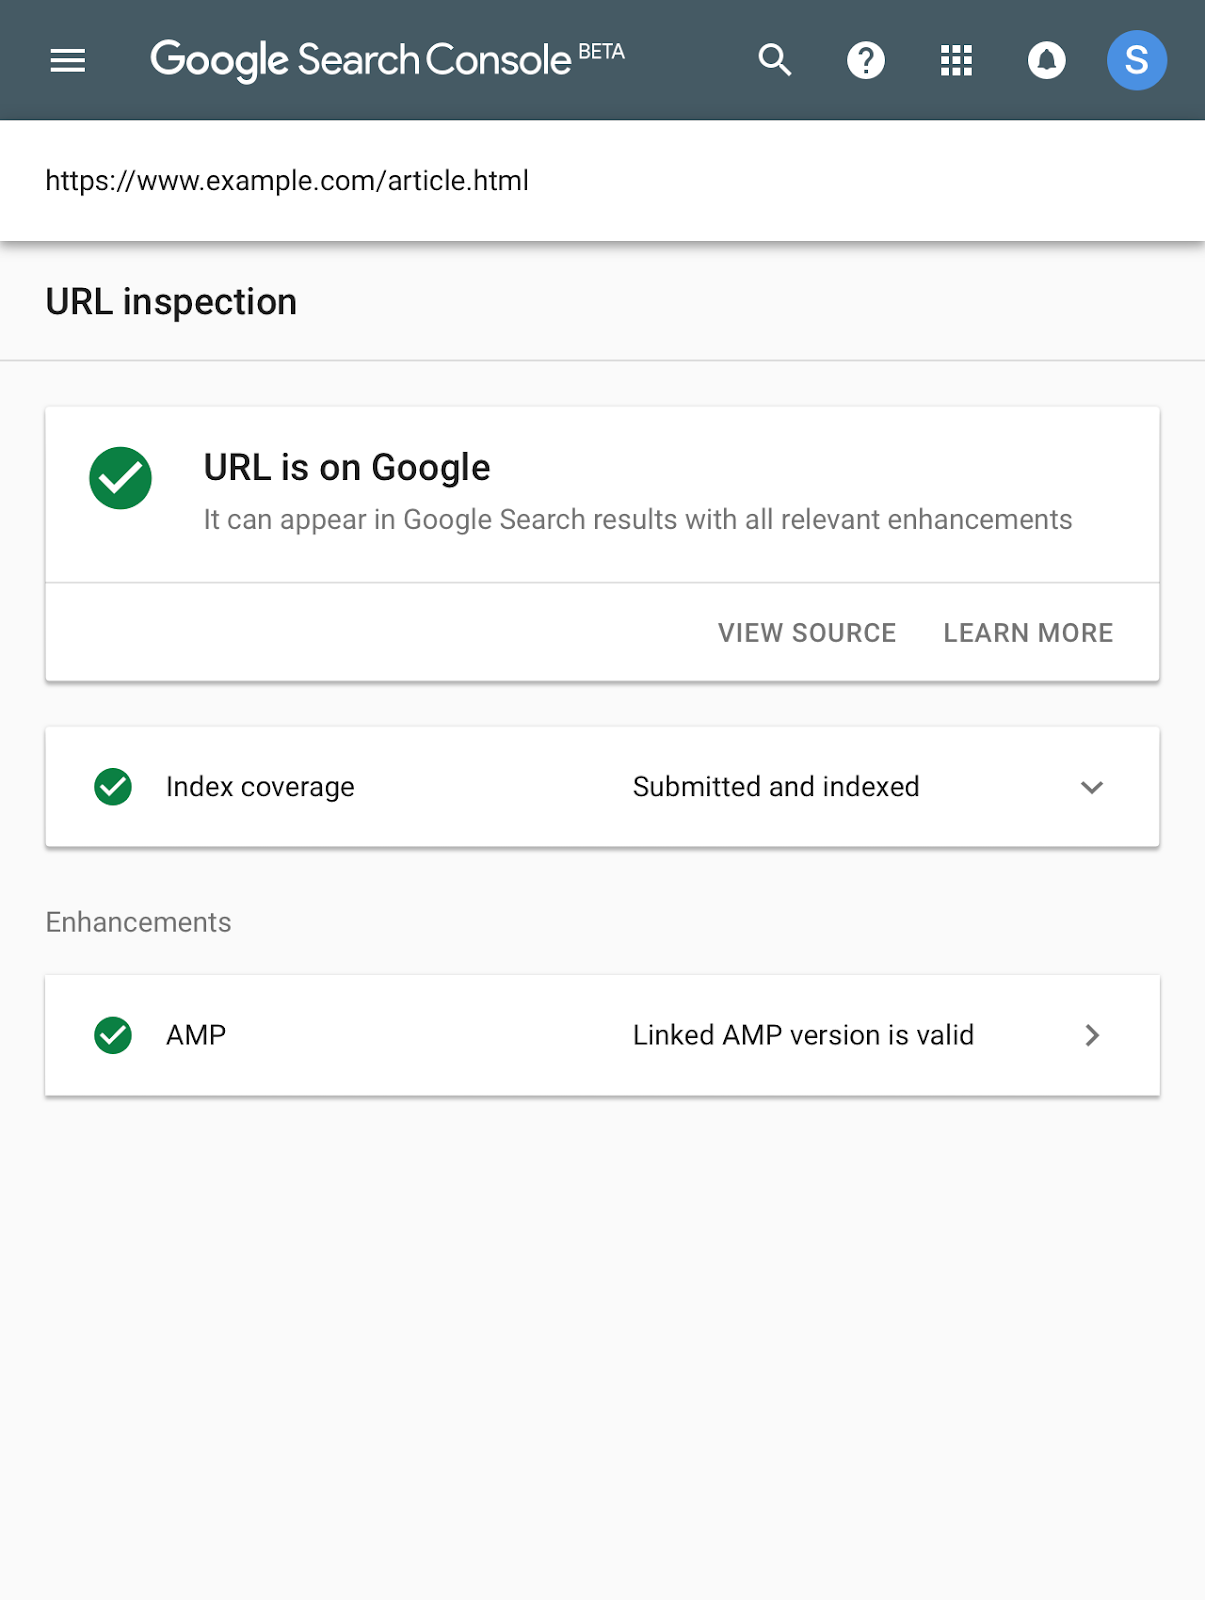
URL is indexed with valid AMP enhancement
If a page isn't indexed, you can learn why. The new report includes information about noindex robots meta tags and Google's canonical URL for the page.
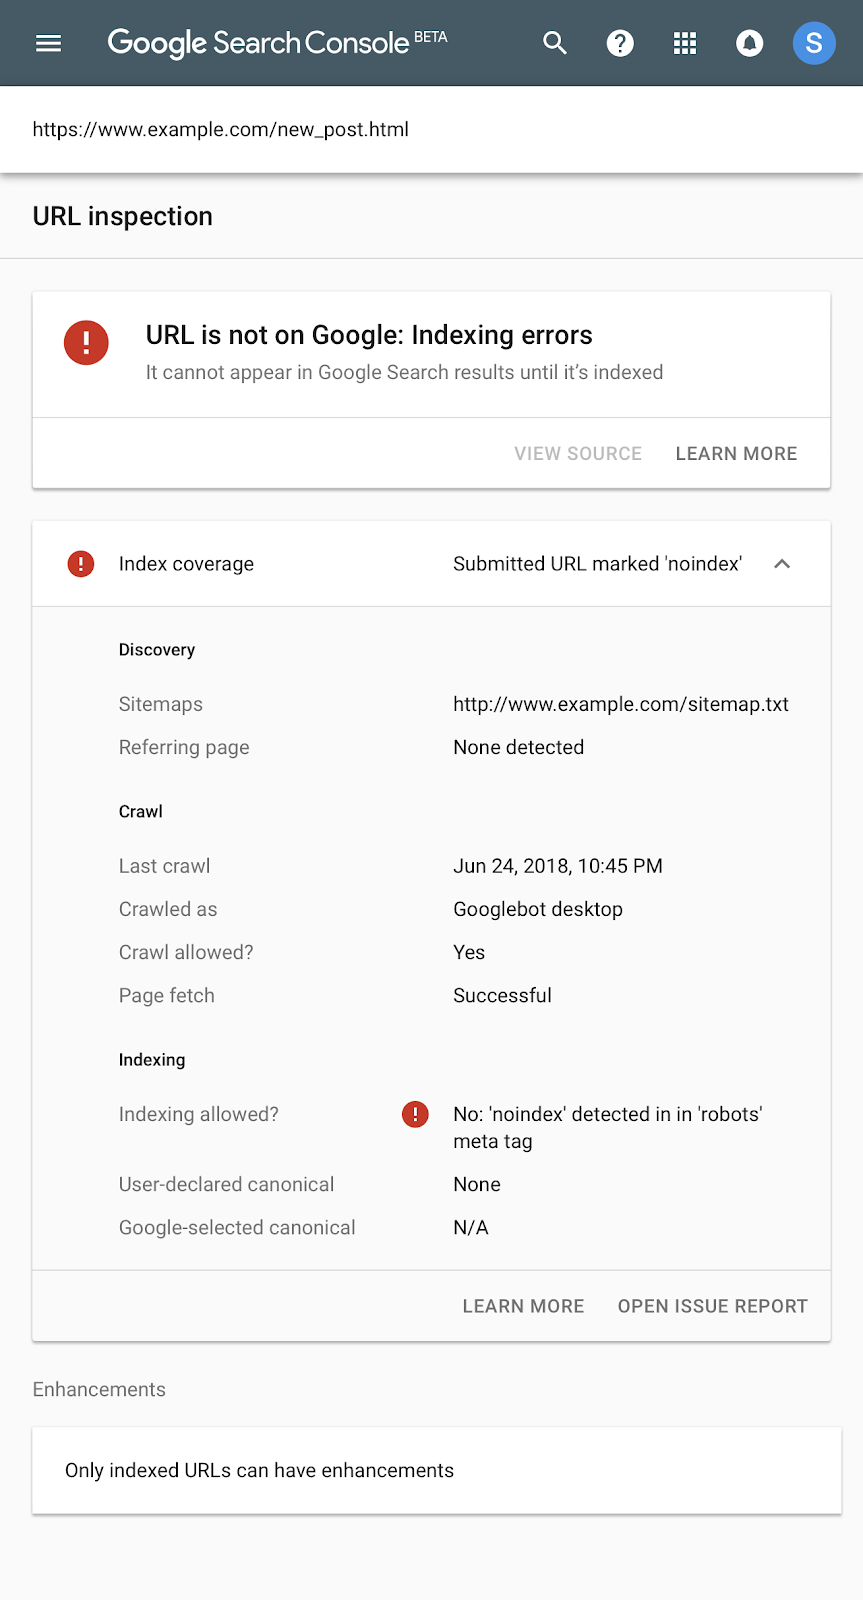
URL is not indexed due to ‘noindex’ meta tag in the HTML
A single click can take you to the issue report showing all other pages affected by the same issue to help you track down and fix common bugs.
We hope that the URL Inspection tool will help you debug issues with new or existing pages in the Google Index. We began rolling it out today; it will become available to all users in the coming weeks.
More exciting updates
In addition to the launch of URL inspection, we have a few more features and reports we recently launched to the new Search Console:
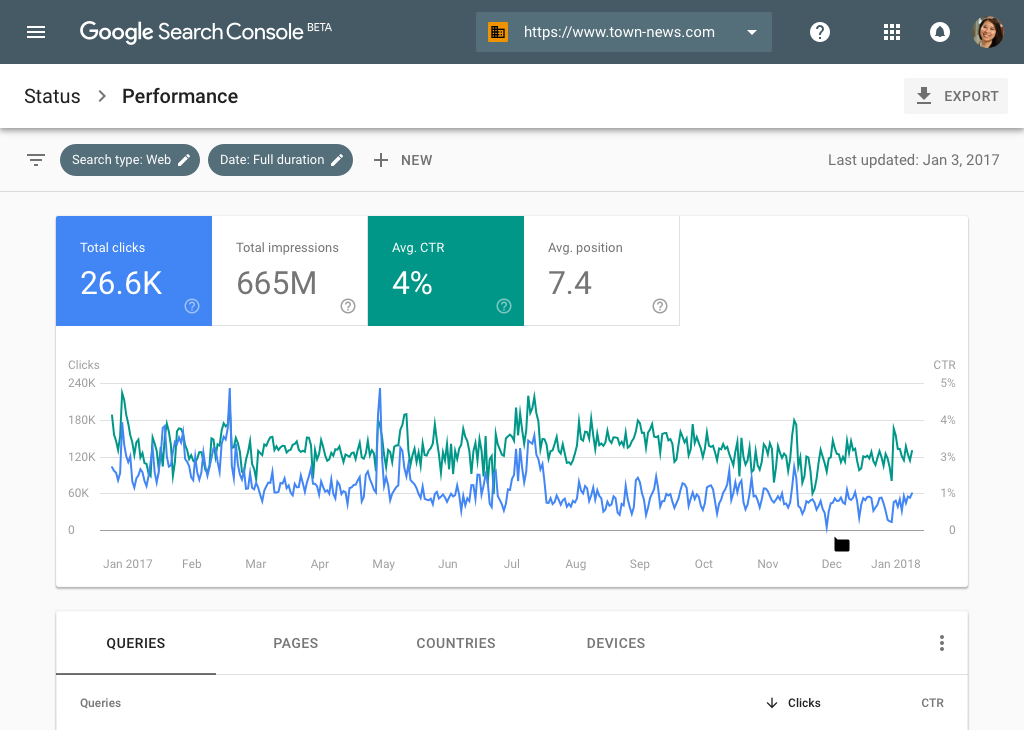
- Sixteen months of traffic data: The Search Analytics API now returns 16 months of data, just like the Performance report.
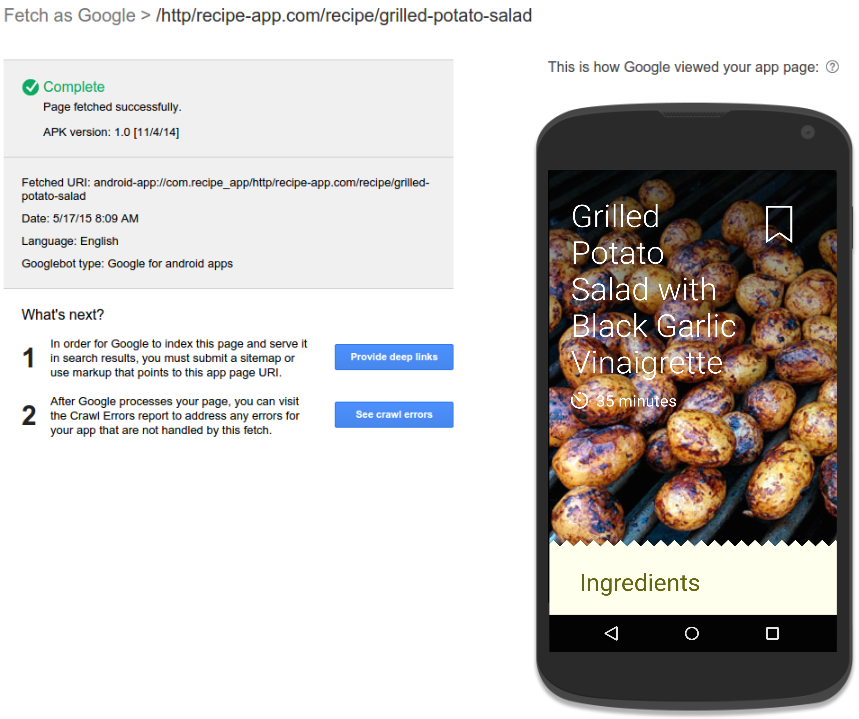
- Recipe report: The Recipe report help you fix structured data issues affecting recipes rich results. Use our task-oriented interface to test and validate your fixes; we will keep you informed on your progress using messages.
- New Search Appearance filters in Search Analytics: The performance report now gives you more visibility on new search appearance results, including Web Light and Google Play Instant results.
Thank you for your feedback
We are constantly reading your feedback, conducting surveys, and monitoring usage statistics of the new Search Console. We are happy to see so many of you using the new issue validation flow in Index Coverage and the AMP report. We notice that issues tend to get fixed quicker when you use these tools. We also see that you appreciate the updates on the validation process that we provide by email or on the validation details page.
We want to thank everyone who provided feedback: it has helped us improve our flows and fix bugs on our side.
More to come
The new Search Console is still beta, but it's adding features and reports every month. Please keep sharing your feedback through the various channels and let us know how we're doing.


.png)
.png)