Tag Archives: Seach
Visual ways to search and understand our world
Whether you’re a student learning about photosynthesis or a parent researching the best cars for your growing family, people turn to Google with all sorts of curiosities. And we can help you understand in different ways—through text, your voice or even your phone’s camera. Today, as part of the SearchOn event, we’re announcing new ways you can use Google Lens and augmented reality (AR) while learning and shopping.
Visual tools to help you learn
For many families, adjusting to remote learning hasn’t been easy, but tools like Google Lens can help lighten the load. With Lens, you can search what you see using your camera. Lens can now recognize 15 billion things—up from 1 billion just two years ago—to help you identify plants, animals, landmarks and more. If you’re learning a new language, Lens can also translate more than 100 languages, such as Spanish and Arabic, and you can tap to hear words and sentences pronounced out loud.
If you’re a parent, your kids may ask you questions about things you never thought you’d need to remember, like quadratic equations. From the search bar in the Google app on Android and iOS, you can use Lens to get help on a homework problem. With step-by-step guides and videos, you can learn and understand the foundational concepts to solve math, chemistry, biology and physics problems.
Sometimes, seeing is understanding. For instance, visualizing the inner workings of a plant cell or the elements in the periodic table in 3D is more helpful than reading about them in a textbook. AR brings hands-on learning home, letting you explore concepts up close in your space. Here’s how Melissa Brophy-Plasencio, an educator from Texas, is incorporating AR into her lesson plans.

Shop what you see with Google Lens
Another area where the camera can be helpful is shopping—especially when what you’re looking for is hard to describe in words. With Lens, you can already search for a product by taking a photo or screenshot. Now, we’re making it even easier to discover new products as you browse online on your phone. When you tap and hold an image on the Google app or Chrome on Android, Lens will find the exact or similar items, and suggest ways to style it. This feature is coming soon to the Google app on iOS.
Lens uses Style Engine technology which combines the world’s largest database of products with millions of style images. Then, it pattern matches to understand concepts like “ruffle sleeves” or “vintage denim” and how they pair with different apparel.
Bring the showroom to you with AR
When you can’t go into stores to check out a product up close, AR can bring the showroom to you. If you’re in the market for a new car, for example, you’ll soon be able to search for it on Google and see an AR model right in front of you. You can easily check out what the car looks like in different colors, zoom in to see intricate details like buttons on the dashboard, view it against beautiful backdrops and even see it in your driveway. We’re experimenting with this feature in the U.S. and working with top auto brands, such as Volvo and Porsche, to bring these experiences to you soon.
AR experience of the 2020 Volvo XC40 Recharge
Everyone’s journey to understand is different. Whether you snap a photo with Lens or immerse yourself in AR, we hope you find what you’re looking for...
...and even have some fun along the way.
Source: Search
Our latest investments in information quality in Search and News
Delivering high-quality results is what has always set Google apart from other search engines, even in our earliest days. Over the years as the product and user experience have evolved, our investments in quality have accelerated.
We conduct extensive testing to ensure that Search is as helpful as it can be—from the quality of information we deliver, to the overall experience. Since 2017, we’ve done more than 1 million search quality tests, and we now average more than 1,000 tests per day.
In addition to investing in the overall Search experience, we also focus on providing reliable information for people everywhere. We’ve highlighted our fundamental approach and ongoing investment in this area, but we also wanted to share some of the new improvements we’ve made to continue to deliver high quality information.
In a year when access to reliable information is more critical than ever—from COVID-19 to natural disasters to important moments of civic participation around the world—our longstanding commitment to quality remains at the core of our mission to make the world’s information accessible and useful.
New insights from our Intelligence Desk
With new things happening around the world every day, the information landscape can change quickly. To understand how our systems are performing when news breaks, we’ve developed an Intelligence Desk, which actively monitors and identifies potential information threats.
This effort grew out of our Crisis Response team, which for years has done real-time tracking of events around the world, launching SOS Alerts in Search and Maps to help people get vital information quickly. Over the years, we’ve monitored thousands of events and launched hundreds of alerts to help keep people safe.
Crisis events monitored (green) and SOS Alerts launched (red), 2016 - 2020.
The Intelligence Desk is a global team of analysts monitoring news events 24/7, spanning natural disasters and crises, breaking news moments and the latest developments in ongoing topics like COVID. When events occur, our analysts collect data about how our systems are responding and compile reports about narratives that are emerging, like new claims about COVID treatments. Our product teams use these data sets and reports from the Intelligence Desk to run more robust quality tests and ensure that our systems are working as intended for the wide range of topics people Search for.
Improving our systems for breaking news and crises
As news is developing, the freshest information published to the web isn’t always the most accurate or trustworthy, and people’s need for information can accelerate faster than facts can materialize.
Over the past few years, we’ve improved our systems to automatically recognize breaking news around crisis moments like natural disasters and ensure we’re returning the most authoritative information available. We’ve also made significant strides in our overall ability to accurately identify breaking news moments, and do so more quickly. We’ve improved our detection time from up to 40 minutes just a few years ago, to now within just a few minutes of news breaking.

Our improvements in detecting crisis events expands on our work in 2017 to improve the quality of results for topics that might be susceptible to hateful, offensive and misleading information. Those improvements remain fundamental to how we handle low-quality information in Search and News products, and since then, we’ve continuously updated our systems to be able to detect topic areas that may be at risk for misinformation. We’re continuing to train and test our systems to ensure that whatever people are searching for, they can find reliable information.
Providing accurate information from the Knowledge Graph
In Search, features like knowledge panels that display information from the Google Knowledge Graph help you get quick access to the facts from sources across the web. To deliver high-quality information in these features, we’ve deepened our partnerships with government agencies, health organizations and Wikipedia to ensure reliable, accurate information is available, and protect against potential vandalism.
For COVID-19, we worked with health organizations around the world to provide local guidance and information to keep people safe. To respond to emerging information needs, like the surge we saw in people searching for unemployment benefits, we provide easy access to information right from government agencies in the U.S. and other countries. For elections information, we work with non-partisan civic organizations that provide authoritative information about voting methods, candidates, election results and more.
Information in knowledge panels comes from hundreds of sources, and one of the most comprehensive knowledge bases is Wikipedia. Volunteer Wikipedia editors around the world have created robust systems to guard for neutrality and accuracy. They use machine learning tools paired with intricate human oversight to spot and address vandalism. Most vandalism on Wikipedia is reverted within a matter of minutes.
To complement Wikipedia’s systems, we’ve added additional protections and detection systems to prevent potentially inaccurate information from appearing in knowledge panels. On rare occasions, instances of vandalism on Wikipedia can slip through. Only a small proportion of edits from Wikipedia are potential vandalism, and we’ve improved our systems to now detect 99 percent of those cases. If these issues do appear, we have policies that allow us to take action quickly to address them.
To further support the Wikipedia community, we created the WikiLoop program last year that hosts several editor tools focused on content quality. This includes WikiLoop DoubleCheck, one of a number tools Wikipedia editors and users can use to track changes on a page and flag potential issues. We contribute data from our own detection systems, which members of the community can use to uncover new insights.
Helpful context from fact checks and Full Coverage
We design Search and News to help you see the full picture, by helping you easily understand the context behind information you might find online. We make it easy to spot fact checks in Search, News and, most recently, Google Images by displaying fact check labels. These fact checks and labels come from publishers that use ClaimReview schemato mark up fact checks they have created. This year to date, people have seen fact checks on Search and News more than 4 billion times, which is more than all of 2019 combined.
We understand the importance of the fact checking ecosystem in debunking misleading information, which is why we recently donated an additional $6.5 million to help fact checking organizations and nonprofits focus on misinformation about the pandemic.
We also just launched an update using our BERT language understanding models to improve the matching between news stories and available fact checks. These systems can better understand whether a fact check claim is related to the central topic of a story, and surface those fact checks more prominently in Full Coverage—a News feature that provides a complete picture of how a story is reported from a variety of sources. With just a tap, Full Coverage lets you see top headlines from different sources, videos, local news reports, FAQs, social commentary, and a timeline for stories that have played out over time.
Expanded protections for Search features
We have policies for what can appear in Search features like featured snippets, lists or video previews that uniquely highlight information on the search results page. One notable example is Autocomplete, which helps you complete your search more quickly.
We have long-standing policies to protect against hateful and inappropriate predictions from appearing in Autocomplete. We design our systems to approximate those policies automatically, and have improved our automated systems to not show predictions if we detect that the query may not lead to reliable content. These systems are not perfect or precise, so we enforce our policies if predictions slip through.
We expanded our Autocomplete policies related to elections, and we will remove predictions that could be interpreted as claims for or against any candidate or political party. We will also remove predictions that could be interpreted as a claim about participation in the election—like statements about voting methods, requirements, or the status of voting locations—or the integrity or legitimacy of electoral processes, such as the security of the election. What this means in practice is that predictions like “you can vote by phone” as well as “you can't vote by phone,” or a prediction that says “donate to” any party or candidate, should not appear in Autocomplete. Whether or not a prediction appears, you can still search for whatever you’d like and find results.
Information online is constantly changing—as are the things people search for—so continuing to deliver high-quality information is an area of ongoing investment. We’ve made great strides and built upon successful improvements to our systems, and we’ll continue to look for new ways to make Search and News as reliable and helpful as possible, no matter what you’re looking for.
Source: Search
How Google delivers reliable information in Search
For many people, Google Search is a place they go when they want to find information about a question, whether it’s to learn more about an issue, or fact check a friend quoting a stat about your favorite team. We get billions of queries every day, and one of the reasons people continue to come to Google is they know that they can often find relevant, reliable information that they can trust.
Delivering a high-quality search experience is core to what makes Google so helpful. From the early days when we introduced the PageRank algorithm, understanding the quality of web content was what set Google apart from other search engines.
But people often ask: What do you mean by quality, and how do you figure out how to ensure that the information people find on Google is reliable?
A simple way to think about it is that there are three key elements to our approach to information quality:
First, we fundamentally design our ranking systems to identify information that people are likely to find useful and reliable.
To complement those efforts, we also have developed a number of Search features that not only help you make sense of all the information you’re seeing online, but that also provide direct access to information from authorities—like health organizations or government entities.
Finally, we have policies for what can appear in Search features to make sure that we’re showing high quality and helpful content.
With these three approaches, we’re able to continue to improve Search and raise the bar on quality to deliver a trusted experience for people around the world. Let’s take a closer look at how we approach each of these areas.
Orienting our ranking systems around quality
To understand what results are most relevant to your query, we have a variety of language understanding systems that aim to match the words and concepts in your query with related information in our index. This ranges from systems that understand things like misspellings or synonyms, to more advanced AI-based systems like our BERT-based language capabilities that can understand more complex, natural-language queries.
Updates to our language understanding systems certainly make Search results more relevant and improve the experience overall. But when it comes to high-quality, trustworthy information, even with our advanced information understanding capabilities, search engines like Google do not understand content the way humans do. We often can’t tell from the words or images alone if something is exaggerated, incorrect, low-quality or otherwise unhelpful.
Instead, search engines largely understand the quality of content through what are commonly called “signals.” You can think of these as clues about the characteristics of a page that align with what humans might interpret as high quality or reliable. For example, the number of quality pages that link to a particular page is a signal that a page may be a trusted source of information on a topic.
We consider a variety of other quality signals, and to understand if our mixture of quality signals is working, we run a lot of tests. We have more than 10,000 search quality raters, people who collectively perform millions of sample searches and rate the quality of the results according to how well they measure up against what we call E-A-T: Expertise, Authoritativeness and Trustworthiness.
Raters, following instructions anyone can read in our Search Quality Rater Guidelines, evaluate results for sample queries and assess how well the pages listed appear to demonstrate these characteristics of quality.
We recently explained the search rater process in more depth, but it’s worth noting again the ratings we receive are not used directly in our ranking algorithms. Instead, ratings provide data that, when taken in aggregate, help us measure how well our systems are working to deliver quality content that’s aligned with how people—across the country and around the world—evaluate information. This data helps us to improve our systems and ensure we’re delivering high quality results.
For topics where quality information is particularly important—like health, finance, civic information, and crisis situations—we place an even greater emphasis on factors related to expertise and trustworthiness. We’ve learned that sites that demonstrate authoritativeness and expertise on a topic are less likely to publish false or misleading information, so if we can build our systems to identify signals of those characteristics, we can continue to provide reliable information. The design of these systems is our greatest defense against low-quality content, including potential misinformation, and is work that we’ve been investing in for many years.
Info from experts, right in Search
In most cases, our ranking systems do a very good job of making it easy to find relevant and reliable information from the open web, particularly for topics like health, or in times of crisis. But in these areas, we also develop features to make information from authoritative organizations like local governments, health agencies and elections commissions available directly on Search.
For example, we’ve long had knowledge panels in Search with information about health conditions and symptoms, vetted by medical experts. More recently, we saw a significant increase in people searching for information about unemployment benefits, so we worked with administrative agencies to highlight details about eligibility and how to access this civic service. And for many years, we’ve offered features that help you find out how to vote and where your polling place is. Through the Google Civic Information API, we help other sites and services make this information available across the web. This type of information is not always easy to find, especially in rapidly changing situations, so features like these help ensure people get critical guidance when they need it most.
Helping you understand information you see
For many searches, people aren’t necessarily looking for a quick fact, but rather to understand a more complex topic. We also know that people come to Search having heard information elsewhere, with the aim of seeing what others are saying to form their own opinion.
In these cases, we want to give people tools to make sense of the information they’re seeing online, to find reliable sources and explore the full picture about a topic.
For example, we make it easy to spot fact checks in Search, News, and now in Google Images by displaying fact check labels. These labels come from publishers that use ClaimReview schema to mark up fact checks they have published. For years now we’ve offered Full Coverage on Google News and Search, helping people explore and understand how stories have evolved and explore different angles and perspectives.
Protecting Search features through policies
We also offer more general Search features, like knowledge panels, featured snippets and Autocomplete, that highlight and organize information in unique ways or predict queries you might want to do. Because of the way these features highlight information in Search, we hold ourselves to a very high standard for quality and have guidelines around what content should appear in those spaces.
Within these features, we first and foremost design our automated ranking systems to show helpful content. But our systems aren’t always perfect. So if our systems fail to prevent policy-violating content from appearing, our enforcement team will take action in accordance with our policies.
To learn more about how we approach policies for our search features, visit this post. And if you’re still looking for more details about Search, check out more past articles in our How Search Works series.
Source: Search
Quarantine, but make it fashion
Typically, fashion changes with the seasons. In the fall, you see boots and flannels appear; in winter, we break out the cable knit sweaters. Come spring, light jackets start showing up, and summer means it’s time for shorts and sandals. But this year, I’ve been wearing a nearly uninterrupted uniform of workout clothes since March.
I wanted to see how widespread the effect of quarantine was on personal style, so I turned to Google Trends to find out. Here’s a look at some of the latest fashion-related Google Trends that people are searching for:
While searching for shorts seems like the status quo for hot summer months, according to Google Trends, search interest in “shorts” reached an all-time high this June in the U.S. More specifically, “biker shorts” was the most searched type of shorts over the past three months (interestingly, we also saw an increase in search interest for “cycling” in March). “Biker shorts” was followed by “short shorts,” “running shorts” (my personal faves)—though “denim shorts” and “cargo shorts” followed next, so apparently there is still some interest in “real” clothes out there.
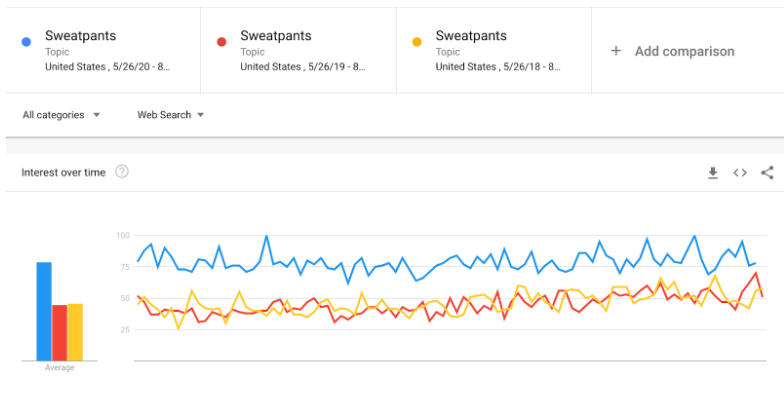
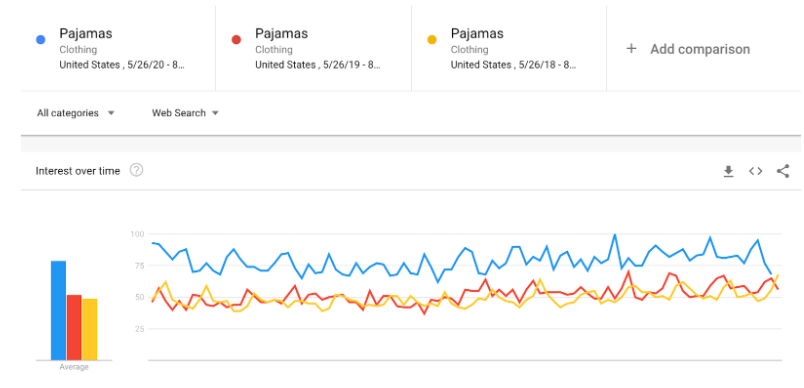
One garment has remained buried in my dresser for quite some time now: pants. So I wasn’t surprised to see that while search interest in pants isn’t currently at an all-time low, there was a significant dip in the U.S. in March...which certainly corresponds with the period of time that sheltering in place caused me to move in a comfier direction. Meanwhile, even though much of the U.S. is currently experiencing warmer temps, search interest in “sweatpants” has been much higher this summer than it was the previous two years; same goes for pajamas:
Of course, pre-quarantine fashion pieces have taken a hit: Searches for wedding dresses, tuxedos and neckties are all down. Heels haven't gotten much love in recent months, either. U.S. search interest in “high-heeled shoe” hit a 10-year low in April of this year. On the flipside, in May “running shoes” hit an all-time high.
But what about new fashion trends that sheltering in place has inspired? You may have seen social media feeds consumed with the idea of the nap dress—a dress you can both wear while going about your day (whether that be running errands or just working from home) as well as...well, for napping. “Nap dress” saw an all-time high in search interest in July in the U.S.
Here’s to my—and maybe your—most casual summer on record.
Source: Search
Using symptoms search trends to inform COVID-19 research
Search is often where people come to get answers on health and wellbeing, whether it’s to find a doctor or treatment center, or understand a symptom better just before a doctor's visit. In the past, researchers have used Google Search data to gauge the health impact of heatwaves, improve prediction models for influenza-like illnesses, and monitor Lyme disease incidence. Today we’re making available a dataset of search trends for researchers to study the link between symptom-related searches and the spread of COVID-19. We hope this data could lead to a better understanding of the pandemic’s impact.
Using the dataset, researchers can develop models and create visualizations based on the popularity of symptom-related searches. This sample visualization is based on search volume for fever across the U.S. This visualization does not reflect the dataset’s user interface but shows what can be generated.
How search trends can support COVID-19 research
The COVID-19 Search Trends symptoms dataset includes aggregated, anonymized search trends for more than 400 symptoms, signs and health conditions, such as cough, fever and difficulty breathing. The dataset includes trends at the U.S. county-level from the past three years in order to make the insights more helpful to public health, and so researchers can account for changes in searches due to seasonality.
Public health currently uses a range of datasets to track and forecast the spread of COVID-19. Researchers could use this dataset to study if search trends can provide an earlier and more accurate indication of the reemergence of the virus in different parts of the country. And since measures such as shelter-in-place have reduced the accessibility of care and affected people’s wellbeing more generally, this dataset—which covers a broad range of symptoms and conditions, from diabetes to stress—could also be useful in studying the secondary health effects of the pandemic.
The dataset is available in Google Cloud's COVID-19 Free Public Dataset Program and is downloadable in CSV format from Google Research at Open COVID-19 Data GitHub repository.
Advancing health research with privacy protections
The COVID-19 Search Trends symptoms dataset is powered by the same anonymization technology that we use in the Community Mobility Reports and other Google products every day. No personal information or individual search queries are included. The dataset was produced using differential privacy, a state-of-the-art technique that adds random noise to the data to provide privacy guarantees while preserving the overall quality of the data.
Similar to Google Trends, the data is normalized based on a symptom’s relative popularity, allowing researchers to study spikes in search interest over different time periods, without exposing any individual query or even the number of queries in any given area.
More information about the privacy methods used to generate the dataset can be found in this report.
What’s next
This early release is limited to the United States and covers searches made in English and Spanish. It covers all states and many counties, where the available data meets quality and privacy thresholds. It was developed to specifically aid research on COVID-19, so we intend to make the dataset available for the duration of the pandemic.
As we receive feedback from public health researchers, civil society groups and the community at large, we’ll evaluate and expand this dataset by including additional countries and regions.
Researchers and public health experts are doing incredible work to respond to the pandemic. We hope this dataset will be useful in their work towards stopping the spread of COVID-19.
Source: Search
Mapping wildfires with the power of satellite data
Ten years ago, I was inside the Google office in Haifa, Israel when the devastating Carmel Mountain fire started blazing not far from us. The team started searching the web to learn more. And while we did find some details confirming what we already knew—a large fire was taking place outside of our door—we experienced a potentially life-impacting information gap.
This kick-started our journey to build features in Google Search and other products that connect people with high-quality information during crises. A few hours after I took the photo below, we quickly launched a small feature in Search that made it easier for people to find the emergency hotline for the Carmel Mountain fire. Since then, we’ve continued to evolve and expand off this initial launch into the SOS alerts we launched in 2017.
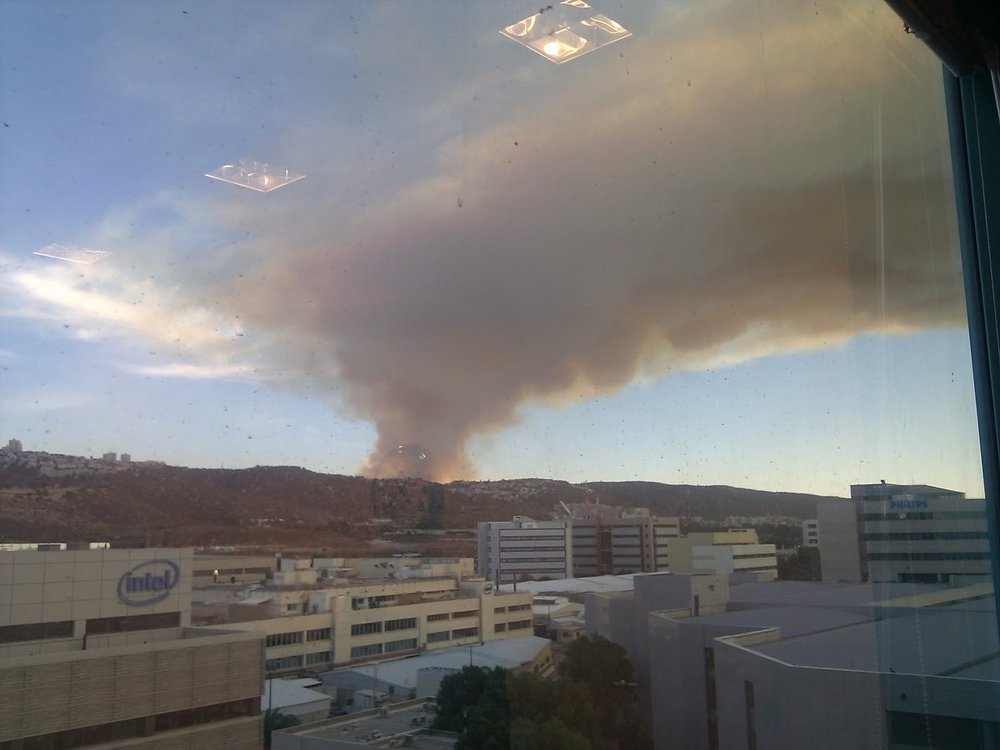
Carmel Mountain Fire - Photo from Google Office in Haifa, Israel
Connecting people to critical information during active wildfires
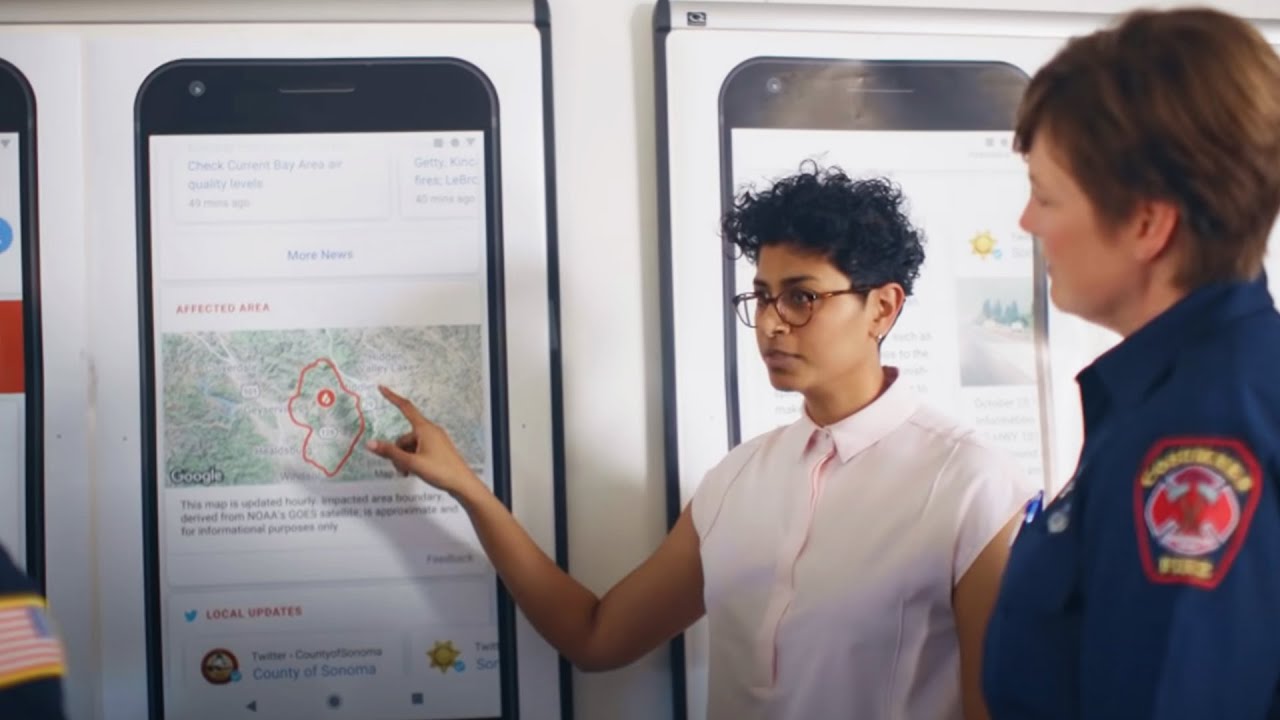
Today we’re launching a new wildfire boundary map in Search and Maps SOS alerts in the U.S. to provide deeper insights for areas impacted by an ongoing wildfire. In moments like a growing wildfire, knowing exactly where a blaze is underway and how to avoid it is critical. Using satellite data to create a wildfire boundary map, people will now see the approximate size and location right on their phone or desktop.
When people look for things like “wildfire in California” or a specific fire like “Kincade fire” in Search, they will be able to see a wildfire’s approximate boundary of the fire, name and location, as well as news articles and helpful resources from local emergency agencies in the SOS alert.
On Google Maps, people will have access to the same details, including the fire boundary, and receive warnings if they’re approaching an active blaze. If someone is exploring an area near a wildfire on Google Maps, they’ll get an ambient alert that will point them to the latest information.
How we map fires to help keep people safe
With satellite data from the National Oceanic and Atmospheric Administration’s (NOAA) GOES constellation of satellites and Google Earth Engine’s data analysis capabilities, we’re now able to show the size of a wildfire in near real time, with data being refreshed roughly every hour. NOAA’s satellites include infrared and optical sensors optimized for detecting “hot spots” or large wildfires on the Earth’s surface. We run computations on this data in Earth Engine to identify the affected area.
Image series showing smoke from the recent Apple Fire in California, captured by GOES-17 satellite.
From there, we create a digital polygon—the red boundary shown on the map in Search and Google Maps—that represents the approximate wildfire impact area. If multiple large fires are active in the same region, people may see several polygons. You can learn more about how we gather, analyze and visualize wildfire data from satellites on our Medium blog.
Using data from NOAA's GOES satellites and Google Earth Engine, we create a digital polygon to represent the approximate wildfire impact area on Search and Google Maps.
Putting this information to work
This year the National Interagency Fire Center has predicted above normal fire risks for several areas across the U.S. Already, firefighters have confronted large blazes across Northern and Southern California, as well as the Grizzly Creek Fire in Colorado, which led to evacuations and burned thousands of acres. In these situations, having high-quality information at your fingertips matters.
For example, in the recent Apple, Pine Gulch, and Grizzly fires, we quickly identified that the wildfires were rapidly expanding, and dry conditions exacerbated the fire, putting thousands of people at risk. We were able to launch our SOS alerts, with the latest boundary map, on Search and Google Maps.
Last year, we piloted this feature in Search for major California wildfires to confirm it was a useful tool for first responders, emergency management personnel and the community. We collaborated with organizations, like the California Governor's Office of Emergency Services (Cal OES) and Boulder’s Office of Emergency Management, to gather expert recommendations on wildfire preparedness and response. Their feedback throughout our 2019 pilot helped identify what information is most useful during emergency situations.
Google has been involved in crisis response for many years, starting with the Carmel Mountain Fire in Israel in 2010. Since then, we've initiated Public and SOS alerts for hundreds of thousands of crises around the world. From wildfire mapping, to earthquake detection and alerts to flood forecasting, we continue to find new ways for technology to be helpful at the most critical times.
Source: Search
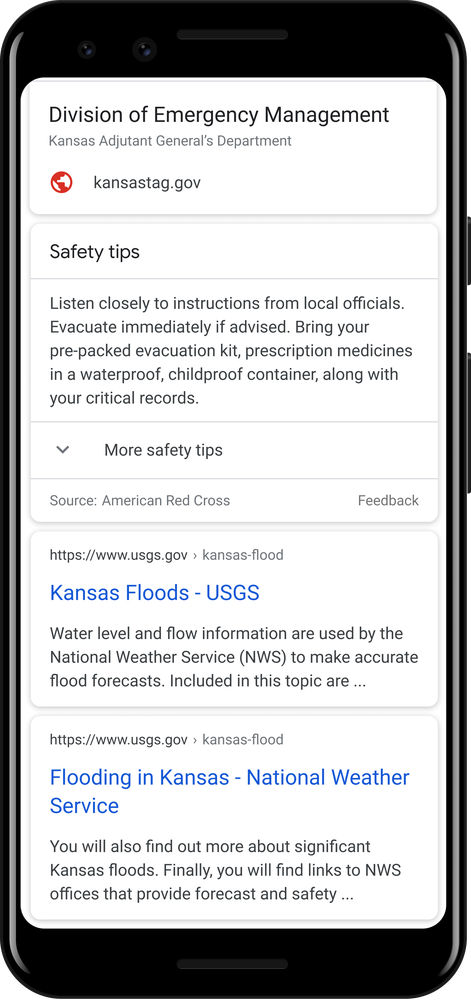
Natural disaster safety tips: a Q&A with the Red Cross
In moments like a growing wildfire or a trembling earthquake, having access to high-quality information and actionable safety tips is critical. The American Red Cross and their Global Disaster Preparedness Center developed an open sourced platform for developers called the WhatNow Service—a data feed of global safety tips for over 20 different disaster types. Supported by a $250,000 Google.org grant, the Red Cross translated these safety tips and adapted the recommendations based on local context and risk.
To make this information even more accessible, when people come to Google Search looking for information about a natural disaster near them, they’ll now find these localized safety tips in theSOS alerts we show during times of crisis.
We sat down to talk with Omar Abou-Samra, who leads the Red Cross’s Global Disaster Preparedness Center, to learn more about the development of these safety tips and how technology has changed the way people prepare for natural disasters.
Can you share a bit about the process behind how safety recommendations are developed?
We’ve worked with social scientists, climate scientists, behavioral researchers and humanitarian aid professionals to identify key messages and actions that people can take before, during and after a crisis. The blend of practical experience with scientific and social research has yielded simple and actionable safety messages that people can trust in the event of an emergency like an earthquake, wildfire, hurricane or flash flood. Sometimes these are simple actions like listening for more information from local authorities or following evacuation orders. Other messages are practical things like moving valuables to safety if you’re near an area that may flood or preparing an emergency kit to keep nearby.
How do you ensure these safety tips are relevant for people across multiple countries?
We work with a network of 192 Red Cross and Red Crescent societies around the globe—each one operates in its own language, and understands unique local challenges and needs. We gave each partner a set of standard, evidence-based messages for 20 different hazards across 6 different time scales (mitigation, seasonal forecast, watch, warning, immediate, and recovery). This localization process included consultation with their government partners to finalize the messages that we’re sharing with the public.
How, if at all, have these recommendations changed with the impact of COVID-19?
As one example, safety tips now advise having additional items in emergency kits—such as hand sanitizer and cloth face coverings. It will be important to have these on hand so that people can continue being safe, and keeping their neighbors safe, in case they need to evacuate their homes and stay in close proximity to others.
What are some of the top challenges in communicating disaster safety information to the public?
Trust and consistency are two of the biggest challenges. Every person accesses information through many different channels. There’s a high volume of content to navigate, which can leave people confused or even unaware of what to do when there is an emergency. With the Red Cross safety messages that can be delivered through Google SOS alerts and by an API to other channels, we’re offering consistent, evidence-based safety messages prepared by a trusted source.
Now that we’re in hurricane and wildfire seasons, what’s the number one piece of advice you can give to readers to stay safe?
The most important thing is to have a plan and make sure you and your loved ones know what to do when there’s an emergency. This includes identifying a trusted source of information, knowing and practicing the steps you will take in an emergency and identifying the items and must-haves you may need for your recovery.
Source: Search
Finding live TV shows and sports just got easier in Search
Sports around the world look a little different this year, with important new measures to keep players, officials and fans safe. As the cheering section moves to the couch, everyone is asking the age-old question: “What channel is the game on?”
So today we’re adding new features to Google Search in the U.S. to help you quickly find the live games you're looking for. And when the game is over, we’re here to help you discover live TV shows or movies that you may like too.
Where to watch live sports
Now when you come to Search looking for your favorite team, you’ll see live TV options for MLB and NBA games (and we’ll be integrating more leagues in the future). Search for “where to watch the Clippers game” or “how to watch the A’s game,” on your phone and you’ll easily find information on how to tune in across a variety of services where the game may be available.
You can also find live TV options by searching for the individual team or game. For example, if you search for “Dodgers game,” you’ll see all of our usual game day features like live scores, top stories, and standings, but you’ll now see a new “Live on” button which shows the live TV options in your area.
Blackout restrictions may apply.
This feature currently includes a variety of cable and network channels, and we'll expand to more digital streaming options soon.
But what about other live TV shows?
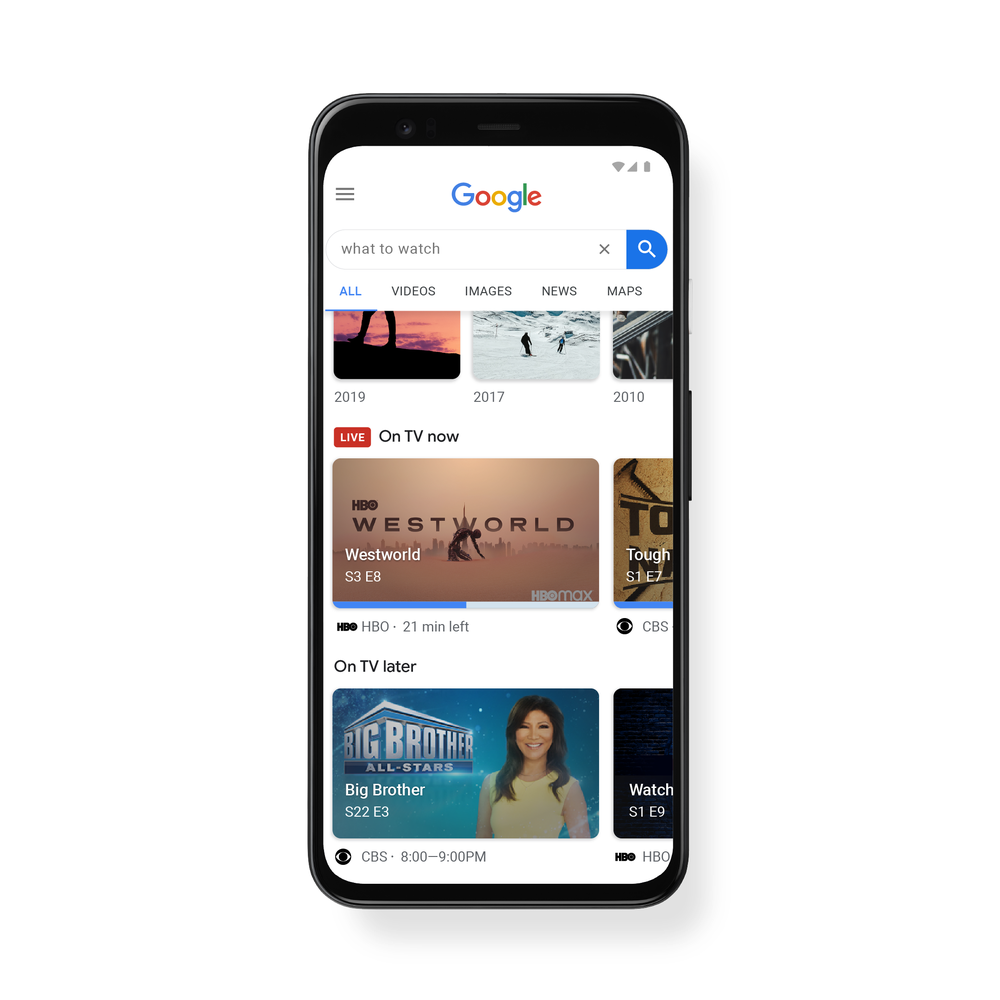
We also want to help you find other shows and movies that are on linear television. Last year, we added a new way to find TV shows and movie recommendations in Search so you can easily decide on what to watch next. Starting this week, we’re enhancing this feature by adding carousels of live content from cable and broadcast providers. These recommendations will show content on live TV so you can keep track of everything that’s available to you.
When you search for things like “what to watch” or “good shows to watch” on mobile, you’ll now have visibility into both streaming and live TV shows. Our “On TV now” carousel shows you programming across multiple channels that’s currently airing, while “On TV later” shows you recommendations for future programming. So when it’s Sunday night and you just can’t decide what to watch before the week begins, Search is here to help.
Availability of content varies by country and language.
Whether you’re searching for your favorite comedy show or your favorite basketball team, we want you to have all the information you need to enjoy TV night. We’re excited to keep adding more features to help you make easier and better decisions on what to watch next.
Source: Search
How insights from people around the world make Google Search better
Every Google search you do is one of billions we receive that day. In less than half a second, our systems sort through hundreds of billions of web pages to try and find the most relevant and helpful results available.
Because the web and people’s information needs keep changing, we make a lot of improvements to our search algorithms to keep up. Thousands per year, in fact. And we’re always working on new ways to make our results more helpful whether it’s a new feature, or bringing new language understanding capabilities to Search.
The improvements we make go through an evaluation process designed so that people around the world continue to find Google useful for whatever they’re looking for. Here are some ways that insights and feedback from people around the world help make Search better.
Our research team at work
Changes that we make to Search are aimed at making it easier for people to find useful information, but depending on their interests, what language they speak, and where they are in the world, different people have different information needs. It’s our mission to make information universally accessible and useful, and we are committed to serving all of our users in pursuit of that goal.
This is why we have a research team whose job it is to talk to people all around the world to understand how Search can be more useful. We invite people to give us feedback on different iterations of our projects and we do field research to understand how people in different communities access information online.
For example, we’ve learned over the years about the unique needs and technical limitations that people in emerging markets have when accessing information online. So we developed Google Go, a lightweight search app that works well with less powerful phones and less reliable connections. On Google Go, we’ve also introduced uniquely helpful features, including one that lets you listen to web pages out loud, which is particularly useful for people learning a new language or who may be less comfortable with reading long text. Features like these would not be possible without insights from the people who will ultimately use them.
Search quality raters
A key part of our evaluation process is getting feedback from everyday users about whether our ranking systems and proposed improvements are working well. But what do we mean by “working well”? We publish publicly available rater guidelines that describe in great detail how our systems intend to surface great content. These guidelines are more than 160 pages long, but if we have to boil it down to just a phrase, we like to say that Search is designed to return relevant results from the most reliable sources available.
Our systems use signals from the web itself—like where words in your search appear on web pages, or how pages link to one another on the web—to understand what information is related to your query and whether it’s information that people tend to trust. But notions of relevance and trustworthiness are ultimately human judgments, so to measure whether our systems are in fact understanding these correctly, we need to gather insights from people.
To do this, we have a group of more than 10,000 people all over the world we call “search quality raters.” Raters help us measure how people are likely to experience our results. They provide ratings based on our guidelines and represent real users and their likely information needs, using their best judgment to represent their locale. These people study and are tested on our rater guidelines before they can begin to provide ratings.
How rating works
Here’s how a rater task works: we generate a sample of queries (say, a few hundred). A group of raters will be assigned this set of queries, and they’re shown two versions of results pages for those searches. One set of results is from the current version of Google, and the other set is from an improvement we’re considering.
Raters review every page listed in the results set and evaluate that page against the query, based on our rater guidelines. They evaluate whether those pages meet the information needs based on their understanding of what that query was seeking, and they consider things like how authoritative and trustworthy that source seems to be on the topic in the query. To evaluate things like expertise, authoritativeness, and trustworthiness—sometimes referred to as “E-A-T”—raters are asked to do reputational research on the sources.
Here’s what that looks like in practice: imagine the sample query is “carrot cake recipe.” The results set may include articles from recipe sites, food magazines, food brands and perhaps blogs. To determine if a webpage meets their information needs, a rater might consider how easy the cooking instructions are to understand, how helpful the recipe is in terms of visual instructions and imagery, and whether there are other useful features on the site, like a shopping list creator or calculator for recipe doubling.
To understand if the author has subject matter expertise, a rater would do some online research to see if the author has cooking credentials, has been profiled or referenced on other food websites, or has produced other great content that has garnered positive reviews or ratings on recipe sites. Basically, they do some digging to answer questions like: is this page trustworthy, and does it come from a site or author with a good reputation?
Ratings are not used directly for search ranking
Once raters have done this research, they then provide a quality rating for each page. It’s important to note that this rating does not directly impact how this page or site ranks in Search. Nobody is deciding that any given source is “authoritative” or “trustworthy.” In particular, pages are not assigned ratings as a way to determine how well to rank them. Indeed, that would be an impossible task and a poor signal for us to use. With hundreds of billions of pages that are constantly changing, there’s no way humans could evaluate every page on a recurring basis.
Instead, ratings are a data point that, when taken in aggregate, helps us measure how well our systems are working to deliver great content that’s aligned with how people—across the country and around the world—evaluate information.
Last year alone, we did more than 383,605 search quality tests and 62,937 side-by-side experiments with our search quality raters to measure the quality of our results and help us make more than 3,600 improvements to our search algorithms.
In-product experiments
Our research and rater feedback isn’t the only feedback we use when making improvements. We also need to understand how a new feature will work when it’s actually available in Search and people are using it as they would in real life. To make sure we’re able to get these insights, we test how people interact with new features through live experiments.
They’re called “live” experiments because they’re actually available to a small proportion of randomly selected people using the current version of Search. To test a change, we will launch a feature to a small percentage of all queries we get, and we look at a number of different metrics to measure the impact.
Did people click or tap on the new feature? Did most people just scroll past it? Did it make the page load slower? These insights can help us understand quite a bit about whether a new feature or change is helpful and if people will actually use it.
In 2019, we ran more than 17,000 live traffic experiments to test out new features and improvements to Search. If you compare that with how many launches actually happened (around 3600, remember?), you can see that only the best and most useful improvements make it into Search.
Always improving
While our search results will never be perfect, these research and evaluation processes have proven to be very effective over the past two decades. They allow us to make frequent improvements and ensure that the changes we make represent the needs of people around the world coming to Search for information.