Additionally, there are several highly-requested report dimensions added in v202102.
| Dimension name | Report data break down |
|---|---|
| BROWSER_NAME | Name and version number of the user's browser |
| VIDEO_PLACEMENT_NAME | Video placement (e.g., in-article, in-stream, and in-feed) |
| CLASSIFIED_YIELD_PARTNER_NAME | Detected yield partner name, as classified by Google |
| DOMAIN | Top private domain, such as "example.co.uk" (excludes subdomains) |
Finally, if you use the Ad Manager API to create video LineItems, v202102 now requires that LineItem.videoMaxDuration is greater than 0. This new validation applies to newly created video LineItems as well as updates. If you think you might be affected, you should update any code that creates video LineItems to set videoMaxDuration to be greater than 0 and scan your network for existing video LineItems with videoMaxDuration set to 0.
For the full list of changes for v202102 and all other active API versions, check the release notes. Feel free to reach out to us on the Ad Manager API forum with any API-related questions.
Source: Google Ads Developer Blog
Announcing v202102 of the Google Ad Manager API
Additionally, there are several highly-requested report dimensions added in v202102.
| Dimension name | Report data break down |
|---|---|
| BROWSER_NAME | Name and version number of the user's browser |
| VIDEO_PLACEMENT_NAME | Video placement (e.g., in-article, in-stream, and in-feed) |
| CLASSIFIED_YIELD_PARTNER_NAME | Detected yield partner name, as classified by Google |
| DOMAIN | Top private domain, such as "example.co.uk" (excludes subdomains) |
Finally, if you use the Ad Manager API to create video LineItems, v202102 now requires that LineItem.videoMaxDuration is greater than 0. This new validation applies to newly created video LineItems as well as updates. If you think you might be affected, you should update any code that creates video LineItems to set videoMaxDuration to be greater than 0 and scan your network for existing video LineItems with videoMaxDuration set to 0.
For the full list of changes for v202102 and all other active API versions, check the release notes. Feel free to reach out to us on the Ad Manager API forum with any API-related questions.
Source: Google Ads Developer Blog
Announcing v6.1 of the Google Ads API
Here are the highlights:
- Retrieving and managing recommendations for adding responsive search ads.
- Added
Feed,FeedItem,CampaignFeed,AdGroupFeed, andAdGroupAdresources to the list of resource types returned in queries against the change_event resource. - New conversion metrics by conversion date.
- New
call_viewresource for reporting on call extensions and call only ads.
The following resources can help you get started: If you have any questions or need additional help, contact us via the forum.
Source: Google Ads Developer Blog
Announcing new AdMob API methods and authorization scope
Today we are announcing the launch of two new features in the AdMob API:
- New admob.readonly OAuth 2.0 scope
- Inventory methods including list apps and ad units
New OAuth 2.0 scope
While the admob.report scope is only intended for reports, the new admob.readonly scope is intended for all read methods, including reports and inventory. We recommend using the admob.readonly scope as it can be used for all read only methods.
| Scope | Functionality |
https://www.googleapis.com/auth/admob.readonly | See all of your AdMob data. This may include your account information, inventory and mediation settings, reports, and other data. If you agree, this app will be allowed to see, but not make changes to your AdMob data. This doesn't include sensitive data, such as payments or campaign details. |
https://www.googleapis.com/auth/admob.report | See ad performance and earnings reports. See publisher ID, timezone and default currency code. |
New methods
We have added the following new methods to the v1beta AdMob API, which allow you to view your AdMob apps and ad units.
How can I start using the new methods and scope?
The beta is available to all AdMob users. You can start with the client libraries that we have created for you.
Where can I learn more?
- Get started with the AdMob API - Follow this guide to learn how to generate credentials and make your first request using the AdMob API.
- Reference documentation - Read the page for detailed information on each REST method and its specific parameters.
- Client Library Samples - Check out this page for code samples on how to make requests in Java and Python.
Feel free to reach out to us via the AdMob API forum if you have questions or feedback regarding the AdMob API.
- Amira Badreldin, AdMob API team
Source: Google Ads Developer Blog
Announcing v202011 of the Google Ad Manager API
This release also brings a new ForecastService method to let you explore historical and future impression opportunities. This is backed by the same data as your network's Traffic Forecast.
For the full list of changes for v202011 check the release notes. Feel free to reach out to us on the Ad Manager API forum with any API-related questions.
Source: Google Ads Developer Blog
Announcing v6 of the Google Ads API
Here are the highlights:
- The API now has Change History similar to the Google Ads UI with
ChangeEventincluding what interface and who made the changes. - You can now manage user access in your Google Ads account.
- Maximize conversion value and maximize conversions are now available as portfolio bidding strategies, which includes Search.
- The new
Customer.optimization_score_weighthelps you calculate your overall optimization score for your manager account. - New audience types are available including
CombinedAudienceandCustomAudience.
The following resources can help you get started:
If you have any questions or need additional help, contact us via the forum.
Source: Google Ads Developer Blog
Android Studio 4.1
Posted by Scott Swarthout, Product Manager

Today, we’re excited to release the stable version of Android Studio 4.1, with a set of features addressing common editing, debugging, and optimization use cases. A major theme for this release was helping you be more productive while using Android Jetpack libraries, Android’s suite of libraries to help developers follow best practices and write code faster. Based on your feedback we made a number of improvements to the code editing experience with IDE integrations for popular Android libraries.
Some highlights of Android Studio 4.1 include a new Database Inspector for querying your app’s database, support for navigating projects that use Dagger or Hilt for dependency injection, and better support for on-device machine learning with support for TensorFlow Lite models in Android projects. We’ve also made updates to Apply Changes to make deployment faster. Based on your feedback, we’ve made several changes to help game developers with a new native memory profiler and standalone profiling tools.
Product quality continues to be a major focus for the team, and we’ve been hard at work tracking down bugs and performance issues. We’ve heard from many developers that they liked the focus on better performance and reliability, so we’re happy to report that during this release cycle we’ve fixed 2,370 bugs and closed 275 public issues. We stay committed to maintaining high quality since we know that is key to your developer productivity.
Thank you to those who gave your early feedback in preview releases. Your feedback helped us iterate and improve features in Android Studio 4.1. If you are ready for the next stable release, and want to use a new set of productivity features, Android Studio 4.1 is ready to download for you to get started.
Below is a full list of new features in Android Studio 4.1, organized by key developer flows.
Design
Material Design Components updates
Android Studio templates in the create New Project dialog now use Material Design Components (MDC) and conform to updated guidance for themes and styles by default. These changes will make it easier to use recommended material styling patterns and support modern UI features like dark themes.

Material Design Components updates in Project Templates
Updates include:
- MDC: Projects depend on
com.google.android.material:materialin build.gradle. Base app themes useTheme.MaterialComponents.*parents and override updated MDC color and “on” attributes. - Color resources: Color resources in
colors.xmluse literal names (for example,purple_500instead ofcolorPrimary). - Theme resources: Theme resources are in
themes.xml(instead ofstyles.xml) and useTheme.<ApplicationName>names. - Dark theme: Base application themes use
DayNightparents and are split between res/values and res/values-night. - Theme attributes: Color resources are referenced as theme attributes (for example,
?attr/colorPrimary) in layouts and styles to avoid hard-coded colors.
Develop
Database Inspector
We wanted to make it easier to inspect, query, and modify your app's databases using the new Database Inspector. To get started, deploy your app to a device running API level 26 or higher and select View > Tool Windows > Database Inspector from the menu bar. Whether your app uses the Jetpack Room library or the Android platform version of SQLite directly, you can now easily inspect databases and tables in your running app or run custom queries.
Because Android Studio maintains a live connection while you’re inspecting your app, you can also modify values using the Database Inspector and see those changes in your running app. If you use the Room persistence library, Android Studio also places run buttons next to each query in the code editor to help you quickly run queries you define in your @Query annotations. Learn more
Inspect, query, and modify your app’s databases with the Database Inspector
Run Android Emulator directly in Android Studio
You can now run the Android Emulator directly in Android Studio. Use this feature to conserve screen real estate, to navigate quickly between the emulator and the editor window using hotkeys, and to organize your IDE and emulator workflow in a single application window. You can manage snapshots and common emulator actions like rotating and taking screenshots from within Studio, but access to the full set of options still requires running the stable emulator. You can opt-in to use this feature by going to File → Settings → Tools → Emulator → Launch in Tool Window.

Run the Android Emulator inside of Android Studio
Dagger Navigation Support
Dagger is a popular library for dependency injection on Android. Android Studio makes it easier to navigate between your Dagger-related code by providing new gutter actions and extending support in the Find Usages window. For example, clicking on the  gutter action next to a method that consumes a given type navigates you to the provider of that type. Conversely, clicking on the
  gutter action navigates you to where a type is used as a dependency. Android Studio also supports navigation actions for dependencies defined with the Jetpack Hilt library. Learn more.
Navigate between Dagger-related code with gutter actions
Use TensorFlow Lite models
Android developers are using machine learning to create innovative and helpful experiences. TensorFlow Lite is a popular library for writing mobile machine learning models, and we wanted to make it easier to import these models into Android apps. Similar to view binding, Android Studio generates easy-to-use classes so you can run your model with less code and better type safety. The current implementation of ML Model Binding supports image classification and style transfer models, provided they are enhanced with metadata.
To see the details for an imported model and get instructions on how to use it in your app, double-click the .tflite model file in your project to open the model viewer page. Learn more.

View TensorFlow Lite model metadata in Android Studio 4.1
Build & Test
Android Emulator - Foldable Hinge Support
Android Studio
In addition to recently adding 5G cellular testing support, we’ve added support for foldables in the Android emulator. With Android emulator 30.0.26 and above, you can configure foldable devices with a variety of fold designs and configurations. When a foldable device is configured, the emulator will publish hinge angle sensor updates and posture changes, so you can test how your app responds to these form factors. See the Developing for Android 11 with the Android Emulator blogpost to read more.

Apply Changes updates
Faster builds help developers make changes to their app more easily and quickly. To help you be more productive as you iterate on your app, we've made multiple enhancements to Apply Changes for devices running Android 11 or higher.
We've invested heavily in optimizing your iteration speed by developing a method to deploy and persist changes on a device without installing the application. After an initial deploy, subsequent deploys to Android 11 devices using either Apply Code Changes or Apply Changes and Restart Activity are now significantly faster. We’ve also added support for additional code changes in Apply Changes. Now if you add a method, you can deploy those changes to a running app by clicking either Apply Code Changes or Apply Changes and Restart Activity.
Export C/C++ dependencies from AARs
Android Gradle Plugin 4.0 added the ability to import Prefab packages in AAR dependencies. We wanted to extend the capability of this feature to support sharing native libraries as well. AGP version 4.1 enables exporting libraries from your external native build in an AAR for an Android Library project. To export your native libraries, add the following to the android block of your library project's build.gradle file:
buildFeatures {
    prefabPublishing true
}

prefab {
    mylibrary {
      headers "src/main/cpp/mylibrary/include"
    }

    myotherlibrary {
        headers "src/main/cpp/myotherlibrary/include"
    }
}
Symbolication for native crash reports
When a crash or ANR occurs in native code, the system produces a stack trace, which is a snapshot of the sequence of nested functions called in your program up to the moment it crashed. These snapshots can help you to identify and fix any problems in the source, but they must first be symbolicated to translate the machine addresses back into human-readable function names.
If your app or game is developed using native code, like C++, you can now upload debug symbols files to the Play Console for each version of your app. The Play Console uses these debug symbols files to symbolicate your app's stack traces, making it easier to analyze crashes and ANRs. To include debug symbols in your app bundle, add the following line to your project’s build.gradle file:
android.buildTypes.release.ndk.debugSymbolLevel = 'SYMBOL_TABLE'
Optimize
System Trace UI improvements
In Android Studio 4.1 we’ve overhauled System Trace, an optimization tool that gives you a real-time look at how your app is using system resources. We made it easier to select a trace with box selection mode, added a new analysis tab, and added more frame rendering data to help you investigate rendering issues in your app’s UI. Learn more.
Box selection: In the Threads section, you can now drag your mouse to perform a box selection of a rectangular area, which you can zoom into by clicking the Zoom to Selection button on the top right (or use the M keyboard shortcut). When you drag and drop similar threads next to each other, you can select across multiple threads to inspect all of them at once.
Use box selection to more easily select traces.
Summary tab: The new Summary tab in the Analysis panel displays:
- Aggregate statistics for all occurrences of a specific event, such as an occurrence count and min/max duration.
- Trace event statistics for the selected occurrence.
- Data about thread state distribution.
- Longest-running occurrences of the selected trace event.
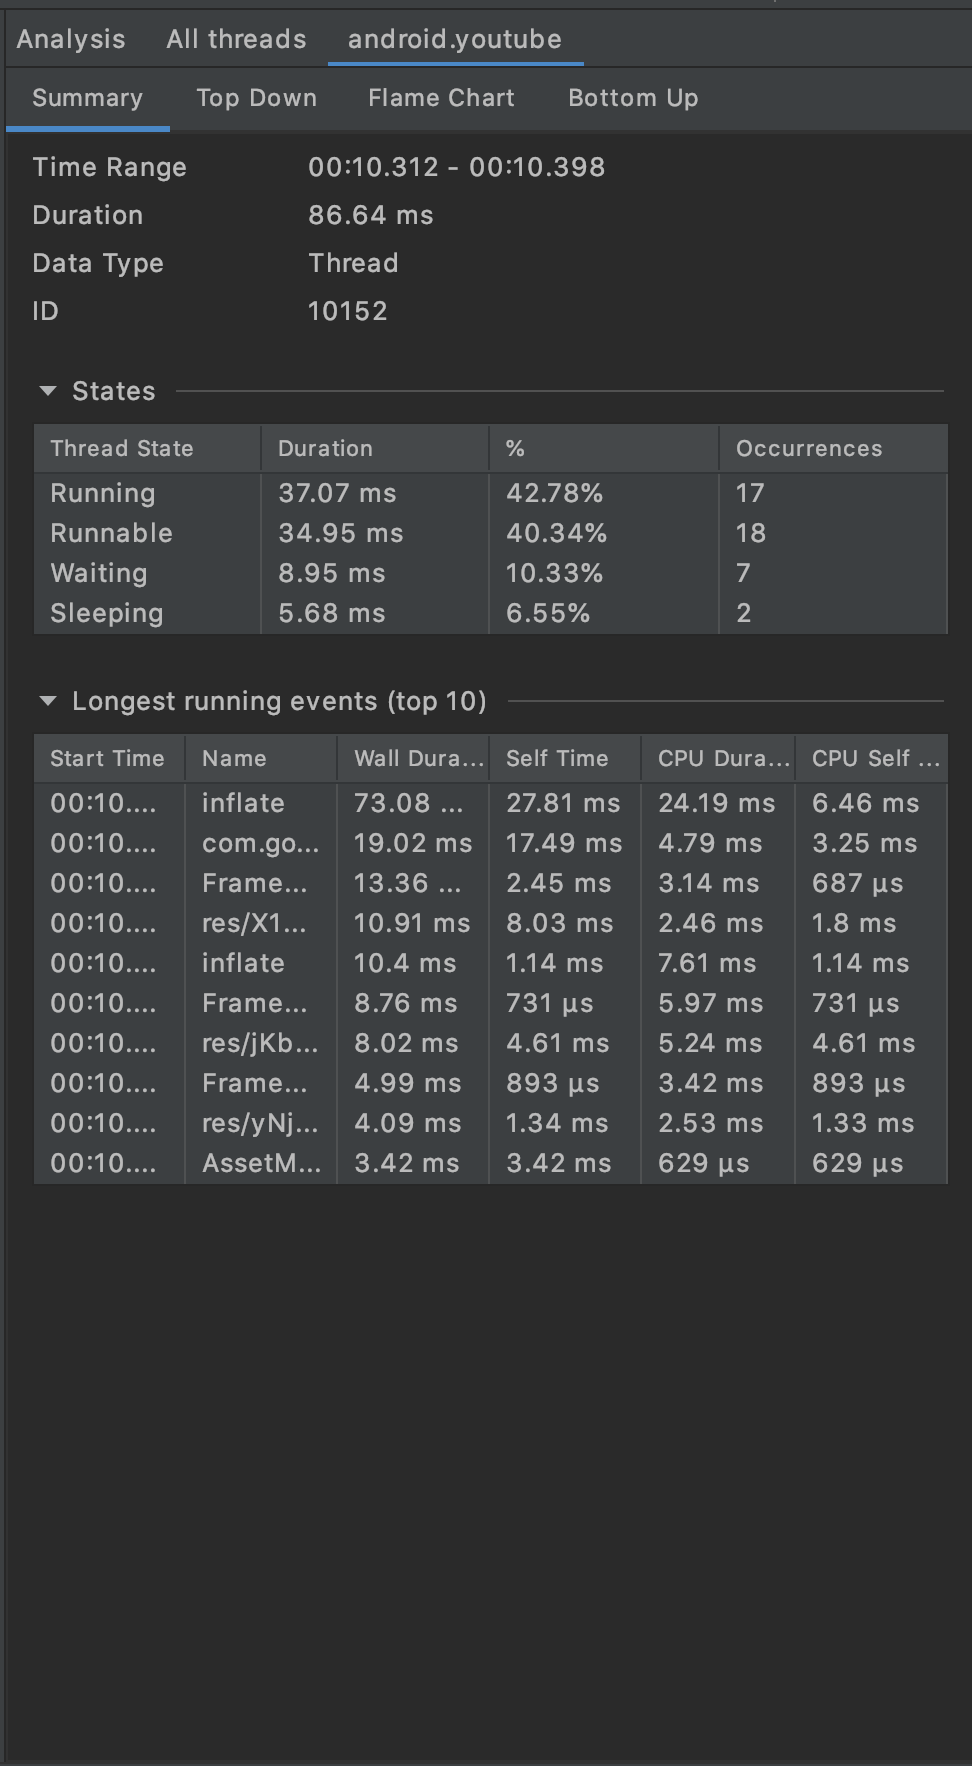
View aggregated statistics in the Summary tab
Display data: In the Display section, new timelines for SurfaceFlinger and VSYNC help you investigate rendering issues in your app's UI.
Standalone profilers
It's now possible to access the Android Studio Profilers in a separate window from the primary Android Studio window. This is useful when optimizing Android games built with other tools like Unity or Visual Studio.
To run the standalone profilers, do the following:
- Make sure the profilers in Android Studio are not already running on your system.
- Go to the installation directory and navigate to the bin directory:
Windows/Linux: <studio-installation-folder>\bin
macOS: <studio-installation-folder>/Contents/bin
- Depending on your OS, run
profiler.exeorprofiler.sh
The standalone profiler will allow you to connect to the Android emulator or any connected devices.

Optimize your app with the Standalone Android Studio Profilers
Native Memory Profiler
Tracking native memory usage is important for game developers and other developers using C++ to understand how to optimize their app’s memory consumption. The Android Studio Memory Profiler now includes a Native Memory Profiler for apps deployed to physical devices running Android 10 or later. The Native Memory Profiler tracks allocations/deallocations of objects in native code for a specific time period and provides information about total allocations and remaining system heap size.
To initiate a recording, click Record native allocations at the top of the Memory Profiler window:
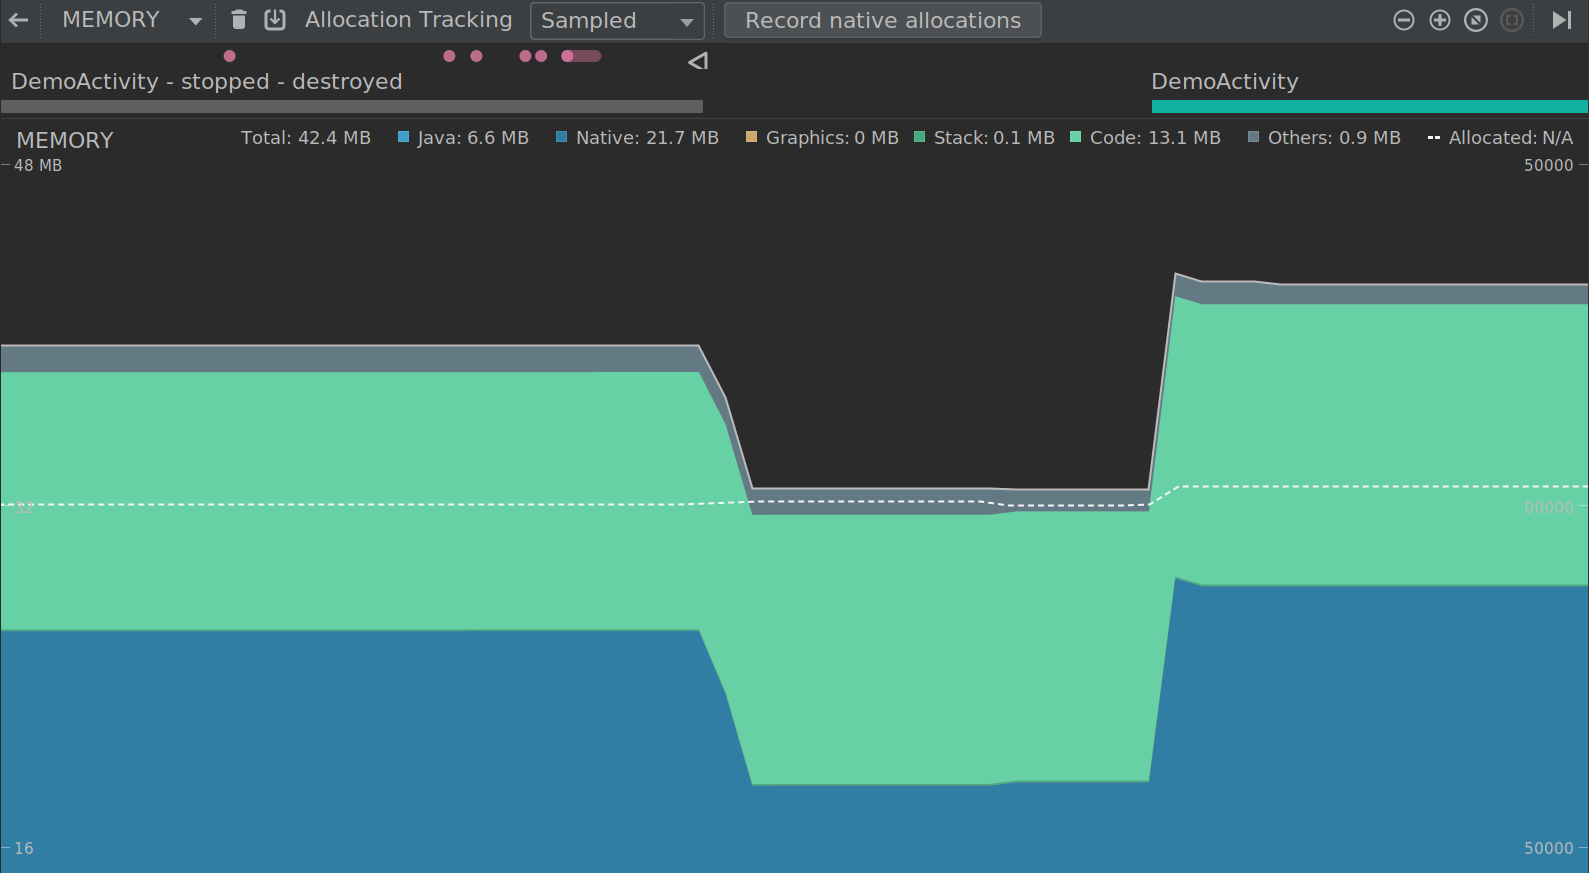
View native memory allocations with the Native Memory Profiler
To recap, Android Studio 4.1 includes these new enhancements & features:
Design
- Material Design Components updates
Develop
- Database Inspector
- Run Android Emulator directly in Android Studio
- Dagger navigation support
- Use TensorFlow Lite models
Build & Test
- Android Emulator - Foldable Hinge Support
- Apply Changes updates
- Export C/C++ dependencies from AARs
- Symbolification for native crash reports
Optimize
- System Trace UI Improvements
- Standalone profilers
- Native Memory Profiler
These materials are not sponsored by or affiliated with Unity Technologies or its affiliates. “Unity” is a trademark or registered trademark of Unity Technologies or its affiliates in the U.S. and elsewhere.


Source: Android Developers Blog
Announcing the Google Ads API is out of beta
The AdWords API will continue to be supported. We will announce a deprecation schedule at a later date. We will continue to add more features in upcoming releases to reach full parity with the AdWords API.
Where can I learn more?
Get started with the following resources: If you have any questions or need additional help, contact us via the forum or at [email protected].
Source: Google Ads Developer Blog
Announcing AdMob API v1 General Availability
Today we’re excited to announce the general availability v1 release of the new AdMob API. It allows publishers to programmatically get information on their AdMob account.
The AdMob API v1 release offers the following benefits for app developers compared with the existing AdSense API used to access AdMob data:
- Retrieve metrics that are consistent with how the AdMob UI defines and calculates them
- Retrieve mediation reports previously not available through the AdSense API
How can I get started?
The AdMob API is now available to all AdMob users. You can use the Getting Started guide and the client libraries to get started.
If you’re already working with the AdSense API, please refer to our migration guide to get started. Please make plans to migrate to the new AdMob API, as we will sunset access to AdMob data via the AdSense API in the fall of 2021.
If you have any questions, please contact us via the AdMob API Developer Forum. We will be able to provide suggestions on how to best migrate your workflow. We look forward to hearing your feedback.
- Amira Badreldin, AdMob API team
Source: Google Ads Developer Blog
Announcing v5 of the Google Ads API beta
Here are the highlights:
- Return metrics for entities not formally supported in the API, such as Discovery campaigns, are now available. These entities will show
UNKNOWNenum values returned. See the release notes for more details. - New request parameter to opt into returning all mutable fields in the response during a mutate.
- The API is moving towards using field presence such as
optional stringandoptional doubleinstead of wrapper types such asStringValueandDoubleValue. Your code will be easier to use and simplifies the API with payloads that are significantly smaller. Approximately half of our resources have been updated in this release. The full list is in the migration guide, and our code examples have been updated. The rest of the resources will change to field presence in a future release. - Subfields of
AdGroupAd.policy_summaryare now selectable. Non-repeated subfields ofAdGroupAd.policy_summaryare now filterable. - Support for Keyword Planner:
- Added
KeywordPlanKeywordHistoricalMetrics.close_variantsto return the close variant keywords that have been merged to compute the historical metrics. - Added
KeywordPlanService.GenerateForecastTimeSeriesthat returns the weekly forecast trend for Keyword Plan for the next 52 weeks.
- Added
The following resources can help you get started: If you have any questions or need additional help, contact us via the forum.