Tag Archives: Performance

Launching SEO Audit category in Lighthouse Chrome extension


We're happy to announce that we are introducing another audit category to the Lighthouse Chrome Extension: SEO Audits.

Lighthouse is an open-source, automated auditing tool for improving the quality of web pages. It provides a well-lit path for improving the quality of sites by allowing developers to run audits for performance, accessibility, progressive web apps compatibility and more. Basically, it "keeps you from crashing into the rocks", hence the name Lighthouse.

The SEO audit category within Lighthouse enables developers and webmasters to run a basic SEO health-check for any web page that identifies potential areas for improvement. Lighthouse runs locally in your Chrome browser, enabling you to run the SEO audits on pages in a staging environment as well as on live pages, public pages and pages that require authentication.

Bringing SEO best practices to you

The current list of SEO audits is not an exhaustive list, nor does it make any SEO guarantees for Google websearch or other search engines. The current list of audits was designed to validate and reflect the SEO basics that every site should get right, and provides detailed guidance to developers and SEO practitioners of all skill levels. In the future, we hope to add more and more in-depth audits and guidance — let us know if you have suggestions for specific audits you'd like to see!

How to use it

Currently there are two ways to run these audits.

Using the Lighthouse Chrome Extension:

  1. Install the Lighthouse Chrome Extension
  2. Click on the Lighthouse icon in the extension bar 
  3. Select the Options menu, tick “SEO” and click OK, then Generate report

Running SEO Audits in Lighthouse extension


Using Chrome Developer tools on Chrome Canary:
  1. Open Chrome Developer Tools 
  2. Go to Audits 
  3. Click Perform an audit 
  4. Tick the “SEO” checkbox and click Run Audit

Running SEO Audits in Chrome Canary

The current Lighthouse Chrome extension contains an initial set of SEO audits which we’re planning to extend and enhance in the future. Once we're confident of its functionality, we’ll make the audits available by default in the stable release of Chrome Developer Tools.

We hope you find this functionality useful for your current and future projects. If these basic SEO tips are totally new to you and you find yourself interested in this area, make sure to read our complete SEO starter-guide! Leave your feedback and suggestions in the comments section below, on GitHub or on our Webmaster forum.

Happy auditing!

Posted by Valentyn, Webmaster Outreach Strategist.

Using page speed in mobile search ranking

People want to be able to find answers to their questions as fast as possible — studies show that people really care about the speed of a page. Although speed has been used in ranking for some time, that signal was focused on desktop searches. Today we’re announcing that starting in July 2018, page speed will be a ranking factor for mobile searches.

The “Speed Update,” as we’re calling it, will only affect pages that deliver the slowest experience to users and will only affect a small percentage of queries. It applies the same standard to all pages, regardless of the technology used to build the page. The intent of the search query is still a very strong signal, so a slow page may still rank highly if it has great, relevant content.

We encourage developers to think broadly how about performance affects a user’s experience of their page and to consider a variety of user experience metrics. Although there is no tool that directly indicates whether a page is affected by this new ranking factor, here are some resources that can be used to evaluate a page’s performance.

  • Chrome User Experience Report, a public dataset of key user experience metrics for popular destinations on the web, as experienced by Chrome users under real-world conditions
  • Lighthouse, an automated tool and a part of Chrome Developer Tools for auditing the quality (performance, accessibility, and more) of web pages
  • PageSpeed Insights, a tool that indicates how well a page performs on the Chrome UX Report and suggests performance optimizations

As always, if you have any questions or feedback, please visit our webmaster forums.

Android vitals: Increase engagement and installs through improved app performance

Posted by Fergus Hurley, Product Manager, Google Play

Poor app performance is something that many users have experienced. Think about that last time you experienced an app crashing, failing to respond, or rendering slowly. Consider your reaction when checking the battery usage on your own device, and seeing an app using excessive battery. When an app performs badly, users notice. In fact, in an internal analysis of app reviews on Google Play, we noticed that half of the 1-star reviews mentioned app stability.

Conversely, people consistently reward the best performing apps with better ratings and reviews. This leads to better rankings on Google Play, which helps increase installs. Not only that, but users stay more engaged, and are willing to spend more time and money.

At Google I/O 2017, we announced the new Android vitals dashboard in the Google Play Console. Android vitals is designed to help you understand and analyze bad app behaviors, so you can improve your app's performance and reap the benefits of better performance.

Android vitals in the Google Play Console

Android vitals helps identify opportunities to improve your app's performance. The dashboards are useful for engineers and business owners alike, offering quick reference performance metrics to monitor your app so you can analyze the data and dedicate the right resources to make improvements.

You'll see the following data collected from Android devices whose users have opted in to automatically share usage and diagnostics data:

  • Stability: ANR rate & crash rate
  • Render time: slow rendering (16ms) and frozen UI frames (700ms)
  • Battery usage: stuck wake locks and excessive wakeups

See how Busuu increased their rating from 4.1☆ to 4.5☆ by focusing on app performance

Busuu is one of the world's largest language learning apps. Hear from Antoine Sakho, Head of Product about how Busuu increased user ratings.

Learn more about engineering for high performance with tools from Android and Google Play

Read our best practice article on Android vitals to understand the data shown in the dashboards, and how you can improve your app's performance and stability. Watch the I/O session to learn about more tools from Android and Google Play that you can use to identify and fix bad behaviors:

Learn more about other Play Console features, and stay up to date with news and tips to succeed on Google Play, with the Playbook app. Join the beta and install it today.

How useful did you find this blogpost?

TensorFlow Benchmarks and a New High-Performance Guide

Posted by Josh Gordon on behalf of the TensorFlow team

We recently published a collection of performance benchmarks that highlight TensorFlow's speed and scalability when training image classification models, like InceptionV3 and ResNet, on a variety of hardware and configurations.

To help you build highly scalable models, we've also added a new High-Performance Models guide to the performance site on tensorflow.org. Together with the guide, we hope these benchmarks and associated scripts will serve as a reference point as you tune your code, and help you get the most performance from your new and existing hardware.

When running benchmarks, we tested using both real and synthetic data. We feel this is important to show, as it exercises both the compute and input pipelines, and is more representative of real-world performance numbers than testing with synthetic data alone. For transparency, we've also shared our scripts and methodology.

Collected below are highlights of TensorFlow's performance when training with an NVIDIA® DGX-1™, as well as with 64 NVIDIA® Tesla® K80 GPUs running in a distributed configuration. In-depth results, including details like batch-size and configurations used for the various platforms we tested, are available on the benchmarks site.

Training with NVIDIA® DGX-1™ (8 NVIDIA® Tesla® P100s)

Our benchmarks show that TensorFlow has nearly linear scaling on an NVIDIA® DGX-1™for training image classification models with synthetic data. With 8 NVIDIA Tesla P100s, we report a speedup of 7.99x (99% efficiency) for InceptionV3 and 7.91x (98% efficiency) for ResNet-50, compared to using a single GPU.
The following are results comparing training with synthetic and real data. The benchmark results show a small difference between training data placed statically on the GPU (synthetic) and executing the full input pipeline with data from ImageNet. One strength of TensorFlow is the ability of its input pipeline to saturate state-of-the-art compute units with large inputs.


Training with NVIDIA® Tesla® K80 (Single server, 8 GPUs)

With 8 NVIDIA® Tesla® K80s in a single-server configuration, TensorFlow has a 7.4x speedup on Inception v3 (93% efficiency) and a 7.4x speedup on ResNet-50, compared to a single GPU. For this benchmark, we used Google Compute Engine instances.

Distributed Training with NVIDIA® Tesla® K80 (up to 64 GPUs)

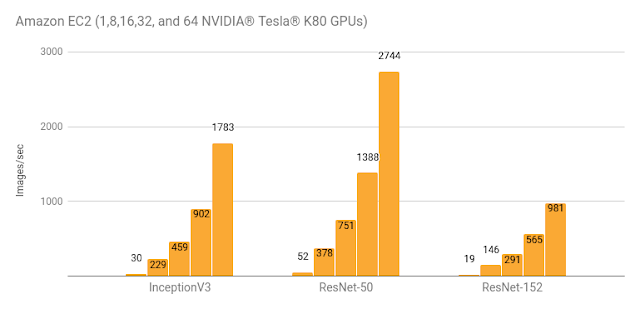
With 64 Tesla K80s running on Amazon EC2 instancesin a distributed configuration, TensorFlow has a 59x speedup (92% efficiency) for InceptionV3 and a 52x speedup (82% efficiency) for ResNet-50 using synthetic data.

Discussion

During our testing of the DGX-1 and other platforms, we explored a variety of configurations using NCCL, a collective communications library, part of the NVIDIA Deep Learning SDK. Our hypothesis before testing began was that replicating the variables across GPUs and syncing them with NCCL would be the optimal approach. The results were not always as expected. Optimal configurations varied depending not only on the GPU, but also on the platform and model tested. On the DGX-1, for example, VGG16 and AlexNet performed best when replicating the variables on each of the GPUs and updating them using NCCL, while InceptionV3 and ResNet performed best when placing the shared variable on the CPU. These intricacies highlight the need for comprehensive benchmarking. Models have to be tuned for each platform, and a one size fits all approach is likely to result in suboptimal performance in many cases.

To get peak performance, it is necessary to benchmark with a mix of settings to determine which ones are likely to perform best on each platform. The script that accompanies the article on creating High-Performance Models was created not only to illustrate how to achieve the highest performance, but also as a tool to benchmark a platform with a variety of settings. The benchmarks page lists the configurations that we found which provided optimal performance for the platforms tested.

As many people have pointed out in response to various benchmarks that have been performed on other platforms, increases to samples per second does not necessarily correlate to faster convergence, and as batch sizes increase it can be more difficult to converge to the highest accuracy levels.

As a team, we hope to do future tests that focus on time to convergence to high levels of accuracy. We hope these numbers and the guide will prove useful to you as you tune your code for performance.

We'd like to thank NVIDIA for sharing a DGX-1 for benchmark testing and for their technical assistance. We're looking forward to NVIDIA's upcoming Voltaarchitecture, and to working closely with them to optimize TensorFlow's performance there, and to expand support for FP16.

Thanks for reading, and as always, we look forward to working with you on forums like GitHub issues, Stack Overflow, the [email protected]list, and @TensorFlow.

Announcing Guetzli: A New Open Source JPEG Encoder

Crossposted on the Google Research Blog

At Google, we care about giving users the best possible online experience, both through our own services and products and by contributing new tools and industry standards for use by the online community. That’s why we’re excited to announce Guetzli, a new open source algorithm that creates high quality JPEG images with file sizes 35% smaller than currently available methods, enabling webmasters to create webpages that can load faster and use even less data.

Guetzli [guɛtsli] — cookie in Swiss German — is a JPEG encoder for digital images and web graphics that can enable faster online experiences by producing smaller JPEG files while still maintaining compatibility with existing browsers, image processing applications and the JPEG standard. From the practical viewpoint this is very similar to our Zopfli algorithm, which produces smaller PNG and gzip files without needing to introduce a new format; and different than the techniques used in RNN-based image compression, RAISR, and WebP, which all need client and ecosystem changes for compression gains at internet scale.

The visual quality of JPEG images is directly correlated to its multi-stage compression process: color space transform, discrete cosine transform, and quantization. Guetzli specifically targets the quantization stage in which the more visual quality loss is introduced, the smaller the resulting file. Guetzli strikes a balance between minimal loss and file size by employing a search algorithm that tries to overcome the difference between the psychovisual modeling of JPEG's format, and Guetzli’s psychovisual model, which approximates color perception and visual masking in a more thorough and detailed way than what is achievable by simpler color transforms and the discrete cosine transform. However, while Guetzli creates smaller image file sizes, the tradeoff is that these search algorithms take significantly longer to create compressed images than currently available methods.

orig-libjpeg-guetzli.png
Figure 1. 16x16 pixel synthetic example of  a phone line  hanging against a blue sky — traditionally a case where JPEG compression algorithms suffer from artifacts. Uncompressed original is on the left. Guetzli (on the right) shows less ringing artefacts than libjpeg (middle) and has a smaller file size.
And while Guetzli produces smaller image file sizes without sacrificing quality, we additionally found that in experiments where compressed image file sizes are kept constant that human raters consistently preferred the images Guetzli produced over libjpeg images, even when the libjpeg files were the same size or even slightly larger. We think this makes the slower compression a worthy tradeoff.

montage-cats-zoom-eye2.png
Figure 2. 20x24 pixel zoomed areas from a picture of a cat’s eye. Uncompressed original on the left. Guetzli (on the right) shows less ringing artefacts than libjpeg (middle) without requiring a larger file size.
It is our hope that webmasters and graphic designers will find Guetzli useful and apply it to their photographic content, making users’ experience smoother on image-heavy websites in addition to reducing load times and bandwidth costs for mobile users. Last, we hope that the new explicitly psychovisual approach in Guetzli will inspire further image and video compression research.

By Robert Obryk and Jyrki Alakuijala, Software Engineers, Google Research Europe

Building Indexable Progressive Web Apps

Progressive Web Apps (PWAs) are taking advantage of new technologies to bring the best of mobile sites and native applications to users -- and they’re one of the most exciting new ideas on the web. But to truly have an impact, it's important that they’re indexable and linkable. Every recommendation presented in this article is an existing best practice for indexability -- regardless of whether you're building a Progressive Web App or a simple static website. Nonetheless, we have collated these best practices to provide a checklist to guide you:

Make Your Content Crawlable

Why? Historically, websites would always generate or render their HTML on the server which is the simplest way to ensure your content is directly linkable. Web applications popularised the concept of client-side rendering in which content is updated dynamically on the page as the users navigates without requiring the page to be reloaded.

The modern approach is hybrid rendering, in which server-side rendering is used when a user navigates directly to a URL and client-side rendering is used after the initial page load for subsequent navigation and asynchronous requests.

Our server-side PWA sample demonstrates pure server-side rendering, while our hybrid PWA sample demonstrates the combined approach.

If you are unfamiliar with the server-side and client-side rendering terminology, check out these articles on the web read here and here.

Best Practice:

Use server-side or hybrid rendering so users receive the content in the initial payload of their web request.

Always ensure your URLs are independently accessible:

https://www.example.com/product/25/

The above should deep link to that particular resource.

If you can’t support server-side or hybrid rendering for your Progressive Web App and you decide to use client-side rendering, we recommend using the Google Search Console “Fetch as Google tool” to verify your content successfully renders for our search crawler.

Don’t:

Don't redirect users accessing deep links back to your web app's homepage.

Additionally, serving an error page to users instead of deep linking should also be avoided.


Provide Clean URLs

Why? Fragment identifiers (#user/24601/ or #!user/24601/) were an effective workaround for browsers to AJAX new content from a server without reloading the page. This design is known as client-side rendering.

However, the fragment identifier syntax isn’t compatible with some web tools, frameworks and protocols such as Facebook’s Open Graph protocol.

The History API enables us to update the URL without fragment identifiers while still fetching resources asynchronously and therefore avoiding page reloads -- it’s the best of both worlds. The AJAX crawling scheme (with its #! / escaped-fragment URLs) made sense at its time, but is now no longer recommended.

Our hybrid PWA and client-side PWA samples demonstrate the History API.

Best Practice:

Provide clean URLs without fragment identifiers (# or #!) such as:

https://www.example.com/product/25/

If using client-side or hybrid rendering be sure to support browser navigation with the History API.

Avoid:

Using the #! URL structure to drive unique URLs is discouraged:

https://www.example.com/#!product/25/

It was introduced as a workaround before the advent of the History API. It is considered a separate pattern to the purely # URL structure.

Don’t:

Using the # URL structure without the accompanying ! symbol is unsupported:

https://www.example.com/#product/25/

This URL structure is already a concept in the web and relates to deep linking into content on a particular page.


Specify Canonical URLs

Why? The best way to eliminate confusion for indexing when the same content is available under multiple URLs (be it the same or different domains) is to mark one page as the canonical, and all other pages that duplicate that content to refer to it.

Best Practice:

Include the following tag across all pages mirroring a particular piece of content:

<link rel="canonical" href="https://www.example.com/your-url/" />

If you are supporting Accelerated Mobile Pages be sure to correctly use its counterpart rel=”amphtml” instruction as well.

Avoid:

Avoid purposely duplicating content across multiple URLs and not using the rel="canonical" link element.

For example, the rel="canonical" link element can reduce ambiguity for URLs with tracking parameters.

Don’t:

Avoid creating conflicting canonical references between your pages.


Design for Multiple Devices

Why? It’s important that all your users get the best experience possible when viewing your website, regardless of their device.

Make your site responsive in its design -- fonts, margins, paddings, buttons and general design of your site should scale dynamically based on screen resolutions and device viewports.

Small images scaled up for desktop or tablet devices give a poor experience. Conversely, super high resolution images take a long time to download on mobile phones and may impact mobile scroll performance.

Read more UX for PWAs here.

Best Practice:

Use “srcset” attribute to fetch different resolution images for different density screens to avoid downloading images larger than the device’s screen is capable of displaying.

Scale your font size and line height to ensure your text is legible no matter the size of the device. Similarly ensure the padding and margins of elements also scale sensibly.

Test various screen resolutions using the Chrome Developer Tool’s Device Mode feature and Mobile Friendly Test tool.

Don’t:

Don't show different content to users than you show to Google. If you use redirects or user agent detection (a.k.a. browser sniffing or dynamic serving) to alter the design of your site for different devices it’s important that the content itself remains the same.

Use the Search Console “Fetch as Google” tool to verify the content fetched by Google matches the content a user sees.

For usability reasons, avoid using fixed-size fonts.


Develop Iteratively

Why? One of the safest paths to take when adding features to a web application is to make changes iteratively. If you add features one at a time you can observe the impact of each individual change.

Alternatively many developers prefer to view their progressive web application as an opportunity to overhaul their mobile site in one fell swoop -- developing the new web app in an isolated environment and swapping it with their existing mobile site once ready.

When developing features iteratively try to break the changes into separate pieces. For example, if you intend to move from server-side rendering to hybrid rendering then tackle that as a single iteration -- rather than in combination with other features.

Both approaches have their own pros and cons. Iterating reduces the complexity of dealing with search indexability as the transition is continuous. However, iterating might result in a slower development process and potentially a less innovative overhaul if development is not starting from scratch.

In either case, the most sensitive areas to keep an eye on are your canonical URLs and your site’s robots.txt configuration.

Best Practice:

Iterate on your website incrementally by adding new features piece by piece.

For example, if don’t support HTTPS yet then start by migrating to a secure site.

Avoid:

If you’ve developed your progressive web app in an isolated environment, then avoid launching it without checking the rel-canonical links and robots.txt are setup appropriately.

Ensure your rel-canonical links point to the real site and that your robots.txt configuration allows crawlers to crawl your new site.

Don’t:

It’s logical to prevent crawlers from indexing your in-development site before launch but don’t forget to unblock crawlers from accessing your new site when you launch.


Use Progressive Enhancement

Why? Wherever possible it’s important to detect browser features before using them. Feature detection is also better than testing for browsers that you believe support a given feature.

A common bad practice in the past was to enable or disable features by testing which browser the user had. However, as browsers are constantly evolving with features this technique is strongly discouraged.

Service Worker is a relatively new technology and it’s important to not break compatibility in the pursuit of progress -- it's a perfect example of when to use progressive enhancement.

Best Practice:

Before registering a Service Worker check for the availability of its API:

if ('serviceWorker' in navigator) {
...

Use per API detection method for all your website’s features.

Don’t:

Never use the browser’s user agent to enable or disable features in your web app. Always check whether the feature’s API is available and gracefully degrade if unavailable.

Avoid updating or launching your site without testing across multiple browsers! Check your site analytics to learn which browsers are most popular among your user base.


Test with Search Console

Why? It’s important to understand how Google Search views your site’s content. You can use Search Console to fetch individual URLs from your site and see how Google Search views them using the “Crawl > Fetch as Google“ feature. Search Console will process your JavaScript and render the page when that option is selected; otherwise only the raw HTML response is shown

Google Search Console also analyses the content on your page in a variety of ways including detecting the presence of Structured Data, Rich Cards, Sitelinks & Accelerated Mobile Pages.

Best Practice:

Monitor your site using Search Console and explore its features including “Fetch as Google”.

Provide a Sitemap via Search Console “Crawl > Sitemaps” It can be an effective way to ensure Google Search is aware of all your site’s pages.


Annotate with Schema.org structured data

Why? Schema.org structured data is a flexible vocabulary for summarizing the most important parts of your page as machine-processable data. This can be as general as simply saying that a page is a NewsArticle, or as specific as detailing the location, band name, venue and ticket vendor for a touring band, or summarizing the ingredients and steps for a recipe.

The use of this metadata may not make sense for every page on your web application but it’s recommended where it’s sensible. Google extracts it after the page is rendered.

There are a variety of data types including “NewsArticle”, “Recipe” & “Product” to name a few. Explore all the supported data types here.

Best Practice:

Verify that your Schema.org meta data is correct using Google’s Structured Data Testing Tool.

Check that the data you provided is appearing and there are no errors present.

Don’t:

Avoid using a data type that doesn’t match your page’s actual content. For example don’t use “Recipe” for a T-Shirt you’re selling -- use “Product” instead.


Annotate with Open Graph & Twitter Cards

Why? In addition to the Schema.org metadata it can be helpful to add support for Facebook’s Open Graph protocol and Twitter rich cards as well.

These metadata formats improve the user experience when your content is shared on their corresponding social networks.

If your existing site or web application utilises these formats it’s important to ensure they are included in your progressive web application as well for optimal virality.

Best Practice:

Test your Open Graph markup with the Facebook Object Debugger Tool.

Familiarise yourself with Twitter’s metadata format.

Don’t:

Don’t forget to include these formats if your existing site supports them.


Test with Multiple Browsers

Why? Clearly from a user perspective it’s important that a website behaviors the same across all browsers. While the experience might adapt for different screen sizes we all expect a mobile site to work the same on similarly sized devices whether it’s an iPhone or an Android mobile phone.

While the web can be perceived as fragmented due to number of browsers in use around the world, this variety and competition is part of what makes the web such an innovative platform. Thankfully, web standards have never been more mature than they are now and modern tools enable developers to build rich, cross browser compatible websites with confidence.

Best Practice:

Use cross browser testing tools such as BrowserStack.com, Browserling.com or BrowserShots.org to ensure your PWA is cross browser compatible.


Measure Page Load Performance

Why? The faster a website loads for a user the better their user experience will be. Optimizing for page speed is already a well known focus in web development but sometimes when developing a new version of a site the necessary optimizations are not considered a high priority.

When developing a progressive web application we recommend measuring the performance of your page load speed and optimizing before launching the site for the best results.

Best Practice:

Use tools such as Page Speed Insights and Web Page Test to measure the page load performance of your site. While Googlebot has a bit more patience in rendering, research has shown that 40% of consumers will leave a page that takes longer than three seconds to load..

Read more about our web page performance recommendations and the critical rendering path here.

Don’t:

Avoid leaving optimization as a post-launch step. If your website’s content loads quickly before migrating to a new progressive web application then it’s important to not regress in your optimizations.


We hope that the above checklist is useful and provides the right guidance to help you develop your Progressive Web Applications with indexability in mind.

As you get started, be sure to check out our Progressive Web App indexability samples that demonstrate server-side, client-side and hybrid rendering. As always, if you have any questions, please reach out on our Webmaster Forums.


XRay: a function call tracing system

At Google we spend a lot of time debugging and tuning the performance of our production systems. Some standard practices when doing this involves using profilers, debuggers, and analysis of logs and execution traces. Doing this at scale, in production, is difficult. One of the ways for getting high fidelity data from production systems is to build applications with instrumentation, and then reconstruct the instrumentation data into a form humans can consume (summary statistics, reports, etc.). Instrumentation comes at a cost though, sometimes too high to make it feasible to deploy in production.

Getting this balance right is hard. This is why we've developed XRay, a function call tracing system that has very little overhead when not enabled, but can be dynamically turned on and only impose moderate costs. XRay works as a combination of compiler-inserted instrumentation points which functionally do nothing (called "nop sleds") and a library that can be enabled and disabled at runtime which replaces the nop sleds with the appropriate instrumentation instructions.

We've been using XRay to debug internal systems, from core infrastructure services like Bigtable to ad serving systems. XRay's detailed function tracing has enabled several teams in Google to debug issues that would be really hard to solve without XRay.

We think XRay is an important piece of technology, not only at Google, but for developers around the world. It's because of this that we're working on making XRay opensource. To kick-start that process, we're releasing a white paper describing the technical details of XRay. In the following weeks, we will be engaging the LLVM community, where we are committed to making XRay available for wide use and distribution.

We hope that by open-sourcing XRay we can contribute to the advancement of debugging real-world applications. We're looking forward to working with the LLVM community and other projects to make the data XRay generates useful for debugging a wide variety of applications.

By Dean Michael Berris, Google Engineering

Get your bibs ready for Big Android BBQ!

Posted by, Colt McAnlis, Senior Texas Based Developer Advocate

We’re excited to be involved in the Big Android BBQ (BABBQ) this year because of one thing: passion! Just like BBQ, Android development is much better when passionate people obsess over it. This year’s event is no exception.

Take +Ian Lake for example. His passion about Android development runs so deep, he was willing to chug a whole bottle of BBQ sauce just so we’d let him represent Android Development Patterns at the conference this year. Or even +Chet Haase, who suffered a humiliating defeat during the Speechless session last year (at the hands of this charming bald guy). He loves BBQ so much that he’s willing to come back and lose again this year, just so he can convince you all that #perfmatters. Let’s not forget +Reto Meier. That mustache was stuck on his face for days. DAYS! All because he loves Android Development so much.

When you see passion like this, you just have to be part of it. Which is why this year’s BABBQ is jam packed with awesome Google Developers content. We’re going to be talking about performance, new APIs in Marshmallow 6.0, NDK tricks, and Wear optimization. We even have a new set of code labs so that folks can get their hands on new code to use in their apps.

Finally, we haven’t even mentioned our BABBQ attendees, yet. We’re talking about people who are so passionate about an Android development conference that they are willing to travel to Texas to be a part of it!

If BBQ isn’t your thing, or you won’t be able to make the event in person, the Android Developers and Google Developers YouTube channels will be there in full force. We’ll be recording the sessions and posting them to Twitter and Google+ throughout the event.

So, whether you are planning to attend in person or watch online, we want you to remain passionate about your Android development.

Hungry for some Big Android BBQ?

Posted by Colt McAnlis, Head Performance Wrangler

The Big Android BBQ (BABBQ) is almost here and Google Developers will be there serving up a healthy portion of best practices for Android development and performance! BABBQ will be held at the Hurst Convention Center in Dallas/Ft.Worth, Texas on October 22-23, 2015.

We also have some great news! If you sign up for the event through August 25th, you will get 25% off when you use the promotional code "ANDROIDDEV25". You can also click here to use the discount.

Now, sit back, and enjoy this video of some Android cowfolk preparing for this year’s BBQ!

The Big Android BBQ is an Android combo meal with a healthy serving of everything ranging from the basics, to advanced technical dives, and best practices for developers smothered in a sweet sauce of a close knit community.

This year, we are packing in an unhealthy amount of Android Performance Patterns, followed up with the latest and greatest techniques and APIs from the Android 6.0 Marshmallow release. It’s all rounded out with code labs to let you get hands-on learning. To super-size your meal, Android Developer instructors from Udacity will be on-site to guide users through the Android Nanodegree. (Kinda like a personal-waiter at an all-you-can-learn buffet).

Also, come watch Colt McAnlis defend his BABBQ “Speechless” Crown against Silicon Valley reigning champ Chet Haase. It'll be a fist fight of humor in the heart of Texas!

You can get your tickets here, and we look forward to seeing you in October!

Android M Developer Preview & Tools

By Jamal Eason, Product Manager, Android

Today at Google I/O, we announced a developer preview of the next version of Android, the M release. Last year’s developer preview was a first for Android and we received great feedback. We want to continue to give you developers early access to Android so you have time to get your apps ready for the next version of Android. This time with the M Developer Preview, we will provide a clear timeline for testing and feedback plus more updates to the preview build.

Visit the M Developer Preview for downloads and documentation

The Android M release: improving the fundamentals

For the M release, we focused on improving the core user experience of Android, from fixing thousands of bugs, to making some big changes to the fundamentals of the platform:

  • Permissions - We are giving users control of app permissions in the M release. Apps can trigger requests for permissions at runtime, in the right context, and users can choose whether to grant the permission. Making permission requests right when they’re needed means users can get up and running in your app faster. Also, users have easy access to manage all their app permissions in settings. On M, as a developer, you should design your app to prompt for permissions in context and account for permissions that don’t get granted. As more devices upgrade to M, app permission behavior will be a critical development flow to test.
  • Runtime App Permissions

  • App links - We are making it even easier to link between apps. Android has always allowed apps to register to natively handle URLs. Now you can add an autoVerify attribute to your app manifest so that users can be linked deep into your native app without any disambiguation prompt. App links, along with App Indexing for Google search, make it easier for users to discover and re-engage with your app.
  • Battery - We’re making Android devices smarter about managing power through a new feature called Doze. With M, Android uses significant motion detection to learn if a device has been left unattended for a while. In this state, Android will exponentially back off background activity, trading off a little bit of app freshness for longer battery life. Consider how this may affect your app; for instance, if you’re building a chat app, you may want to make use of high priority messages to wake your app when the device is dozing.

The Android M release: advancing assistance and payments

We are also delighted to announce a couple of big new features:

  • Now on tap - We are making it even easier for Android users to get assistance with Now on tap -- whenever they need it, wherever they are on their device. For example, if your friend texts you about dinner at a new restaurant, without leaving the app, you can ask Google Now for help. Using just that context, Google can find menus, reviews, help you book a table, navigate there, and deep link you into relevant apps. As a developer, you can implement App Indexing for Google search to let users discover and re-engage with your app through Now on tap.
  • Now on tap

  • Android Pay & Fingerprint - We’ve built on our work with Near Field Communications (NFC) in Gingerbread and Host Card Emulation in Kitkat to develop Android Pay. Android Pay will enable Android users to simply and securely use their Android phone to pay in stores or in thousands of Android Pay partner apps. With M, native fingerprint support enhances Android Pay by allowing users to confirm a purchase with their fingerprint. Moreover, fingerprint on M can be used to unlock devices and make purchases on Google Play. With new APIs in M, it’s easy for you to add fingerprint authorization to your app and have it work consistently across a range of devices and sensors.

These are just a few highlights from the M Developer Preview that we announced today. The M preview will be available for download right after the keynote.

Android Developer Tools

In addition to the developer preview, we are launching new tools to help you in the development of your Android App:

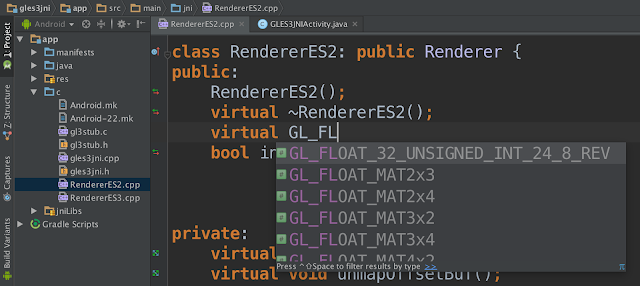
  • Android Studio v1.3 Preview - To help take advantage of the M Developer Preview features, we are releasing a new version of Android Studio. Most notable is a much requested feature from our Android NDK & game developers: code editing and debugging for C/C++ code. Based on JetBrains Clion platform, the Android Studio NDK plugin provides features such as refactoring and code completion for C/C++ code alongside your Java code. Java and C/C++ code support is integrated into one development experience free of charge for Android app developers. Update to Android Studio v1.3 via the Canary channel and let us know what you think.
  • Android Studio 1.3 with Android NDK Support

  • Android Design Support Library - Making Material design apps gets even easier with the new Android Design support library. We have packaged a set a key design components (e.g floating action button, snackbar, navigation view, motion enabled Toolbars) that are backward compatible to API 7 and can be added to your app to create a modern, great looking Android app without building everything from scratch.
  • Google Play Services - Today we also are releasing v7.5 of Google Play services which includes new features ranging from Smart Lock for Passwords, new APIs for Google Cloud Messaging and Google Cast, to Google Maps API on Android Wear devices.

Get Started

The M Developer Preview includes an updated SDK with tools, system images for testing on the official Android emulator, and system images for testing on Nexus 5, Nexus 6, Nexus 9, and Nexus Player devices. We are excited to expand the program and give you more time to ensure your apps support M when it launches this fall. Based on your feedback, we plan to update the M Developer preview system images often during the developer preview program. The sooner we hear from you, the more feedback we can integrate, so let us know!

To get started with the M Developer Preview and prepare your apps for the full release, just follow these steps:

  1. Update to Android Studio v1.3+ Preview
  2. Visit the M Developer Preview site for downloads and documentation.
  3. Explore the new APIs & App Permissions changes
  4. Explore the Android Design Support Library & Google Play Services APIs
  5. Get the emulator system images through the SDK Manager or download the Nexus device system images.
  6. Test your app with your supported Nexus device or emulator
  7. Give us feedback