Tag Archives: Google Earth

New views of beauty and fragility in underwater Street View

Editor’s note: Today’s post is by Lorna Parry, co-founder and managing director of Underwater Earth, a nonprofit that reveals stories about the ocean through technology. In honor of World Oceans Day on June 8, Lorna talks about new underwater Street View images from around the world, and how the images reveal the ocean environment.

Under the surface of the ocean lies a magical and beautiful world that most of us never get to see. Along with the beauty, there are also sobering reminders of humanity's impact on the ocean—like bleached and dying coral and plastics that marine life consume. We hope our new underwater Street View images, available today in a Google Earth collection, will encourage people to fall in love with the ocean—both its beauty and fragility—and want to protect it.

I’ve been diving for decades and have been fortunate to see wonders like Australia’s Great Barrier Reef up close. But you don’t have to put on diving gear to experience these wonders. At Underwater Earth, we create 360-degree views of the undersea environment because we believe seeing what's happening under the ocean builds understanding and appreciation for protecting it. We don’t create these images because we want people to despair about the fate of the ocean, rather we want people to be inspired to save the beauty they see.

Our newest underwater Street View images, like the Great Barrier Reef’s Lizard Island and New Caledonia’s coral lagoons, are breathtaking. If you don’t know a lot about coral reefs, then the color and variety can seem amazing. But the fluorescing colors are signs that the coral are trying, but failing, to protect themselves from the effects of the warming ocean—what we call “nature’s most beautiful death.”

Visual GIF

See a stunning display of fluorescing under extreme ocean warming conditions in the coral lagoons of New Caledonia. Image collect by Underwater Earth / XL Catlin Seaview Survey.


Other new imagery in the collection shows “Million Dollar Point” in the Vanuatu archipelago in the South Pacific, where Jeeps and bulldozers were dumped when the U.S. Army left the area after World War II. The images are a reminder of the vision of the ocean as a place to endlessly dispose of rubbish, with no harm done. But the eight million tons of plastic that are dumped into the ocean each year doesn’t disappear. It harms marine life, and as marine life consumes the plastics it ends up in our food.

Chromebook Visual

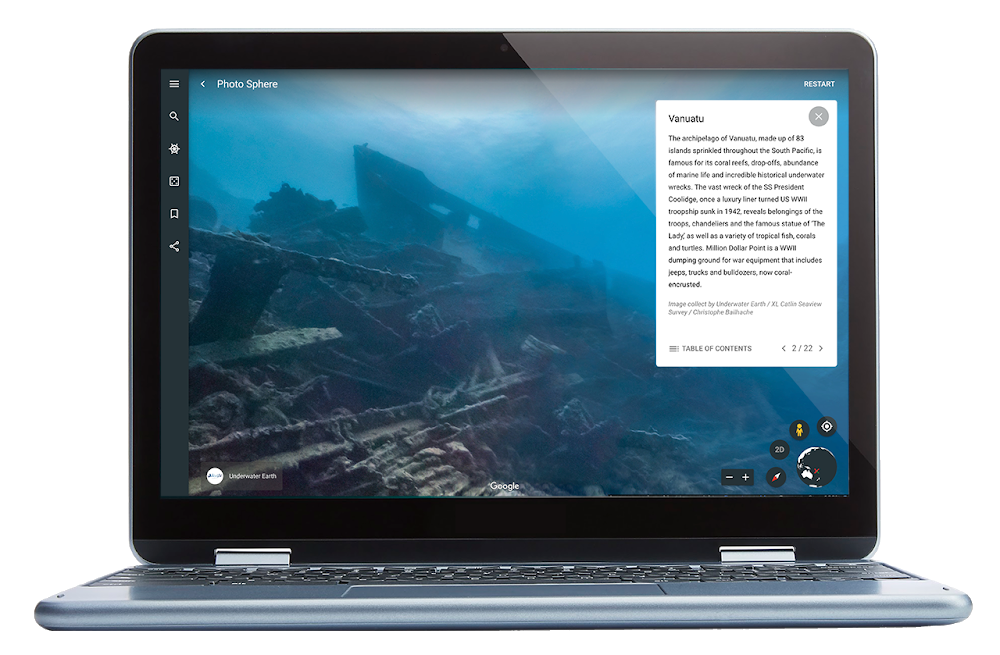
Explore shipwrecks at “Million Dollar Point” in the Vanuatu archipelago. Image collect by Underwater Earth / XL Catlin Seaview Survey / Christophe Bailhache.


Inspired to act

Saving the ocean is not just about saving its beauty. It’s also about saving the planet, and ourselves, from the effects of climate change. The ocean provides us with oxygen and food. It absorbs heat to stabilize global temperatures. It drives our climate and our weather. Shouldn’t we become better acquainted with the ocean and do our part to protect it?

If people are inspired to protect the ocean, there are simple steps to take. You can reduce your reliance on plastic or buy sustainably sourced fish whose harvesting minimally impacts the marine environment. Every action, no matter how small, can make a difference.

The wonderful thing about seeing underwater Street View images is that they encourage people to learn more and to ask questions. When I take the images into classrooms, kids call me the “Ocean Lady” and ask if I’ve ever seen sharks. (The answer is yes: tiger sharks, whale sharks, grey reef sharks, black tip reef sharks, hammerheads—all of them are sleek, powerful and commanding creatures.) I hope these school kids will one day learn to dive, like my 9-year-old daughter. Then they can see the ocean’s magic and all of these sharks for themselves.

Pixel Visual

The World’s Ocean collection is available on Google Earth for web and mobile. Right: Image collect by Underwater Earth / XL Catlin Seaview Survey / Christophe Bailhache.


In the meantime, we have underwater Street View images to inspire awe about the ocean. You’ll find these images, and all underwater Street View images to date, in this Google Earth collection. They’re part of a new Street View category that’s available in Voyager on Earth for Web, Android, and iOS. Take some time to explore images like the Julian Rocks Nguthungulli Nature Reserve. One look at the Eastern Striper fish and spotted wobbegong sharks, and you can’t help falling in love with the ocean and wanting to save it.

Carmen Sandiego is back on Google Earth, gumshoe

This March, we put out the call for super sleuths to help us track down Carmen Sandiego in Google Earth. And we were blown away by the enthusiasm and speed with which people found the reformed VILE operative—who is now an ACME agent—by traveling from city to city around the globe.

You not only solved the caper, but also shared stories and memories of playing the original games, watching the shows (both old and new) and sharing the experience with friends, family and kids.

Today, we’ve teamed up with Carmen Sandiego once again—this time to help her recover Tutankhamun’s Mask. Le Chevre, a master climber and classmate of Carmen Sandiego at VILE Academy, has stolen the priceless artifact. We’re counting on gumshoes everywhere to help Carmen find him and recover the loot.

Trailer

To get your assignment, look for the special edition Pegman icon in Google Earth for Chrome, Android and iOS. Good luck, detectives!

After school, this teen tracks climate change with NASA

Editor's Note: Liza Goldberg is a 17-year-old scientist interning at NASA Goddard Space Flight Center’s Biospheric Sciences Lab. Today, she shares how Google Earth Engine helps her monitor mangroves, which are ecosystems vital to the sustainability of coastal communities around the world.  

I first heard the words “climate change” when I was 9. As a fourth-grade student in Maryland, my class studied the local Chesapeake Bay; we raised horseshoe crabs and observed the effects of extreme weather and sea level rise on the ecosystem. After studying the human-environment interactions in my community and the broader region, I decided I wanted to dedicate my life to curbing climate change.

Two years later, I began a science fair project to study the impacts of simulated warming on the carbon dioxide exchange of red maple saplings. Every weekend for three years, I used a gas analyzer to test eight trees I planted in my backyard, and submitted the project to a local fair. I explained my research to a judge, who connected me with scientists in NASA Goddard Space Flight Center’s Biospheric Sciences Lab. Thanks to that connection, I went from testing saplings in my backyard to working with a world-renowned team of forest change scientists at age 14.

Liza Goldberg, teen scientist

Building the artificial warming chambers for my science project in my backyard.


My research group studies mangrove forests, which are vital coastal ecosystems that buffer infrastructure during extreme weather and support local fisheries. When I first began my internship at NASA in 2016, I had never heard of mangroves or learned about the scope of global forest losses, but I began reading news articles about a series of widespread mangrove losses occurring in the Gulf of Carpentaria in Australia. Thousands of hectares of forests died that year, and scientists didn’t gain a complete understanding of what caused the devastation until much later. I decided to build a program that could use satellite imagery to monitor the location and drivers of mangrove loss, potentially helping to prevent another large-scale dieback in the future.

Google Earth Engine provided me with the scope of datasets and computing power necessary to analyze forest change on a global scale. I began my project at NASA with no knowledge of satellites or image processing, but guidance from my mentors, Dr. David Lagomasino and Dr. Lola Fatoyinbo, and my intensive studying of the Earth Engine developer resources helped me move from endless notes and plans to actual working code.

In mapping past global mangrove losses and drivers, we used long-term Landsat satellite imagery to identify regions of disturbance. Machine learning algorithms helped to identify where mangroves were converted to urban regions, agriculture, aquaculture or mudflats. Using the Earth Engine Apps interface, we’re working towards making our data both openly accessible and widely understandable for users of any background. Communicating our results at a comprehensible level is arguably as important as the science itself, as the ultimate goal of the project is to deliver our data to mangrove-reliant communities on the ground.

The beginning stages of EcoMap, a global mangrove loss and vulnerability system

The beginning stages of EcoMap, a global mangrove loss and vulnerability system

We’re currently working with conservationists and researchers at The Everglades Foundation to use our mangrove loss driver data to understand the impacts of sea level rise and hurricanes in Everglades National Park. In the future, we also aim to provide coastal communities in East Africa with the real-time loss and loss driver data necessary to sustainably manage and conserve local forests.

My story is just one example of the impact of mentorship and resources on research development, regardless of age. I entered my NASA project with a set of seemingly unattainable goals, and the combination of my mentors’ guidance and Earth Engine’s power helped to make them reality. As this field progresses, I am excited to continue using Earth Engine as a means of monitoring a changing planet and balancing its needs with those of society.  

Get lost in the new Earth Timelapse, now on mobile

Today we’re introducing several updates to Google Earth Timelapse, a global, zoomable time-lapse video that lets anyone explore the last 35 years of our changing planet’s surface—from the global scale to the local scale. This update adds two additional years of imagery to the time-series visualization, now spanning from 1984 to 2018, along with mobile support and visual upgrades to make exploring more accessible and intuitive.

Desktop and Mobile

Timelapse provides a comprehensive picture of our changing Earth—including stunning phenomena like the sprouting of Dubai’s Palm Islands, the retreat of Alaska’s Columbia Glacier and the impressive urban expansion of Las Vegas, Nevada (seen below).

Scientists, documentarians and journalists have used this dataset to help us better understand the complex dynamics at work on our planet. News outlets have brought their reporting to life with Timelapse imagery, from coverage of the floods in Houston, Texas to population monitoring. Recently, a team of scientists at the University of Ottawa published an article Nature based on the Timelapse dataset which revealed a 6,000 percent increase in landslides on a Canadian Arctic island since 1984. Starting this week, if you’re in the U.K., you can see Timelapse imagery featured in Earth From Space, a new BBC series about the incredible discoveries and perspectives captured from above. 

Zeit

Zeit Online uses Timelapse to show the extent to which jungles are cleared for soy production in Brazil.

Using Google Earth Engine, Google's cloud platform for petabyte-scale geospatial analysis, we combined more than 15 million satellite images (roughly 10 quadrillion pixels) to create the 35 global cloud-free images that make up Timelapse. These images come from the U.S. Geological Survey/NASA Landsat and European Sentinel programs. Once again, we joined forces with our friends at Carnegie Mellon’s CREATE Lab, whose Time Machine video technology makes Timelapse interactively explorable.

Today's update also adds mobile and tablet support, making it a little easier for you to explore, research or get lost in the imagery—from wherever you are. Up until recently, mobile browsers disabled the ability to autoplay videos, which is critical for Timelapse (since it’s made up of tens of millions of multi-resolution, overlapping videos). Chrome and Firefox reinstated support for autoplay (with sound muted), so we’ve added mobile support with this latest update.

Timelapse Phone

Earth Timelapse, now available on phones and tablets, includes a handy new "Maps Mode" toggle to let you navigate the map using Google Maps.

The design of the new Timelapse interface leverages Material Design with simple, clean lines and clear focal areas, so you can easily navigate the immense dataset. We contributed this new user interface to the open-source Time Machine project, used by Carnegie Mellon and others. Read more about our design approach at Google Design.

We’re committed to creating products like Timelapse with the planet in mind, and hope that making this data easily accessible will ground debates, encourage discovery, and inform the global community’s thinking about how we live on our planet. Get started with Timelapse on the Earth Engine website, or take a mesmerizing tour of the world through YouTube.


Visit the U.S. National Parks in Google Earth

Each spring, the National Park Service and the National Park Foundation dedicate a week to celebrating the protected spaces in our communities. Today, we’re bringing the national parks to you in a Google Earth guided tour through 31 different parks around the country.


From the breathtaking vistas of the Shenandoah Valley to the awe-inspiring hoodoos of Bryce Canyon, the National Parks allow us to truly experience the natural wonders of our country. Start with the pink granite formations of Otter Cliff in Maine’s Acadia National Park, then head west to explore the ancient Pueblo dwellings of Mesa Verde National Park in Colorado. Finally, complete your journey with a peek through the North Window arch in Utah’s Arches National Park.

Once you’ve virtually explored the national parks in Google Earth, we encourage you to put down your phone, put on some sunscreen and get outside to explore the wonders that our parks system has to offer. Start by finding the park closest to you.


Down under, over and all around: Sydney in 3D on Google Earth

Google Earth is one of the world's most comprehensive 3D maps available. In addition to global satellite and terrain coverage, over the past several years we've been adding highly detailed 3D imagery of entire cities and towns, from the iconic architecture of cities like New York and Paris to views of landmarks like the Grand Canyon. And now, we’re sharing 3D imagery of central Sydney, Australia!

But 3D imagery of Sydney isn’t the only thing that’s new today. We've made many incremental improvements to our modeling process that, overall, help us achieve an even more precise 3D landscape. (You can check out this video to learn more about the process.) For a while now, parts of Sydney—sites like Sydney Harbour Bridge and Bondi Beach—have already been available in 3D. Expect to see this quality across all of our new Earth imagery.

Central Sydney sits beneath busy airspace, so it’s taken a while to make 3D models of the area. We’ve finally collected enough imagery to build a more complete picture of this iconic city. Explore landmarks like the Sydney Opera House and popular tourist spots Darling Harbour and The Rocks. You can even plan your next visit to Sydney with our guided tour, Explore Sydney.

You can see all the places where we have 3D imagery available in Google Earth.

Source: Google LatLong


Rove around “Mars on Earth” in Street View

Devon Island, a desolate land mass in Canada’s Arctic with a polar climate and treacherous terrain, is the largest uninhabited island on Earth. Yet the factors that make the island unlivable also make it indispensable to the scientists and researchers who work there—its climate and landscape are the closest thing to Mars that can be found on Earth.  

Mars on Earth: A Visit to Devon Island

Now anyone can visit "Mars on Earth" in Street View. Last year, I received a special invite from Dr. Pascal Lee, chairman of the Mars Institute and director of the Haughton-Mars Project, to visit Devon Island and learn about the research done there. We spent three months preparing for the expedition, and after 72 hours on seven flights, found ourselves at basecamp surrounded by an untouched landscape.

Devon Island, much like a future base on Mars, lacks the infrastructure we take for granted. All the supplies needed for camp—food, gasoline, tools and personal supplies—must be brought along on each excursion, and all the waste packed up and brought back to the mainland. At the research base, everyone has their job. Even Dr. Lee’s dog KingKong has a responsibility—he’s there to serve as an advance warning in case a polar bear wanders into camp.


Every morning, before heading out to collect Street View on ATVs, we would brief as a group to make sure everybody knew the plan that day: who was leading, who would ride rear, and who was staying at camp to cook and handle maintenance. This provided a real insight into how humans who will go to Mars will explore the new planet: detailed planning and preparation is key.

Visit Devon Island in Google Earth

Visit Devon Island on Google Earth

Throughout the week, we rode to some of the places of most interest to NASA’s research and exploration: Haughton Crater, an impact crater 20-kilometers in diameter; Astronaut Canyon, similar to many of the V-shaped, winding valleys on Mars; and the ancient lake beds of Breccia Hills. What strikes you most about Devon Island is how vast and desolate everything is. Yet every rock, hill and canyon tells a story. Breccia Hills, for example, is filled with shatter cones, rocks created by meteor impact millions of years ago.

We were also able to capture our experience on a Pixel 3, shooting the first-ever documentary filmed on Pixel to showcase just how majestic, and sometimes trying, training for a Mars Mission on Devon Island can be.


Explore “Mars on Earth” and learn about the work being done there in a new Google Earth guided tour.

A new app to map and monitor the world’s freshwater supply

Water affects all of us, no matter where we live. Drought harms everyone, from farmers in the western United States dealing with long-term drought, to people in Kazakhstan and Uzbekistan suffering debilitating health consequences from the Aral Sea draining, to millions of people displaced by floods in Kerala, India. About four billion people, or almost two-thirds of the world’s population, experience severe water scarcity at least one month of the year.


Water, critical to daily life, and a key priority in the United Nations Sustainable Development Goals (SDG 6), has proven difficult for most countries to measure. In 2017, of the roughly 200 United Nations Environment member countries, 80 percent of them were unable to provide fundamental national statistics. Even still, many knew substantial changes were happening.
2

The Aral Sea has shrunk by around 80 percent since 1985

Today, on World Water Day, we’re proud to showcase a new platform enabling all countries to freely measure and monitor when and where water is changing: UN’s Water-Related Ecosystems, or sdg661.app. Released last week in Nairobi at the UN Environment Assembly (UNEA), the app provides statistics for every country’s annual surface water (like lakes and rivers). It also shows changes from 1984 through 2018 through interactive maps, graphs and full-data downloads.

This project is only possible because of the unique partnerships between three very different organizations. In 2016, European Commission's Joint Research Centre (JRC) and Google released the Global Surface Water Explorer in tandem with a publication in “Nature.” An algorithm developed by the JRC to map water was run on Google Earth Engine. The process took more than 10 million hours of computing time, spread across more than 10,000 computers in parallel, a feat that would have taken 600 years if run on a modern desktop computer. But the sheer magnitude of the high resolution global data product tended to limit analysis to only the most tech savvy users and countries.

The new app, created in partnership with United Nations Environment, aims to make this water data available to everyone. Working with member countries to understand their needs, it features smaller, more easily manageable tables and maps at national and water body levels. Countries can compare data with one another, and for the first time gain greater understanding of the effects of water policy, and infrastructure like dams, diversions, and irrigation practices on water bodies that are shared across borders.
3

Lake Mead, the largest man-made reservoir in the United States, has fluctuated as Las Vegas expands.

Lakes

Egypt's Toshka Lakes lakes were created by diverting water from Lake Nasser so crops could be irrigated in the desert region. When the project was abandoned, the lakes evaporated.

Today, countries have very different capacities when it comes to monitoring their waters. Countries with substantial existing resources have found the app results align closely with their current methods, and are evaluating using this new data source, which will enable them to reallocating resources toward other priorities in the future. For countries that have never had this information, the app provides free, scientifically validated data, that will now inform their environmental policies. For the first time ever, we have a globally consistent way of measuring water and its changes over time. And it’s accessible to everyone.


The UN’s theme for this year’s World Water Day is “Leaving no one behind,” and we’re working to do just that. Google platforms are playing an important role to help every country better understand their own environment and resources, so we can all design for a sustainable world.

Your mission, gumshoe: Catch Carmen Sandiego in Google Earth

I distinctly remember being tucked into the couch, computer on and ready for the chase. With my assignment from ACME (first stop: Paris) I traveled from Singapore to Tokyo to Kathmandu chasing VILE villains, always on the lookout for that iconic scarlet coat and fedora.

Like many of my friends, I spent much of my time in the ‘90s obsessing over “Where in the World Is Carmen Sandiego?”—the games, the cartoon and the classic game show. I can remember Carmen Sandiego teaching me the currency of Hungary (forint), the capital of Iraq (Baghdad), and dozens of country flags—Argentina’s blue and white, Germany’s black, red and gold.

But Carmen Sandiego was more than just fun facts for children and adults alike. The globe-trotting game taught me the world was bigger than my couch, and got me excited to learn about new cultures and customs. That curiosity has taken me to more than 30 countries. (Carmen’s also responsible for a theme song that has been stuck in my head for decades.)

Where on Google Earth is Carmen Sandiego?

To celebrate the global explorer in all of us, today we’re introducing The Crown Jewels Caper, the first in a series of Carmen Sandiego games in Google Earth. Created in collaboration with Houghton Mifflin Harcourt, the home of Carmen Sandiego, our game is an homage to the original. It’s for all those gumshoes who grew up with the chase, and for the next generation feeling that geography itch for the first time.

Carmen_Game.png

To get your assignment, look for the special edition Pegman icon in Google Earth for Chrome, Android and iOS. Good luck, super sleuths!

To help make Google more inclusive, I had to understand my journey

I was born to a black father and a white mother in 1967, and at that time, it was illegal for them to get married. That changed two months after I was born, in June of that year, courtesy of the Supreme Court’s unanimous decision in Loving v. Virginia.

Throughout my life, from a childhood in Texas to a career in computer science, I have faced discrimination in ways both seen and unseen. Now at Google, I strive to make my team, and the products we create, inclusive and welcoming to everyone. But before my journey would lead me to this perspective, I first needed to reconcile with my past.

Camie Hackson childhood

By 1969, two years after Loving v. Virginia, my parents felt they could get married without fear of arrest. I attended the ceremony.

What most folks would understand as racism, I only knew as life in Texas. I knew that my mother was less likely than my father to be pulled over by the police, and that my white classmate’s parents wouldn’t allow him to take me to the freshman dance. But I never fully considered the external factors that made this a reality. For me, it was simple: Society was a system with rules, and those rules didn’t work for me the way they did for everyone else.

I carried this attitude with me to college. Berkeley was a considerably more diverse space than San Antonio, but as I looked around my computer science classes, I didn’t see much of anyone who looked like me. But if Texas had taught me anything, it was that there was very little time for me to feel sorry for myself. In the face of adversity, you work harder. And that’s what I did. I put my head down and focused all of my energies on studying, soaking up as much knowledge as I could.

Camie Hackson college

Growing up, managing my hair was always an ordeal, and something my mother had never encountered before. In 1988, I met a hairstylist in Berkeley who taught me how to manage it, and they submitted this style to an industry magazine.

This perseverance landed me in Silicon Valley, where I began my career as a software engineer. Despite my best efforts to work hard and advance, I began noticing a trend. I kept receiving feedback that I wasn’t technical enough. Of course, I wouldn’t have gotten to where I was if that were actually true. In reality, it was never about being “technical enough.” It was a matter of looking technical enough. Technical people looked like the dominant culture in the industry, and that certainly wasn’t a black woman.

But I didn’t complain. Instead, I took on technical tasks that typically would be assigned to my direct reports. I started wearing my glasses, and I took off my jewelry. I performed a version of myself that reflected those around me. I did whatever I could to not only look the part, but prove it in ways not required of my peers. I dedicated as much time to acting my role as I did executing it.

This wasn't just my problem. It was a societal issue.

After 24 years in the industry, I rose to the ranks of engineering director at Google in 2012. Beyond my technical achievements, I became known for putting together great teams. My manager at that time asked me to lead our team’s Diversity and Inclusion efforts. I thought I was totally ignorant about the subject—but I quickly learned the challenges I faced weren’t just specific to my experience.

As I began to educate myself, I and many others were being introduced to the demographics of the tech industry for the first time. I was aware of the fact that I was usually the only minority in my room, but not until that point did I realize that it was like this in nearly every room. I began talking to the people around me, listening to their stories. Years of accepting my narrative as uniquely my own had proven false. This wasn’t just my problem, it was a societal issue. There were many others in my position, and I made it a priority to help them navigate our collective reality.

Camie Hackson

Since then, my work in Diversity and Inclusion at Google has transformed considerably. What began as a push to teach minorities how to survive in tech has moved towards a push for a radical shift in culture. In my career, I needed those “survival” skills. I am a black woman in tech; I wouldn’t be here without the skills I have honed over the years. But today, we want more than survival in the workplace—we want people to thrive.

I’m part of the Geo group at Google, where my team works on products like Google Maps Platform and Earth Engine. We create tools for everyone, and in order to do this effectively, it is imperative that we have a team that reflects that diversity. But if a diverse team is spending half their efforts convincing others that they belong, what’s the point? Change begins at the top, and so that’s where I’ve focused my attention.

Because leadership carries an outsized impact on culture, we’ve trained our managers on not only the importance of diversity but provided them with the tools to foster an inclusive workplace. We tasked them with pushing their teams to bring their stories to work and share them with colleagues. By doing so, we can foster a culture of understanding people for who they are and not who they feel they need to be.  And so far, I’m proud to say that it’s working.

I’m hopeful for the future, because of how far we’ve come. This journey is not simply my own, but a reality for many. Those who came before me have had to deal with it, and I know my daughters will too. But we can and will be better. Our journey has shown us that.