Tag Archives: Google Analytics

Get the most out of Data Studio Community Connectors

Data Studio Community Connectors enable direct connections from Data Studio to any internet accessible data source. Anyone can build their own Community Connector or use any available ones.

Try out the new Community Connectors in the gallery

We have recently added additional Community Connectors to the Data Studio Community Connector gallery from developers including: DataWorx, Digital Inspiration, G4interactive, Kevpedia, Marketing Miner, MarketLytics, Mito, Power My Analytics, ReportGarden, and Supermetrics. These connectors will let you access data from additional external sources, leveraging Data Studio as a free and powerful reporting and analysis solution. You can now use more than 50 Community Connectors from within the Gallery to access all your data.

Try out these free Community Connectors: Salesforce, Twitter, Facebook Marketing.

Find the connector you need

In the Data Studio Community Connector gallery, it is possible for multiple connectors to connect to the same data source. There are also instances where a single connector can connect to multiple data sources. To help users find the connector they need, we have added the Data Sources page where you can search for Data Sources and see what connectors are available to use. The connector list includes native connectors in Data Studio as well as verified and Open Source Community Connectors. You can directly use the connectors by clicking the direct links on the Data Sources page.

Vote for your data source

If your data source is not available to use through any existing connector, you can Vote for your data source. This will let developers know which Data Sources are most in demand. Developers should also let us know which Community Connector you are building. We will use this information to update the Data Sources page.

Tell us your story

If you have any interesting connector stories, ideas, or if you’d like to share some amazing reports you’ve created using Community Connectors please let us know by giving us a shout or send us your story at [email protected].

Google Analytics for Firebase: New Look and New Features

If you use Google Analytics for Firebase to measure your apps, you'll notice something familiar today: a new look and feel that's more consistent with your Google Analytics experience.

These new elements echo some of the changes we made to Google Analytics earlier this year — the updates should help bridge the gap for anyone who uses both Google Analytics and Google Analytics for Firebase. We've also added new reports and cards that will make the Google Analytics for Firebase Dashboard more timely and helpful.

Real-Time Data 


We are now providing you with more real-time information throughout Google Analytics for Firebase to give you a better read on what’s happening in your app.

Inside the Google Analytics for Firebase Dashboard, you’ll now find a real-time card, much like the one on the Google Analytics Home. It shows details on the number of active users in the past 30 minutes. You'll also see the top conversion events logged by the app. You can configure these conversions so you can track app events that are most important to your team.


The new Google Analytics for Firebase Dashboard
 
Google Analytics for Firebase has a brand new stability card that reports on data from Firebase Crash Reporting and Firebase Crashlytics. It displays the percentage of users who have not had their app crash, so you can see just how stable your app is.

Latest Release 


The new Latest Release report lets app developers track the adoption and stability of new app versions within a few hours of release.

The report also contains a real-time card with an app version filter that lets you see which users have adopted the latest version of a release and know whether any versions have crashed in the past 30 minutes. It also lets you measure your users’ level of engagement.

Same Great Analytics 


The updated experience is more consistent with Google Analytics, but one thing hasn't changed: Google Analytics for Firebase users still get the same great app-centric reporting and analysis they're used to for Android and iOS. Our engineers are working on developments and new features we'll share in the months to come.

To see the new look and updated features, check out your Firebase project now. (Don't have one yet? Sign up!)


New tools for managing Google Analytics users

Last month we announced new account management tools for businesses using Google Analytics. Today we’re thrilled to introduce another round of improvements. Over the coming months, we’ll centralize user management across a company’s many Google Analytics accounts and launching user groups to simplify the task of managing permissions for multiple teams of users. We've heard feedback from many businesses about the need for simple but powerful tools to manage access to their important analytics data and built these features help to meet these needs.

Centralized user management

Administrators can now centrally manage users across all Google Analytics accounts linked to your organization. If you have many accounts, and need to add users across them, you’ll see huge time savings. For example, if you need to give a new teammate access to 25 accounts, you previously had to visit every account to get them setup. Now you can complete this task from one place.
Centralized user management for an organization

You can also:
  • View rich cross product and cross account details for your users
  • Manage a user’s access across many Analytics accounts in one console
  • See new details about how a user inherits their permissions
  • Get clear in-product explanations of different access levels and privileges
User details showing access across products and accounts


If you’re just using Google Analytics, and don’t need to manage users across accounts, you’ll see many of these same improvements inside of Google Analytics. All of the navigation and documentation improvements are present in both places.

User Groups in Google Analytics

Organization administrators often need to manage access for hundreds of users. This process can be tedious, especially when dealing with multiple Analytics accounts. Now you can more easily manage large teams of users by creating a group, placing the appropriate people inside it, and granting the groups access to the appropriate Analytics accounts. You can even place a group inside a group if you need to manage a hierarchy of teams. To get started, you’ll need to create an organization. Check out this help center article for more information.
Detail for an example “IT Team” user group


Combined with existing features like the ability to centrally audit and set policies for users, these new features bring enterprise grade controls to your organization. They also pave the way for future enhancements, such as bringing centralized user management and user groups to more products.

Better A/B Testing with Firebase

Earlier this year, the Google Optimize and Firebase teams worked together to bring A/B testing functionality to Firebase. Last week, at the Firebase Dev Summit, we announced that A/B testing is now available in beta to all app developers.

This post originally appeared on The Firebase Blog.


Announcing Better A/B Testing with Firebase 


If you're like most app developers, you know that small changes can often make a big difference in the long term success of your app. Whether it's the wording that goes into your "Purchase" button, the order in which dialogs appear in your sign-up flow, or how difficult you've made a particular level of a game, that attention to detail can often make the difference between an app that hits the top charts, or one that languishes. 


But how do you know you've made the right changes? You can certainly make some educated guesses, ask friends, or run focus groups. But often, the best way to find out how your users will react to changes within your app is to simply try out those changes and see for yourself. And that's the idea behind A/B testing; it lets you release two (or more!) versions of your app simultaneously among randomly selected users to find out which version truly is more successful at getting the results you want. 


And while Firebase Remote Config did allow you to perform some simple A/B testing through it's "random percentile" condition, we've gone ahead and added an entirely new experiment layer in Firebase that works with Remote Config and notifications to make it quick and easy to set up and measure sophisticated A/B tests. Let's take a quick tour of how it works!


Getting to Know the New A/B Testing Feature 


With the new A/B testing feature, you can create an A/B test that will allow you to play with any combination of values that you can control through Remote Config. Setting up an A/B test allows you to define how the experiment will behave in a number of different ways, including determining how many of your users are involved with the experiment at first…


…how many variants you want to run, and how your app might behave differently for each variant…


...and what the goal of the experiment is.


Different experiments might have different desired goals, and A/B testing supports a number of common outcomes, like increasing overall revenue or retention in your app, reducing the number of crashes, or increasing the occurrence of any event you're measuring in Google Analytics for Firebase, such as finishing your in-app tutorial.

Once you've defined your A/B test, Firebase takes over by delivering these different variations of your app to randomly-selected members of your audience. Firebase will then measure your users' behavior over time, and let you know when an experiment appears to be performing better, based on those goals you've defined earlier. Firebase A/B testing measures these results for you with the same Bayesian statistical models that power Google Optimize, Google's free testing and personalization product for websites.

Using A/B Tests for Better Onboarding: A Case Study 


Fabulous, a motivational app for building better habits, recently made improvements to their app's onboarding by using Firebase A/B testing. When the user first starts an app, Fabulous shows them how to complete a habit, presents them with a letter about forming better habits, and then asks them to commit to a simple routine. The team suspected that if they removed a few steps from this onboarding process, more people might complete it.


Some of the screens a typical user encounters when first using Fabulous.
 
So they ran an A/B test where some users didn't see the letter, others didn't see the request to commit to a simple routine, and others skipped both of those steps. The Fabulous team found that by removing both of these steps from the onboarding process, there was a 7% improvement in the rate of users completing the onboarding flow. More importantly, they confirmed that this shorter onboarding experience didn't have any impact on their app's retention.

Test Your Notifications, Too! 


You also have the ability to A/B test your app notification messages through the Firebase Notifications console. You can try out different versions of your notification message and see which ones lead to more users opening up your app from that notification, or which messages lead to users performing some intended goal within your app, like making a purchase.

Getting Started 


A/B testing is available in beta to all Firebase developers starting today. If you're excited to get started, you should make sure that your app is wired up to use Remote Config and/or Firebase Cloud Messaging, and that you've updated these libraries to the latest and greatest versions. You can always find out more about A/B testing in our documentation, or check out the A/B Test Like a Pro video series we've been building.

Then, head on over to the Firebase Console and start making your app better — one experiment at a time!


Google Analytics 360 + Salesforce: A Powerful Combination

We often hear from marketers how challenging it is to piece together online and offline customer interactions in order to see a complete view of a customer’s journey. That’s why we’re excited to share that Google and Salesforce are working together to seamlessly connect sales, marketing and advertising data for the first time, giving you the full view of what’s working and what isn’t as customers engage with your ads, websites, apps, emails, call centers, field sales teams and more.

Today at Dreamforce, Google and Salesforce are announcing a strategic partnership to deliver four new, turnkey integrations between Google Analytics 360, Salesforce Sales Cloud and Salesforce Marketing Cloud:
  • Sales data from Sales Cloud will be available in Analytics 360 for use in attribution, bid optimization and audience creation
  • Data from Analytics 360 will be visible in the Marketing Cloud reporting UI for a more complete understanding of campaign performance
  • Audiences created in Analytics 360 will be available in Marketing Cloud for activation via direct marketing channels, including email and SMS
  • Customer interactions from Marketing Cloud will be available in Analytics 360 for use in creating audience lists


These new connections between our market-leading digital analytics solution and Salesforce’s market-leading customer relationship management (CRM) platform will change the game for how our clients understand and reach their customers — and how they measure the impact of their marketing. These integrations are fully consistent with our privacy policies and have settings that offer privacy controls and choice on how data is used.

By integrating your customer data, you can see a customer’s path from awareness all the way through to conversion and retention. And with connections to Google’s ad platforms and Salesforce’s marketing platform, you can quickly take action, engaging them at the right moment. You'll see these new integrations begin to arrive in the first half of 2018.
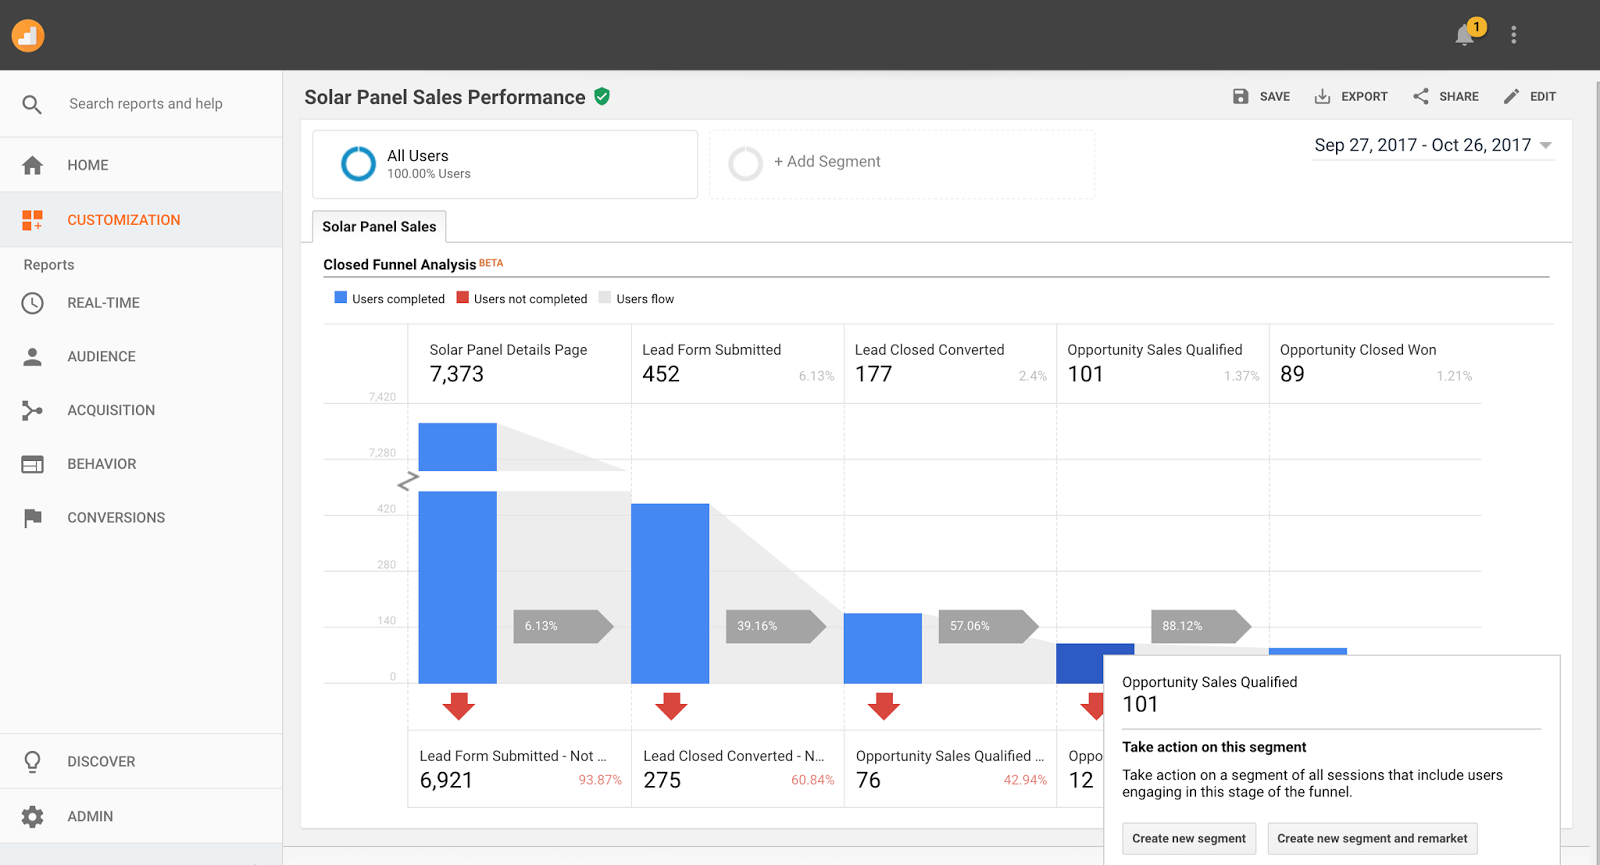
Example of a complete customer journey funnel in Google Analytics 360 joining website data (pageviews, leads submitted) with pipeline data from Sales Cloud (lead and opportunity stages); example also shows a prompt to create a new audience segment to take action


New insights

Until now, businesses have not been able to connect offline interactions, such as an estimate provided by a call center rep or an order closed by a field sales rep, with insights on how customers use digital channels. With the connection between Sales Cloud and Analytics 360, soon you’ll be able to include offline conversions in your attribution modeling when using Google Attribution 360, so you’ll have a more complete view of ROI for each of your marketing channels and even more reason to move away from a last-click attribution method. This integration will also let you see how your most valuable customers engage with your digital properties, answering some important questions like, what are they looking for and are they actually finding what they need?

With the integration allowing data from Analytics 360 to be visible in Marketing Cloud, you’ll gain a more complete understanding of how your marketing campaigns perform. For example, if you send an email campaign to frequent shoppers to promote your fall fashion line, you’ll be able to see right in Marketing Cloud information such as how many pages people visited when they came to your site, the number of times people clicked on product details to learn more, and how many people added items to their shopping cart and converted.

Easy to take action

Today, Google Analytics allows you to create audience lists and goals that you can easily send to AdWords and DoubleClick for digital remarketing and to optimize bids. With the new connection from Sales Cloud to Analytics 360, in addition to unlocking new insights and more data for attribution modeling, you’ll be able to combine Salesforce data (such as sales milestones or conversions) with behavioral data from your digital properties to create richer audiences and for smarter bidding.

For example, if you’re a residential solar panel company and want to find new customers, you can create an audience in Analytics 360 of qualified leads from Sales Cloud and use AdWords or DoubleClick Bid Manager to reach people with similar characteristics. Or, create a goal in Analytics 360 based on leads marked as closed in Sales Cloud, and automatically send that goal to AdWords or DoubleClick Search to optimize your bidding and drive more conversions.

With the Analytics 360 connection to Marketing Cloud, you’ll be able to use customer insights to take action in marketing channels beyond Google’s ad platforms, such as email, SMS or push notification. For example, you can create an audience in Analytics 360 of customers who bought a TV on your site and came back later to browse for home theater accessories, and use that list in Salesforce to promote new speakers with a timely and relevant email.

Powerful combination

Every day, Google Analytics processes hundreds of billions of customer moments, Salesforce Marketing Cloud sends 1.4 billion emails, and there are over 5 million leads and opportunities created in Salesforce Sales Cloud. These new integrations represent a powerful combination, and we believe they will help marketers take a big step closer to the ultimate dream: providing every customer with a highly relevant experience at each step of their journey.

You’ll see these new joint capabilities become available beginning in 2018, and we'll be sure to keep you updated along the way. Contact us here if you would like to learn more about Analytics 360. We hope you’re as excited as we are!


The Google Analytics 360 + Salesforce integrations are just one part of a broader strategic alliance announced today between Google and Salesforce. Read about new integrations between G Suite and Salesforce and a new partnership between Google Cloud and Salesforce here.

Open Source Community Connectors for Data Studio

More than six hundred developers have signed up for developer access to Data Studio Community Connectors since the Developer Launch. Community Connectors give developers an opportunity to come up with innovative solutions for data access and broaden the scope of data sources users can connect to.

Based on community feedback, we recognized that many of you are looking to share your work on connectors with the community. Also, developers are looking for more examples to follow. With these community needs in mind, today, we are announcing the Open Source Community Connectors repository on GitHub.


Use open source Community Connectors


For every connector that is hosted in the open source repository, the Data Studio Developer Relations team will manage a deployment for the connector’s latest code. This managed deployment will enable all users to immediately try the connector in Data Studio by simply clicking a link. Managed deployments also make it easier for developers since you do not have to deploy and maintain the connectors yourself; we’ll take care of this for you.

You can try out the following Open Source connectors directly in Data Studio:


Example dashboards using these connectors:


Learn about best practices


If you want to connect to new Data Sources using Data Studio but have not yet looked into Community Connectors, now would be the best time to start since a variety of example connector code have become available. These examples will give you a head start and create a platform for you to learn and share with other community members.

Initially, we are releasing these connectors in our open source repository:


Contribute to the community


If want to submit your own open source connector to the repository, you can send us a pull request. Alternatively you can maintain your own repository and link to that from the official repository.

This Git repository is a small start where we plan to make new additions. We have already seen other open source Community Connectors like data.world and getSTAT. We are hoping that initiative will help developers and users to create connectors to new Data Sources and thus make more data accessible in Data Studio. Developers can also collaborate with each other as well as report new issues and fix existing ones through these open source connectors.

This collaboration platform gives developers the option to leverage support from the community. If you want to develop your own connector but are unable to maintain it in the long run, you can add it to our repository so that the community can support it.

Visit the repository and start building your own Community Connector today!


Posted by Minhaz Kazi, Google Analytics team

Google Optimize now offers more precision and control for marketers

Savvy businesses review every step of the customer journey to ensure they are delivering the best experience and to find ways to offer more value. Today, we’re releasing two new features that will make it easier for you to improve each of those steps with the help of Google Optimize and Optimize 360.

AdWords integration: Find the best landing page 


Marketers spend a lot of time optimizing their Search Ads to find the right message that brings the most customers to their site. But that's just half the equation: Sales also depend on what happens once people reach the site.

The Optimize and AdWords integration we announced in May gives marketers an easy way to change and test the landing pages related to their AdWords ads. This integration is now available in beta for anyone to try. If you’re already an Optimize user, just enable Google Optimize account linking in your AdWords account. (See the instructions in step 2 of our Help Center article.) Then you can create your first landing page test in minutes.

Suppose you want to improve your flower shop's sales for the keyword “holiday bouquets.” You might use the Optimize visual editor to create two different options for the hero spot on your landing page: a photo of a holiday dinner table centerpiece versus a banner reading "Save 20% on holiday bouquets." And then you can use Optimize to target your experiment to only show to users who visit your site after searching for “holiday bouquets.”

If the version with the photo performs better, you can test it with other AdWords keywords and campaigns, or try an alternate photo of guests arriving with a bouquet of flowers.

Objectives: More flexibility and control 


Since we released Optimize and Optimize 360, users have been asking us for a way to set more Google Analytics metrics as experiment objectives. Previously,
Optimize users could only select the default experiment objectives built into Optimize (like page views, session duration, or bounces), or select a goal they had already created in Analytics.

With today's launch, Optimize users no longer need to pre-create a goal in Analytics, they can create the experiment objective right in Optimize:


Build the right objective for your experiment directly in the Optimize UI.

When users build their own objective directly in Optimize, we’ll automatically help them check to see if what they’ve set up is correct.

Plus, users can also set their Optimize experiment to track against things like Event Category or Page URL.

Learn more about Optimize experiment objectives here.

Why do these things matter? 


It's always good to put more options and control into the hands of our users. A recent study showed that marketing leaders – those who significantly exceeded their top business goal in 2016 – are 1.5X as likely to say that their organizations currently have a clear understanding of their customers' journeys across channels and devices.1 Testing and experimenting is one way to better understand and improve customer journeys, and that's what Optimize can help you do best.

>>> Check out these new features in Optimize now<<<


1Econsultancy and Google, "The Customer Experience is Written in Data", May 2017, U.S.

Data Studio: Richer Visualizations and Analytical Functions

The Data Studio team has been hard at work launching new features to allow for richer visualization and new views on data. Today, we'll highlight some of these recent launches.

Pivot Tables

Pivot tables let users narrow down a large data set or analyze relationships between data points. Additionally, they reorganize user's dimensions and metrics to help quickly summarize data and see relationships that might otherwise be hard to spot.

Example Pivot Table (Help center doc here)

Coordinated Coloring

Coordinated coloring allows users to bind colors to specific data. When a user creates visualizations, Data Studio automatically binds colors to data, so that color:data pairs stay consistent between visualizations and when filtering. This feature is automatically turned on for all new reports, and available in old reports.

Example Coordinated Coloring (Help center doc here)

Google Analytics Sampling Indicator

Google Analytics samples data in order to provide accurate reporting in a timely manner. Data Studio now shows a sampling indicator in Data Studio reports when a component contains sampled Analytics data.

GA Sampling indicator (Help center doc here)

Field Reports Editing

Data Studio has also recently added new options to the chips in reporting. These new options allow you to:
  • Rename fields
  • Change aggregation types
  • Change semantic types
  • Change date functions
  • Apply % of total, difference from total, or percent difference from total to a metric from within the report.
Example of new field editing options (Help center doc here).

Submitting and voting for new features

The Data Studio team will continue to introduce new features and product enhancements based on your submissions. You can view requests submitted by other users, upvote your favorites, or create new ones. Learn more here.

Smarter attribution for everyone

In May, we announced Google Attribution, a new free product to help marketers measure the impact of their marketing across devices and across channels. Advertisers participating in our early tests are seeing great results. Starting today, we’re expanding the Attribution beta to hundreds of advertisers.

We built Google Attribution to bring smarter performance measurement to all advertisers, and to solve the common problems with other attribution solutions.

Google Attribution is:
  • Easy to setup and use: While some attribution solutions can take months to set up, Google Attribution can access the marketing data you need from tools like AdWords and Google Analytics with just a few clicks.
  • Cross-device: Today’s marketers need measurement tools that don't lose track of the customer journey when people switch between devices. Google Attribution uses Google’s device graph to measure the cross-device customer journey and deliver insights into cross-device behavior, all while protecting individual user privacy.
  • Cross-channel: With your marketing spread out across so many channels (like search, display, and email), it can be difficult to determine how each channel is working and which ones are truly driving sales. Google Attribution brings together data across channels so you can get a more comprehensive view of your performance.
  • Easy to take action: Attribution insights are only valuable if you can use them to improve your marketing. Integrations with tools like AdWords make it easy to update your bids or move budget between channels based on the new, more accurate performance data.


Results from Google Attribution beta customers


Last April, we shared that for AdWords advertisers, data-driven attribution typically delivers more conversions at a similar cost-per-conversion than last-click attribution. This shows that data-driven attribution is a better way to measure and optimize the performance of search and shopping ads.

Today we’re pleased to share that early results from Google Attribution beta customers show that data-driven attribution helps marketers improve their performance across channels.

Hello Fresh, a meal delivery service, grew conversions by 10% after adopting Google Attribution. By using data-driven attribution to measure across channels like search, display, and email, Google Attribution gives Hello Fresh a more accurate measurement of the number of conversions each channel is driving. And because Google Attribution is integrated with AdWords, Hello Fresh can easily use this more accurate conversion data to optimize their bidding.

"With Google Attribution, we have been able to automatically integrate cross-channel bidding throughout our AdWords search campaigns. This has resulted in a seamless change in optimization mindset as we are now able to see keyword and query performance more holistically rather than inadvertently focusing on only last-click events.
- Karl Villanueva Head of Paid Search & Display, HelloFresh

Pixers, an online marketplace, is also seeing positive results including increased conversions. Google Attribution allows Pixers to more confidently evaluate the performance of their AdWords campaigns and adopt new features that improve performance.

"By using Google Attribution data we have finally eliminated guesswork from evaluating the performance of campaigns we're running, including shopping and re-marketing. The integration with AdWords also enabled us to gradually roll-out smart bidding strategies across increasing number of campaigns. The results have significantly exceeded expectations as we managed to cut the CPA while obtaining larger conversion volumes."
- Arkadiusz Kuna, SEM & Remarketing Manager at Pixers

Google Attribution can also help brands get a better understanding of their customer’s path to purchase. eDreams ODIGEO, an online travel company, knows that people don’t usually book flights or hotels after a single interaction with their brand. It often requires multiple interactions with each touchpoint having a different impact.

“Some channels open the customer journey and bring new customers, whereas other channels are finishers and contribute to close the sales. Google Attribution is helping us to understand the added value of each interaction. It enhances of our ability to have a holistic view of how different marketing activities contribute to success.”
- Manuel Bruscas, Director of Marketing Analytics & Insights, eDreams ODIGEO


Next steps


In the coming months we’ll invite more advertisers to use Google Attribution. If you’re interested in receiving a notification when the product is available for you, please sign up here.

Don’t forget, even before adopting Google Attribution, you can get started with smarter measurement for your AdWords campaigns. With attribution in AdWords you can move from last-click to a better attribution model, like data-driven attribution, that allows you to more accurately measure and optimize search and shopping ads.

Better tools for teams of all sizes

We’ve heard feedback from businesses of all sizes that they need simpler ways to manage the analytics products they use and the team members who use them. That’s why we’re making new controls available to everyone who uses Analytics, Tag Manager, and Optimize and improving navigation for users of Surveys and Data Studio. These new features will help you more easily manage your accounts, get an overview of your business, and move between products.

Streamlined account management


With centralized account management, you can control user access and permissions across multiple products, like Analytics, Tag Manager, and Optimize.

The first step is to create an organization to represent your business. You then link this organization to all of the different accounts that belong to your business. You can also move accounts between the organizations you create.

Now you have a central location where administrators for your organization can:
  • Create rules for which types of new users should be allowed access to your organization
  • Audit existing users and decide which products and features they should have access to
  • Remove users who have left your organization or no longer need access to the tools
  • See the last time a user in your organization accessed Google Analytics data
  • Allow users to discover who are your organization’s admins and contact them for help


New home page


Setting up an organization also gives you access to a new home page that provides an overview of your business. You’ll be able to manage accounts and settings across products and get insights and quick access to the products and features you use most. For example, you might see a large increase in visitors for a specific Analytics property, and then click through to Analytics to investigate where the visitors are coming from.


Simplified navigation


Finally, you’ll get a unified user experience across products. Common navigation and product headers make it easy to switch between products and access the data you need. You can view accounts by organization, or see everything you have access to in one place. We’ve also redesigned search, making it possible to search across all of your accounts in a single place.


Get started


If your business would benefit from these features, please visit this page to get started. You can also check out the help center for more info.

These updates will be rolling out over the next few weeks, so please stay tuned if you don’t yet have access.

Note: If you’re using the enterprise versions of our products, like Analytics 360, you already have access to these features as part of the Google Analytics 360 Suite.