Tag Archives: Google Analytics

Start Remarketing with Google Analytics Instant Activation

For many advertisers, remarketing is an essential tactic. But remarketing can be a difficult journey, even for the savviest digital marketer. We repeatedly see marketers struggle with tagging hurdles and complex implementation challenges, with the result that only 1 in 5 remarketers successfully completes their setup.

To help make it easier for advertisers to reach their most qualified customers, we’ve enabled remarketing with a single toggle. Instead of manually updating all of your site tags, simply use Instant Activation and get started with remarketing in four easy steps.

Identifying quality visitors and maximizing conversions

GlobalTechLED.com is a producer of LED lighting. Thanks to Instant Activation, John Burns, Director of Marketing, was able to start remarketing quickly. Without waiting for IT to re-tag his site, John successfully launched Global Tech LED’s first remarketing campaign and saw fast results by reaching their highest potential customers.

After enabling remarketing, Global Tech LED leveraged Google’s powerful machine-learning technology in two ways for their online campaigns: Smart Lists for remarketing automatically created lists of visitors who were most likely to engage in a subsequent session on GlobalTechLED.com. Then, Conversion Optimizer instantly adjusted the campaigns’ bids get more conversions at a lower cost, eventually freeing up more time and resources for the company.

As a result, GlobalTechLED.com is currently reaching their performance and outreach goals. To date they’ve doubled their display campaigns’ CTRs and have almost five times more clicks on their remarketing campaign compared to their other campaigns. Website traffic increased by over 100% in the first 30 days of the campaign, and international traffic skyrocketed. They’ve also seen a 75% decrease in CPA for their campaigns.

These kind of results were exactly what the company was looking for. According to John, "We’ve been trying to hit these specific numbers in the account for a couple of months, and Google Analytics Remarketing helped us achieve these in only a couple of days." Read the full case study here.

Four easy steps to get started

Ready to get started with remarketing? You can, with just four steps.

1. In your Google Analytics Property’s settings, choose ‘Audiences’ under the ‘Remarketing’ section.


2. Choose the AdWords account where you’d like to share your Audience and click ‘Next Step’.


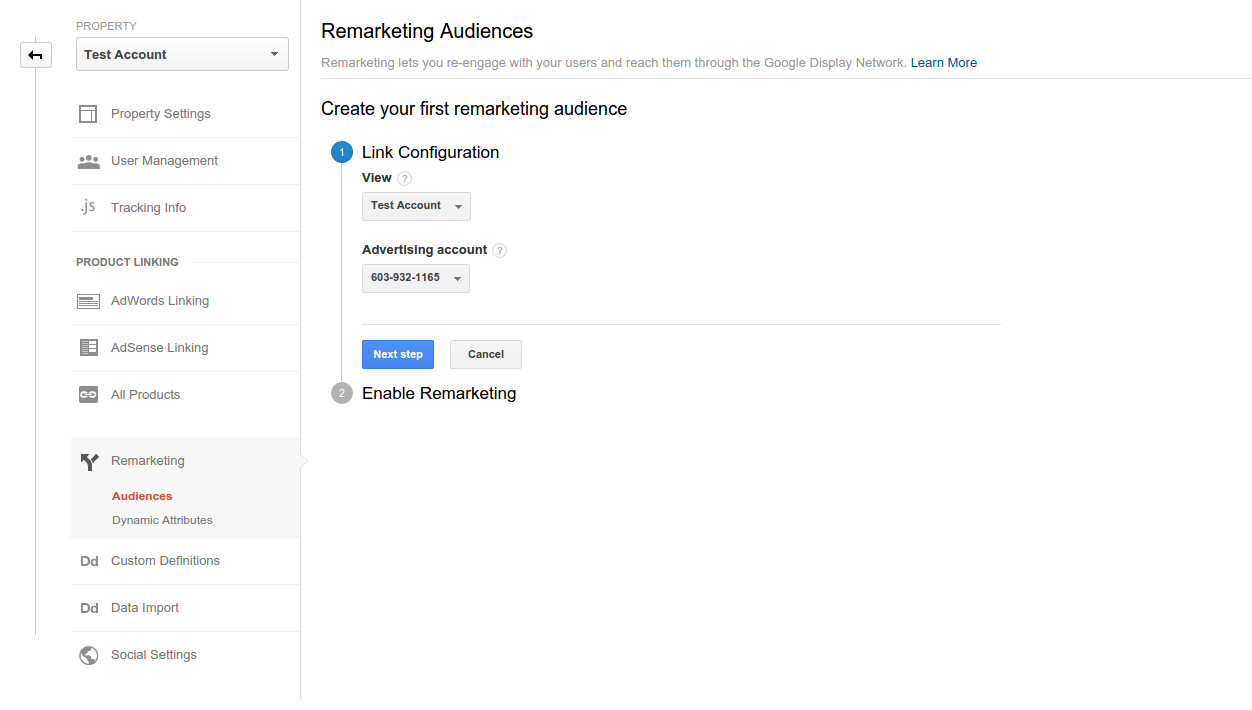
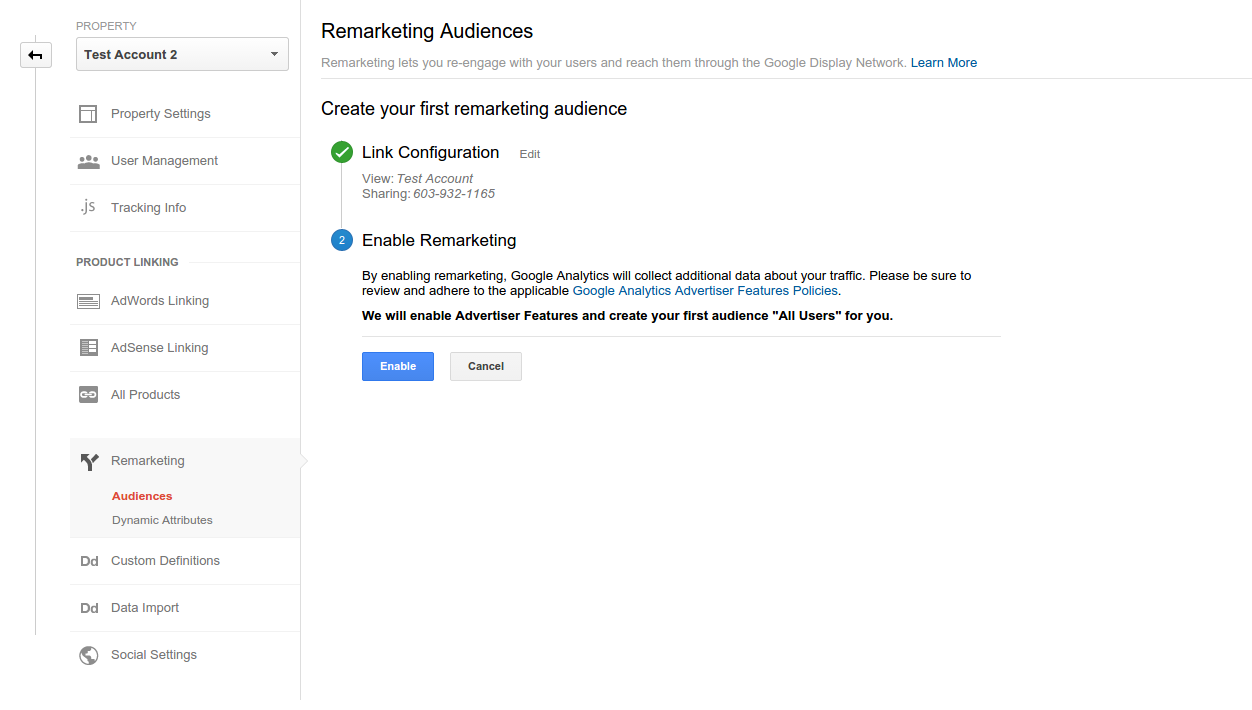
3. Click “Enable” to create your first audience of All Users.  You can also come back later and create more complex audiences, like ‘visitors who have spent more than six minutes on site’, ‘visitors who visited more than five pages’, or ‘abandoned cart’.

This step automatically activates Advertiser Features if you haven’t done so already, which also enables Audience Demographics and Interests Reporting. You can manage this setting at any time in the Admin tab, under the ‘Advertiser Features’ section in your Property Settings.


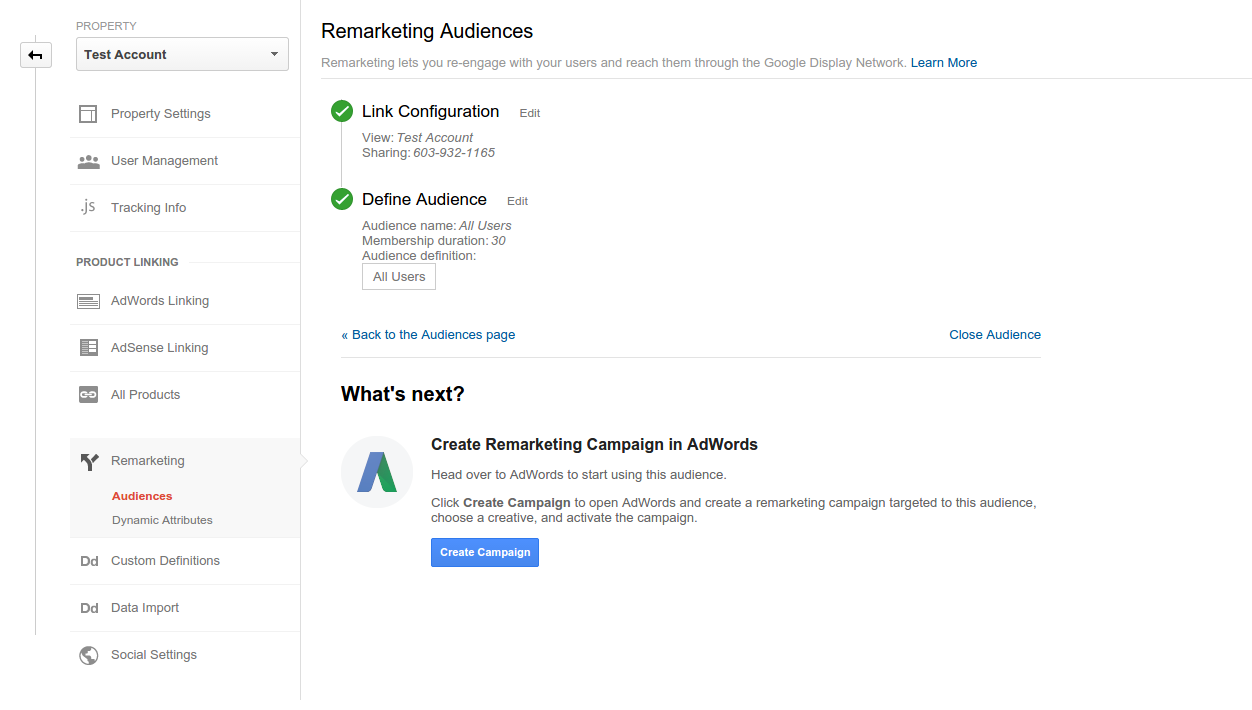
4. Click ‘Create Campaign’ and complete the remarketing campaign creation process in AdWords. Congratulations, you are now a Remarketer!


We’re really excited to make Advertiser Features in Google Analytics simpler and enable all Google Analytics users to be more successful across all their marketing channels. Stay tuned for future improvements!

Happy Analyzing!

Posted by Avi Mehta and Rosanne Borja, Google Analytics Team

Introducing Trash Can: Data Recovery in Google Analytics

We all make mistakes, but the damage might seem irrevocable when accidentally deleting crucial reporting information from Google Analytics. Thanks to feedback from our users, we’re pleased to introduce a new feature to provide a safety net each time you delete a view, property or account from your Google Analytics account: the Trash Can.

To get started, navigate to the Administration tab, select an account, and click the Trash Can feature on the left-hand panel. Check off what you want to reclaim, click “Restore,” and voilà! Your view, property or account is now just as it was before you deleted it. Once 35 days pass from the day you originally trashed it, however, you’ll have to say a final goodbye as the data will be removed from the Trash Can and will no longer appear there. 


This feature will be rolling out to all Google Analytics accounts in the coming weeks, but don’t worry–anything you’ve deleted starting today will still show up in the Trash Can once you get the feature update in your account. 

Many people rely on Google Analytics to collect, analyze, and report on data in order to make good business decisions. We hope that the Trash Can is just one more way to ensure that you have all the information you need when you need it. To learn more details about the Trash Can feature, please read this Help Center article.

Posted by Chris Cahill, Michael Masukawa, and Dan Morenus

Retailers: Three Insights to Drive Q1 Results

Now that we’ve survived the holiday season, it’s time to get the year started with some Q1 insights from Google Analytics!  Over the holiday season, retailers are inundated with data about the best shopping days, when to start their sales, and predictions about which items will be popular.  But what to do once the furor dies down?  How can retailers make the most of Q1?  

Here at Google Analytics, we delved into our Q1 data from 2013 and 2014 in the US to provide some insights to guide you in the first quarter of 2015.  In particular, the weeks around Valentine’s Day and the Super Bowl provided some notable trends.  Our analysis encompasses millions of businesses large and small who are using Google Analytics.  See the end of this article for more about our dataset.

The Day of the Big Game:  A Low Point for Online Shopping
We took a look at the first big marketing event of Q1:  Super Bowl Sunday.  The day of the big game, we saw lower numbers across the board.  Sessions were down 11% compared to the average for the quarter.  Similarly, transactions and conversion rates were down on average 16% and 5% respectively.  In both 2013 and 2014, the sessions and transaction numbers for the day of the Super Bowl fall into the bottom quartile for the quarter.

Clearly, on the day of the game, online purchasing is not a priority.  However, as we see later on in this post, this period of time serves as the turning point for transactions and conversion rates in the quarter.  The brand advertising that is such a big part of Super Bowl Sunday may help businesses capitalize on increased consumer buying behavior later in the quarter.

Best Romantic Shopping Day:  The Sunday before Valentine’s Day
We also delved into the second big marketing event of Q1:  Valentine’s Day.  In particular, we evaluated the week preceding the big day to find any pre-holiday patterns.  It turns out that in both 2013 and 2014, the Sunday before Valentine’s Day sees the biggest spike in week-over-week transactions with an average bump of 10%.  The same holds true for conversion rates and sessions, with an average increase of 6% and 4% respectively.  Besides a week-over-week increase, we also see that transactions are 5% higher on that day than for the average Sunday in the quarter.  The bump in transactions could indicate that consumers are using that Sunday to find and purchase their gifts, making it a good opportunity to invest in getting consumers to your site for some Valentine’s Day shopping.  If you plan to invest in advertising for this holiday, one way to prepare for Valentine’s Day is to adjust your bids.

Between the Super Bowl and Valentine’s Day:  The Q1 Turning Point
Unless you’re lucky enough to sell items for diet, exercise, or other big new year’s resolutions, retailers often see sales slow in Q1 as consumers reduce gift-buying.  The chart below shows that for most of January, transactions are indeed below the average for the quarter.  

When should retailers spend marketing dollars to bounce back from this holiday hangover?  We see that transactions in both 2013 and 2014 start to ramp up as the key marketing dates approach: Valentine’s Day and Super Bowl Sunday.  In particular, the week of February 5th (also known as the week after the Super Bowl and the week before Valentine’s Day) marks the first time that transactions hit the average or above for the quarter.  

The graph below shows that in 2013 the week after the Super Bowl was above the average, whereas in 2014 that week was at the quarterly average.  In both years, this week has the highest week over week growth in transactions and conversions rates for Q1 at 6% for both metrics.  Sessions, however, display only a 0.4% increase week-over-week, not even close to being the highest for the quarter.  Based on this information about sessions, it’s clear that the uptick in buying behavior is not simply a function of consumers spending more time online, it’s an indication of increased intent to purchase during the time they do spend online.  If we look at average conversion rates before that week compared to the average conversion rates for that week and the rest of the quarter, we see a 6% increase.


So, as you plan your budgets, promotions, and campaigns in Q1, keep in mind that consumer activity will tend to increase throughout the quarter.  In particular, transactions tend to get a big bump during the week between Super Bowl Sunday and Valentine’s Day.  We know it’s hard to get back in gear after the holidays, but we hope our insights will help you think clearly and creatively about your marketing plans in the first quarter.

About the Data & Charts 
In order to perform this analysis, we looked at billions of sessions from authorized Google Analytics clients who have shared their website data anonymously (read more).


AccuWeather Unlocks Cross-Channel Impact Using Google Analytics Premium

“The ability to overlay our own data on top of traditional dimensions and metrics has provided valuable insights into the kind of information our consumers are looking for.” 

-- Steve Mummey, Director of Browser Products at AccuWeather

AccuWeather is the world’s largest weather media company with over 1 billion people a day relying on AccuWeather’s suite of products to give them real-time weather information. Today we wanted to highlight AccuWeather’s success with the Measurement Protocol in Google Analytics Premium. The Measurement Protocol is a feature where businesses can send requests to Google Analytics from countless customer touchpoints. 

Measuring the complete customer journey
AccuWeather needed to find a way to increase the impact of digital across all its channels and products. They were determined to find a robust solution that collected data from each customer touchpoint to give a comprehensive analysis to make better business decisions.

The team wanted to sought out accomplish four goals: 1) analyze the effectiveness of weather forecast emails 2) attribute credit to campaigns that drove users to app store pages, 3) better understand their mobile audience, and 4) collect this new data without compromising AccuWeather’s fast and simple user experience.

Google Analytics Premium solves the challenge
Using Google Analytics Premium, plus the Measurement Protocol, allowed AccuWeather to report on a variety of the company’s services simultaneously from one source. AccuWeather was able to have information from emails, mobile devices, and QR codes sent through the Measurement Protocol. This feature provided the AccuWeather team with a complete picture in the Google Analytics reporting interface alongside their other metrics.

Data-driven decisions that drive action
As a result of the sophisticated and comprehensive set of Google Analytics Premium features, AccuWeather has been able to more accurately identify the source of app downloads to track application traffic from QR codes and other offline campaigns to the app stores.

The team’s analysis revealed that 10% of the brand’s mobile traffic came from devices that either did not support JavaScript or had the feature disabled. Without using the Measurement Protocol in Google Analytics Premium, they would never have been able to account for this portion of its audience. The team can now include this audience in its product and monetization decisions.

Pleased with the success of this solution, AccuWeather now plans to apply it to other parts of its business to uncover new insights, new leads, and, of course, new customers. 

You can read AccuWeather’s full story and dive deeper into the results here. To learn more on the Measurement Protocol, check out this video.

Posted by: the Google Analytics Premium team

How Google Analytics helps you make better decisions for your apps

Posted by Russell Ketchum, Lead Product Manager, Google Analytics for Mobile Apps

Knowing how your customers use your app is the foundation to keeping them happy and engaged. It’s important to track downloads and user ratings, but the key to building a successful business is using data to dive deeper into understanding the full acquisition funnel and what makes users stick around.

Google Analytics is the easiest way to understand more about what your users are doing inside your app on Google Play, while also simultaneously tracking your users across the web and other mobile platforms. To show how Google Analytics can help, we've created a new "Analyze" section on the Android Developers website for you to check out. We provide guidance on how to design a measurement plan and implement effective in-app analytics – and take advantage of features only available between Google Play and Google Analytics.

The Google Play Referral Flow in Analytics

Google Analytics for mobile apps provides a comprehensive view into your app’s full user lifecycle, including user acquisition, composition, in app behavior, and key conversions. Our Analytics Academy course on mobile app analytics is also a great resource to learn the fundamentals.

Eltsoft LLC, a foreign language learning and education app developer for Android, recognized early on how impactful Google Analytics would have on the company's ability to quickly improve on its apps and meet user needs.

Analytics has really helped us to track the effectiveness of the changes to our app. I would say six months ago, that our success was a mystery. The data said we were doing well, but the whys were not clear. Therefore, we couldn’t replicate or push forward. But today, we understand what’s happening and can project our future success. We have not only the data, but can control certain variables allowing us to understand that data. - Jason Byrne, Eltsoft LLC

Here are some powerful tips to make the most of Google Analytics:

  1. Understand the full acquisition funnel
  2. Uniquely integrated with the Google Play Developer Console, Google Analytics gives you a comprehensive view of the Google Play Referral Flow. By linking Analytics to the Developer Console, you can track useful data on how users move through the acquisition flow from your marketing efforts to the Google Play store listing to the action of launching the app. If you find that a significant number of users browse your app in Google Play, but don’t install it, for example, you can then focus your efforts on improving your store listing.
  3. Unlock powerful insights on in-app purchases
  4. Monitoring in-app purchases in the Google Play Developer Console will show you the total revenue your app is generating, but it does not give you the full picture about your paying users. By instrumenting your app with the Google Analytics ecommerce tracking, you’ll get a fuller understanding of what paying users do inside your app. For example, you can find out which acquisition channels deliver users who stay engaged and go on to become the highest value users.
  5. Identify roadblocks and common paths with the Behavior Flow
  6. Understanding how users move through your app is best done with in-app analytics. With Google Analytics, you can easily spot if a significant percentage of users leave your app during a specific section. For example, if you see significant drop off on a certain level of your game, you may want to make that level easier, so that more users complete the level and progress through the game. Similarly, if you find users who complete a tutorial stay engaged with your app, you might put the tutorial front and center for first-time users.
  7. Segment your audience to find valuable insights
  8. Aggregated data can help you answer questions about overall trends in your app. If you want to unlock deeper insights about what drives your users’ behavior, you can slice and dice your data using segmentation, such as demographics, behavior, or install date. If something changes in one of your key metrics, segmentation can help you get to the root of the issue -- for example, was a recent app update unpopular with users from one geographic area, or were users with a certain device or carrier affected by a bug?
  9. Use custom data to measure what matters for your business
  10. Simply activating the Google Analytics library gives you many out-of-the-box metrics without additional work, such as daily and monthly active users, session duration, breakdowns by country, and many more variables. However, it’s likely that your app has many user actions or data types that are unique to it, which are critical to building an engaged user base. Google Analytics provides events, custom dimensions, and custom metrics so you can craft a measurement strategy that fits your app and business.
  11. No more one-size-fits-all ad strategy
  12. If you’re a developer using AdMob to monetize your app, you can now see all of your Analytics data in the AdMob dashboard. Running a successful app business is all about reaching the right user with the right ad or product at the right time. If you create specific user segments in Google Analytics, you can target each segment with different ad products. For example, try targeting past purchasers with in-app purchase ads, while monetizing users who don’t purchase through targeted advertising.

By measuring your app performance on a granular level, you will be able to make better decisions for your business. Successful developers build their measurement plan at the same time as building their app in order to set goals and track progress against key success metrics, but it’s never too late to start.

Choose the implementation that works best for your app to get started with Google Analytics today and find out more about what you can do in the new “Analyze” section of developers.android.com.

Join the discussion on

+Android Developers

Simplify your Google Analytics Reporting with Add-ons for Google Sheets

It's common for Google Analytics users to use spreadsheets to analyze their Google Analytics data or combine it with another data source. But exporting your data from Google Analytics to Google Sheets is a manual process, and it can be tedious if you run reports frequently or manage multiple accounts. With the release of Add-ons for Google Sheets, getting your Google Analytics data into Google Sheets has never been easier!

Add-ons allow you to extend the power of Google Sheets by automating common tasks and integrating with external services. The Google Analytics Spreadsheet Add-on allows you to access your Google Analytics data, right from within a spreadsheet!


The Google Analytics Spreadsheet Add-on
The Google Analytics Spreadsheet Add-on combines the power of the Google Analytics API with the rich feature set of Google Sheets, making it easier for Google Analytics users to access, visualize, share, and manage their data. With this add-on you can:
  • Query and report data from multiple views.
  • Compute and display custom calculations.
  • Create visualizations and embed those visualizations on third-party websites.
  • Schedule your reports to run and update automatically.
  • Control who can see your data and visualizations by using Google Sheets' sharing and privacy features.
But perhaps the best way to find out what the Google Analytics Spreadsheet Add-on can do is to see it in action. In this short video I introduce the add-on, show you how to install it, and walk you through creating your first report.


If you want to go deeper, you can watch this more advanced video where I explain in detail the process of building a complete dashboard that automatically updates and can be embedded on a third-party website.


If you have more questions about how to use the add-on, check out the documentation. It explains each of its features and configuration options in much more detail.

Supermetrics and Analytics Canvas add-ons
The Google Analytics Spreadsheet Add-on gives users a powerful yet user-friendly way to access their Google Analytics data, but it doesn't solve all business integration needs.

For more advanced business and data-integration solutions, I strongly recommend trying out these two excellent Google Sheets add-ons created by our technology partners:
Both of these add-ons integrate with Google Analytics as well as a variety of other platforms and services such as Facebook, Twitter, Microsoft Office, and many more. Free and premium versions are available. 

Feedback and Support
Add-ons are a great way to automate the process of getting your Google Analytics data into Google Sheets. We hope you take the time to try out these add-ons and see how they can improve your workflow.

If you use the Google Analytics Spreadsheet Add-on, we'd love to know what you think. You can leave a review in the Chrome Web Store, ask any questions you have in the add-on discussion group, or submit feedback directly from within Google Sheets.

Any and all feedback is welcome!

By: Philip Walton, Developer Programs Engineer, Google Analytics

Boost Conversions by Infusing Google Remarketing with Marketo Real-Time Personalization

Personalization is a hot topic for today’s marketers, a group that spends nearly half of their budget attracting new prospects. But customer expectations have risen; content must be relevant to acquire new customers and move them to convert.

Some pioneering marketers are seeing better performance by using real-time personalization and remarketing simultaneously. Knowing who a customer is and what they do is a big step toward providing the hyper-relevant content that customers crave.

Join Marketo’s Mike Telem and Mike Tomita on January 15th at 10am PT/ 1pm ET as they discuss the importance of real-time personalization for marketing results. Google’s own Dan Stone will give an overview of the ways Google Analytics technology can be used to power advanced remarketing, while the Marketo team will share the ways their company uses real-time personalization and Google Analytics to generate more leads at a lower cost.

Looking for tips on how to get your organization started? Reserve your spot today!


Keeping the GA Web Experience Modern

We're continuing to bring you new features and technologies in the design of Google Analytics to provide the best a user experience. With this in mind, starting January 31, 2015 we will no longer support official compatibility of Google Analytics with Microsoft Internet Explorer 9 (IE9). While you can continue to use IE9 after we discontinue support, some features may not work properly going forward. This update maintains our practice of supporting the newest browsers while discontinuing support for the third-oldest version, as we previously announced in September 2013.

We will continue to support the latest versions of Chrome, Firefox, Internet Explorer 10 or higher, Safari and other modern browsers. Of course, you will still be able to measure visits from users of all browsers, including IE 9. We will send further reminders prior to the deprecation, but do advise you begin preparing and implementing plans for this change at your earliest convenience.

Refreshing “The Customer Journey to Online Purchase” – New Insights into Marketing Channels

Last year we introduced “The Customer Journey to Online Purchase” -- a tool that helped marketers visualize the roles played by marketing channels like paid search, email and display ads in their customers' journeys.

The goal was to help marketers learn more about the customer journeys for their industries. If social makes your customers aware, and email makes them convert -- or vice versa -- you can make sure you're in both places with the right kind of message.

Today we're happy to introduce a new improved version of the Customer Journey to Online Purchase, with a few key enhancements.  We’ve refreshed the data based on millions of consumer interactions, updated the industry classifications, and we’ve split out paid search so you can see the influence of brand and generic search terms on the purchase decision.

In each industry you can now see journeys for small, medium and large companies, which can often be quite different.
Click to enlarge image
For instance, the above image shows the journey for customers of small businesses in the shopping industry. Note that organic search is very often an "assist" interaction for these customers.
Click to enlarge image
Now here's the same journey for large shopping businesses. Note that display clicks and social are strongly assisting interactions -- while display didn’t even appear for the small businesses above. For both small and large businesses, a direct website visit is most likely to be the last interaction. Across industries, the differences from small to large businesses illustrate how different marketing strategies and customer profiles may lead to different buying behavior.

And there's more! Now you can drill down into each marketing channel for a closer look at the role it plays based on its position in the purchase path. Channels that occur more frequently in the beginning of the path are more likely to help generate awareness for your product, while the end of the path is closer to the customer’s purchase decision.
Click to enlarge image
In these charts, for example, we see the different roles that different channels play in the Shopping industry. One interesting insight is that all channels -- even those traditionally thought of as “upper funnel” or “lower funnel” -- occur throughout the purchase path, but a given channel may be more common at particular stages depending on its role (and depending on the industry).

Each marketing campaign and channel may have a different impact on customers depending on when they interact with it. Using what you learn from this tool, you can help adapt your marketing messaging to be more relevant and useful for your customers.

Try the Customer Journey to Online Purchase today. And for more helpful marketing insights, check out Measure What Matters Most: our new guide chock-full of suggestions on how to measure the impact of your marketing -- across channels -- to complement what you learn from the Customer Journey tool and take action to improve your marketing.

Happy analyzing!


For Brand Marketers: 5-Step Guide to Programmatic Buying

A lot has changed for marketers over the years. But one thing remains constant: the need to connect with and move an audience in the moments that matter. Brand marketers are beginning to truly embrace programmatic buying to do just that. The challenge is, many marketers don’t know where to start in order to successfully embrace programmatic for their brand campaigns.

To help address this challenge, we’re pleased to share our five-step guide: "Programmatic: A Brand Marketer’s Guide," to provide context and ideas for how marketers and their agencies can successfully embrace programmatic buying. It covers the essentials that brand marketers need to know in order to:

  1. Organize audience insights
  2. Design compelling creative
  3. Execute with integrated technology
  4. Reach audiences across screens
  5. Measure the impact

Our guide includes seven case studies with brands including Nike, KLM, Talk Talk, Kia, GOL, Burberry, and Kellogg so that brand marketers new to programmatic can learn from their peers.

We hope this guide can help you realize the ultimate promise of advertising in the digital age: to effectively run highly relevant, creative, and measurable campaigns, at scale. To make the most of programmatic buying, we invite you to explore the five steps to programmatic success.

You can stay on top of new updates by subscribing to our newsletter and following us on our Google+ page.

Posted by Kelly Cox, Product Marketing Manager