Tag Archives: Google Analytics

Android Developer Story: Jelly Button Games grows globally through data driven development

Posted by Leticia Lago, Google Play team

For Jelly Button Games, understanding users is the key to creating and maintaining a successful game, particularly when growth relies on moving into overseas markets. The team makes extensive use of Google Analytics and Google BigQuery to analyze more than 3 billion events each month. By using this data, Jelly Button can pinpoint exactly where, when, and why people play their highly-rated game, Pirate Kings. Feeding this information back into development has driven active daily users up 1500 percent in just five months.

We caught up with Mor Shani, Moti Novo, and Ron Rejwan — some of the co-founders — in Tel Aviv, Israel, to discover how they created an international hit and keep it growing.


Learn about Google Analytics and taking your game to an international audience:

  • Analyze — discover the power of data from the Google Play Developer Console and Google Analytics.
  • Query — find out how Google BigQuery can help you extract the essential information you need from millions or billions of data points.
  • Localize — guide the localization of your app with best practices and tools.

DAA San Francisco presents ‘Optimizing Your Analytics Career’

The Digital Analytics Association (DAA) San Francisco Chapter is hosting an evening of networking and conversation on the topic of ‘Optimizing Your Analytics Career’. 

We’d like to invite you to join us for an evening of networking and to hear from a great panel of seasoned experts and analytics newbies on their career paths, goals, and what the future holds. Come with your questions in mind and ask our experts everything you’ve wanted to know and discuss about excelling in the analytics industry.

Moderator: Krista Seiden, Analytics Advocate, Google

Panelists:
By attending you will:
  • Network with industry leaders and enjoy great casual conversations with your fellow analytics peers
  • Hear from our seasoned experts about their career paths, interests, educational opportunities, and skillsets needed in the analytics industry
Theme: Optimizing Your Analytics Career
When: Thursday April 23rd, 6:00pm - 8:00pm (career panel starting around 6:40pm)
Where: Roe Restaurant, 651 Howard St, San Francisco, CA 94105
Cost: The cost to attend the event is free for DAA members, $15 for non-members and $5 for students (students use this promo code: SFstudent). Students can join the DAA for $39 and also get admission to our annual symposium for free.

This will be an excellent opportunity to connect with your fellow analytics professionals and learn more about advancing in your profession. Join us!

Event website and registration: register here.

This event is organized by local DAA members and volunteers. We encourage you to become a member of the DAA and join our local efforts. Become a member and reach out to one of the local chapter leaders, Krista, Charles or Feras.

Posted by Krista Seiden, Analytics Advocate

Tackling Quantitative PR Measurement with AirPR & Google Analytics

The following is a guest post by Leta Soza. Leta is the PR Engineer at AirPR where she lives and breathes PR strategy, content marketing, community cultivation, and analytics. Her analytics adoration stems from the firmly rooted belief that you can’t manage what you can’t measure, so bring on the data. She works with everyone from Fortune 500 companies to innovative startups in order to assist them in proving the ROI of their PR efforts while optimizing their strategies. 

It’s no secret that PR has historically been difficult to measure… quantitatively that is.

PR pros have always had to rely on less than stellar metrics (AVEs, impressions calculations, etc.) to show ROI, and with seemingly no viable reporting alternatives, PR has basically been relegated to the budgetary back seat.

For years, the industry has struggled to prove its value, lagging behind in technological innovation. But as every aspect of business becomes driven by data, vanity metrics are becoming unacceptable and PR is being held accountable for demonstrating its impact on the bottom line.

At AirPR, we’ve made it our mission to provide analytics, insights, and measurement solutions for the rapidly evolving PR industry. Our Analyst product focuses on increasing overall PR performance while seeking to solve systemic industry challenges through the application of big data.

Analyst, our measurement and insights solution, was created to assist PR and communication professionals in understanding what’s moving the needle in terms of their business objectives. 

Interested in how many potential customers came to your website from that press hit? Curious which authors drove the most social amplification during a specific quarter? Want to more deeply understand message pull-through or even attribute revenue? Analyst simplifies getting these answers.

One of the key features of Analyst is our unique integration with Google Analytics. Our integration arms Analyst users with a comprehensive snapshot of the PR activities driving business objectives, as well as the insights to understand the media placements (earned or owned) that are achieving specific company aims, giving PR professionals a single dashboard dedicated to displaying the performance of their efforts. Completing the GA integration creates a comprehensive view of the most meaningful and actionable PR data in aggregate which then allows users to click into any piece of data for more context. 
AirPR Analyst Dashboard (click for full-sized image)

In PR attribution is key, so we leverage Google Analytics data in order to display PR-specific performance and demonstrate ROI. Our aim: To change the way the industry thinks about PR analytics, insights, and measurement and to provide the solutions that support this shift. 

To quote legendary management consultant Peter Drucker, “In this new era of ‘big data’ it is even more important to convert raw data to true information.” Our goal is to deliver actionable and meaningful information. When decision makers understand what’s working, they can increase effort on certain aspects, eliminate others, and make impactful budget allocation decisions for future PR campaigns, much like they do for advertising.

To learn more about AirPR Analyst, check us out in the Google Analytics app gallery.

Posted by Leta Soza, PR Engineer at AirPR 

Google Analytics Introduces Product Release Notes

Ever feel like you just can’t keep up with all the new features in Google Analytics? We hear you! To help you keep track of everything that’s going on, we’ve started publishing Release Notes in our product Help Center.

Release notes will be updated periodically and will have the most comprehensive list of new features or changes to the Google Analytics product. So, if you see something new in your account and have questions, we recommend starting here. We’ll point you to the relevant documentation to get you up to speed on everything you need to know.

We're happy to be adding another resources to keep our users informed. Check it out today!

Posted by Louis Gray, Analytics Advocate

Solutions Guide for Implementing Google Analytics via Google Tag Manager

Marketers, developers, and practitioners of analytics depend on having the right data at the right time - but implementing analytics code or AdWords pixels can be a less than fun (or easy) experience. Google Tag Manager makes tagging simple and fast by letting you add tags with a simple UI instead of code, while also offering advanced tracking features used by some of the web’s top sites.

Today we’re excited to announce the launch of the Solutions Guide section on the Google Analytics and Google Tag Manager Help Centers. The Solutions Guide area is focused on providing actionable, hands on, step-by-step instructions for implementing Google Analytics, AdWords, DoubleClick, and other third party tags via Google Tag Manager. 

In this guide, you’ll learn:
  • When and why to use Google Tag Manager
  • Best practices for naming conventions and setup tips
  • When to choose the Data Layer or the Tag Manager UI
  • How to implement GA event tracking, custom dimensions & cross-domain tracking
  • How to setup AdWords, Doubleclick, and Dynamic Remarketing tags in GTM
We’re thrilled to share this with you and hope you find it helpful as you implement Google Tag Manager.

Check out the new GTM Solutions Guide today!

Happy Tagging.

Posted by Krista Seiden, Analytics Advocate

Evolving Beyond The Conversion With Neil Hoyne

Measurement is constantly evolving, and while metrics by themselves each tell us something interesting, they do not necessarily tell the whole story or equally important, what to do next. In essence, our tools provide the what, but not always the why. As marketers and analysts, we need to put in the work and be able to take the next steps with our data: tell the whole story to our teams and stakeholders and be consultative in decision making and direction.

This is really important to get right, because use of data for companies is still new territory for many (frequently, decisions are still just based on how marketers feel). And while this may have been fine in a pre-digital age, the future of your company may very well depend on embracing analytics. With fragmentation of users and channels, there’s just too much for anyone to do. So it comes down to knowing what really works and why - these are the modern modern keys to success.

In this recent talk, Googler Neil Hoyne, Global Program Manager Customer Analytics shares how to embrace the above as well as take the next steps with your measurement.

A few key takeaways:
  • You need to evolve your measurement plan to better fit the state of the web & complex customer journey (see our recent measurement guide to help).
  • Question if you have the right goals or you need to adjust, and don’t be afraid to change goals if need be. Really make sure you have the right macro & micro conversions.
  • Build an attribution model (also see our guide) that works for your brand, considering the unique factors that make up your business and what messages make sense in each different context (for example, mobile, social, email, etc). 
  • Measure your customers in a user-centric way, move beyond the old session-based world.
Watch the whole talk embedded below:
And be sure and connect with Neil on Twitter and Google+

Posted by the Google Analytics Team

Build a loyal user base with three new Mobile App Analytics reports

Successful developers understand that in order to have a popular app, focusing on retaining a loyal user base is just as important as driving new installs. Today at the Game Developer Conference in San Francisco, we introduced new reports that will help you measure how to do this in two meaningful ways. We’re happy to announce that Mobile App Analytics will now let you understand how users come back to your app day after day, and provide the rich insights you need in order to measure their value over time. Let’s take a look at how these new reports can help make your app a hit.

Active Users
The active user report displays your 1-day, 7-day, 14-day and 30-day trailing active users next to each other in one, easy-to-view dashboard. The new overview gives immediate insights into how users interact with your app over time, along with dropoff rate comparisons. With this report, an app download is only the beginning of a potentially valuable relationship with your new users.

Benchmark active users at 1-7-14-30 days by selecting the segments you want. (Click to enlarge image)
While these metrics help you monitor your active user trends, when put into context they can answer important questions about your user acquisition strategies. For example, if you are investing in different campaigns, you can compare the cost of retaining users acquired via paid traffic versus organic to understand if you are attracting the right type of users. Not only can you measure your cost effectiveness, but you can also continue to monitor whether or not the users you paid for are still coming back after the campaign is over. This is particularly important when trying to keep your loyal user base engaged and happy with your app.

Lior Romano, Founder and CEO of Gentoo Labs (the makers of  Contacts+ for iOS and Android), was one of the first customers to try out this new report during our beta test period. He found the Active Users report especially useful when managing and organizing all their information at-a-glance: “We love the new Google Analytics Active Users feature -- it's a real time-saver! We get a quick overview of the 1/7/14/30-day active user trends side by side in a snap, which helps us to easily track our main metrics.”

Cohort Analysis
After learning how many users have opened your app, the next step in driving engagement is understanding when they come back. Cohort Analysis is a user analysis technique that allows you to analyze and compare your users by looking at their customer journey. Using Cohort Analysis, you can see when users are coming back to your app and their behavior over time after the day of the first session, and lets you further filter the information by day, week or month. We’ve also added the ability to compare different segments of users based on the day of the first install. 

In order to validate your user acquisition strategies, Cohort analysis lets you compare different periods or campaigns. For example, you can compare different weeks or months to measure the retention effectiveness of a single channel to see if you continue to attract valuable users throughout a campaign. The flexibility of the report also allows you to see how much time users are spending in an app as they come back day after day. With these valuable insights, Mobile App Analytics users can tailor their acquisition campaigns or app experience, just as our partner E-Nor did: “Cohort analysis in GA made it easy for E-Nor to gauge the effectiveness of lead nurturing efforts during an app free-trial promotion campaign. The analysis clearly showed that many users responded well to email and in-app reminders, resulting in over 50% retention between the 3rd and 5th day post sign-up as opposed to 30% in the first and 2nd day.

See at a glimpse when users are coming back to your app. (Click to enlarge image)

Lifetime Value
Analyzing retention is a great way to ensure users stick with your app and come back day after day. With Lifetime Value reporting, you’ll get a full picture of these users’ value over time. To get the most out of this report, it’s important to start with a clear definition of what a user’s value means to you based on your business objectives. Once you’ve defined the value, you can access the report to measure certain variables such as revenue per user and number of screen views per user over a period of 90 days. For example, if the goal of your app is to get users to purchase virtual or material goods, you’ll want to use this report to get a clear view of when they make a purchase and how much they are spending in your app over time.

Lifetime Value is a key metric to use to measure the effectiveness of your acquisition campaigns. If your cost to acquire a new user is higher than the average value over time, you might want to optimize your campaigns to meet the lifetime revenue they generate. Lifetime Value is particularly valuable if you offer in-app purchases, but it can be applied to discovering many other useful insights, such as number of times they open your app, total number of screens and goal completions.

Session duration per users compared to goal completion over a 60 day window. (Click to enlarge image)

How to get started
Cohort Analysis report can be found under the ‘Audience’ section in your Google Analytics account, and is now available in beta. Lifetime Value and Active Users reports are coming soon to all Analytics accounts.

To get started login into your Analytics account and look for the new reports under the Audience section. 


Posted by Russell Ketchum, Lead Product Manager, Google Analytics for Mobile Apps

Safe Browsing and Google Analytics: Keeping More Users Safe, Together

The following was originally posted on the Google Online Security Blog.

If you run a web site, you may already be familiar with Google Webmaster Tools and how it lets you know if Safe Browsing finds something problematic on your site. For example, we’ll notify you if your site is delivering malware, which is usually a sign that it’s been hacked. We’re extending our Safe Browsing protections to automatically display notifications to all Google Analytics users via familiar Google Analytics Notifications.


Google Safe Browsing has been protecting people across the Internet for over eight years and we're always looking for ways to extend that protection even further. Notifications like these help webmasters like you act quickly to respond to any issues. Fast response helps keep your site—and your visitors—safe.

Posted by: Stephan Somogyi, Product Manager, Security and Privacy

We’ll see you at GDC 2015!

Posted by Greg Hartrell, Senior Product Manager of Google Play Games

The Game Developers Conference (GDC) is less than one week away in San Francisco. This year we will host our annual Developer Day at West Hall and be on the Expo floor in booth #502. We’re excited to give you a glimpse into how we are helping mobile game developers build successful businesses and improve user experiences.

Our Developer Day will take place in Room 2006 of the West Hall of Moscone Center on Monday, March 2. We're keeping the content action-oriented with a few presentations and lightning talks, followed by a full afternoon of hands on hacking with Google engineers. Here’s a look at the schedule:

Opening Keynote || 10AM: We’ll kick off the day by sharing to make your games more successful with Google. You’ll hear about new platforms, new tools to make development easier, and ways to measure your mobile games and monetize them.

Running A Successful Games Business with Google || 10:30AM: Next we’ll hear from Bob Meese, the Global Head of Games Business Development from Google Play, who’ll offer some key pointers on how to make sure you're best taking advantage of unique tools on Google Play to grow your business effectively.

Lightning Talks || 11:15AM: Ready to absorb all the opportunities Google has to offer your game business? These quick, 5-minute talks will cover everything from FlatBuffers to Google Cast to data interpolation. To keep us on track, a gong may be involved.

Code Labs || 1:30PM: After lunch, we’ll turn the room into a classroom setting where you can participate in a number of self-guided code labs focused on leveraging Analytics, Google Play game services, Firebase and VR with Cardboard. These Code Labs are completely self-paced and will be available throughout the afternoon. If you want admission to the code labs earlier, sign up for Priority Access here!

Also, be sure to check out the Google booth on the Expo floor to get hands on experiences with Project Tango, Niantic Labs and Cardboard starting on Wednesday, March 4. Our teams from AdMob, AdWords, Analytics, Cloud Platform and Firebase will also be available to answer any of your product questions.

For more information on our presence at GDC, including a full list of our talks and speaker details, please visit g.co/dev/gdc2015. Please note that these events are part of the official Game Developer's Conference, so you will need a pass to attend. If you can't attend GDC in person, you can still check out our morning talks on our livestream at g.co/dev/gdc-livestream.

Best Practices: Combine AdWords with Google Analytics for Better Insights, Bidding and Results


Like sunshine and the beach, or dogs and tennis balls, Google AdWords and Google Analytics are great by themselves but even better together. You'll get high-performance insights into your ads and your website when you link your AdWords and Analytics accounts. Google Analytics does a vital job in this pairing: it shows you what happened after users clicked on your AdWords ads.

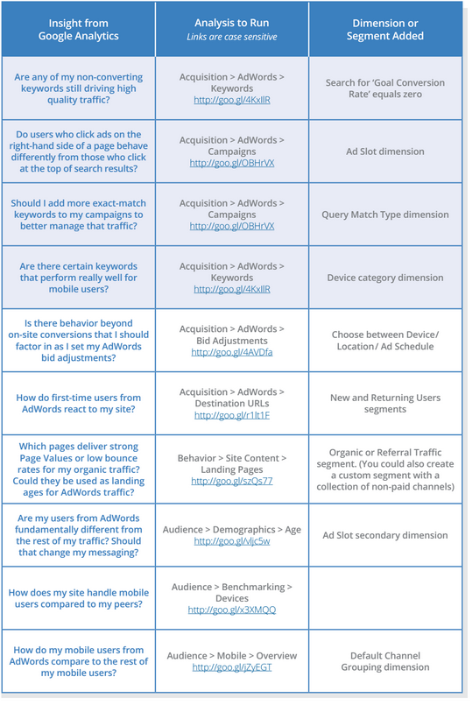
We’ve put together a new Best Practices guide, Better Together: AdWords and Google Analytics, to help you get deep insight into your performance. When you analyze performance with the combination of GA and AdWords you can find all sorts of actionable info:
  • Which parts of your account drive actual on-site engagement
  • Which keywords attract new users to your site
  • What messaging and landing pages connect with the different users on your site
  • How your business compares across your entire industry
To whet your appetite, here’s a rundown of ten useful GA reports included in the guide (with links that lead you directly to these reports in your own GA account).  Like what you see here?  Download the full version and the condensed one-page checklist to view our complete coverage of GA + AW goodness.


Love Analytics and AdWords being paired together?  Please take our survey about your past success and what else we can do to improve the experience.


Posted by Matt Lawson, Director, Performance Ads Marketing