An enterprise-class solution for a multi-screen world
Our lives are filled with micro-moments: intent-rich moments when we turn to the nearest device to find a store, buy a product or look for answers to all kinds of wants and needs. In these moments, today's consumers decide what to do, where to go, and what to buy.
If you're in marketing or analytics, you know this consumer behavior brings new opportunities to reach your customer in the right moment with the right message. At the same time, it's harder than ever to get a complete view of the consumer journey and then make sense of it all.
That’s why we’re introducing the Google Analytics 360 Suite, a set of integrated data and marketing analytics products, designed specifically for the needs of enterprise-class marketers. It all starts with understanding consumer behavior in the moment — getting the right insights, and then making your brand useful to consumers.
“The Google Analytics 360 Suite gave us the really big ah-ha moment. When we launched our mobile app, it provided insurance quotes. But after looking at the data, we saw people were attempting to buy insurance. So, we shifted our mobile strategy to offer ecommerce. Google gave us that insight,” said Pawan Divakarla, Analytics Leader at Progressive.
Modern measurement tools that are simple to use
Sophisticated marketers who use analytics platforms are three times more likely to outperform their peers in achieving revenue goals.1 It’s no wonder enterprise-class marketers have been telling us they need more from their marketing analytics tools. Many toolsets can't cope: They're too hard to use, lack sufficient collaboration capabilities, are poorly integrated, and require hard-to-find expertise.
Several years ago, Google engineers set out to simplify marketing analytics in the same way we simplified web search with Google.com. With infrastructure that allows us to handle billions and billions of daily search queries — generating answers before users even finish typing — we set out to give enterprise marketers the same utility.
As we built the system, enterprise marketers shared what they needed with us:
- See the complete customer journey. Marketers require full visibility and context to see what’s really happening across all customer touchpoints, devices, and channels.
- Useful insights, not just more data. Marketers need enormous computing power, data science and smart algorithms, all working together to quickly make sense of data for them. In other words, built-in intelligence to do the heavy lifting for marketers and make insights easy to see.
- Enable better sharing within your organization. Marketers seek to put insights into everyone’s hands and get the whole company on the same page — resulting in stronger cross-functional goals and smarter decision-making.
- Deliver engaging experiences to the right people. Marketers want to make their brand immediately useful to consumers. With integrations across multiple Google technologies, the suite products not only work well together, but also with other products, including AdWords, DoubleClick, and 3rd-party platforms — enabling marketers to take immediate action and drive business impact.
The Google Analytics 360 Suite is built to address these needs. Its powerful set products are unified, providing a consistent user experience and cross product data integrations, plus services. Simply put: it’s a complete measurement platform.

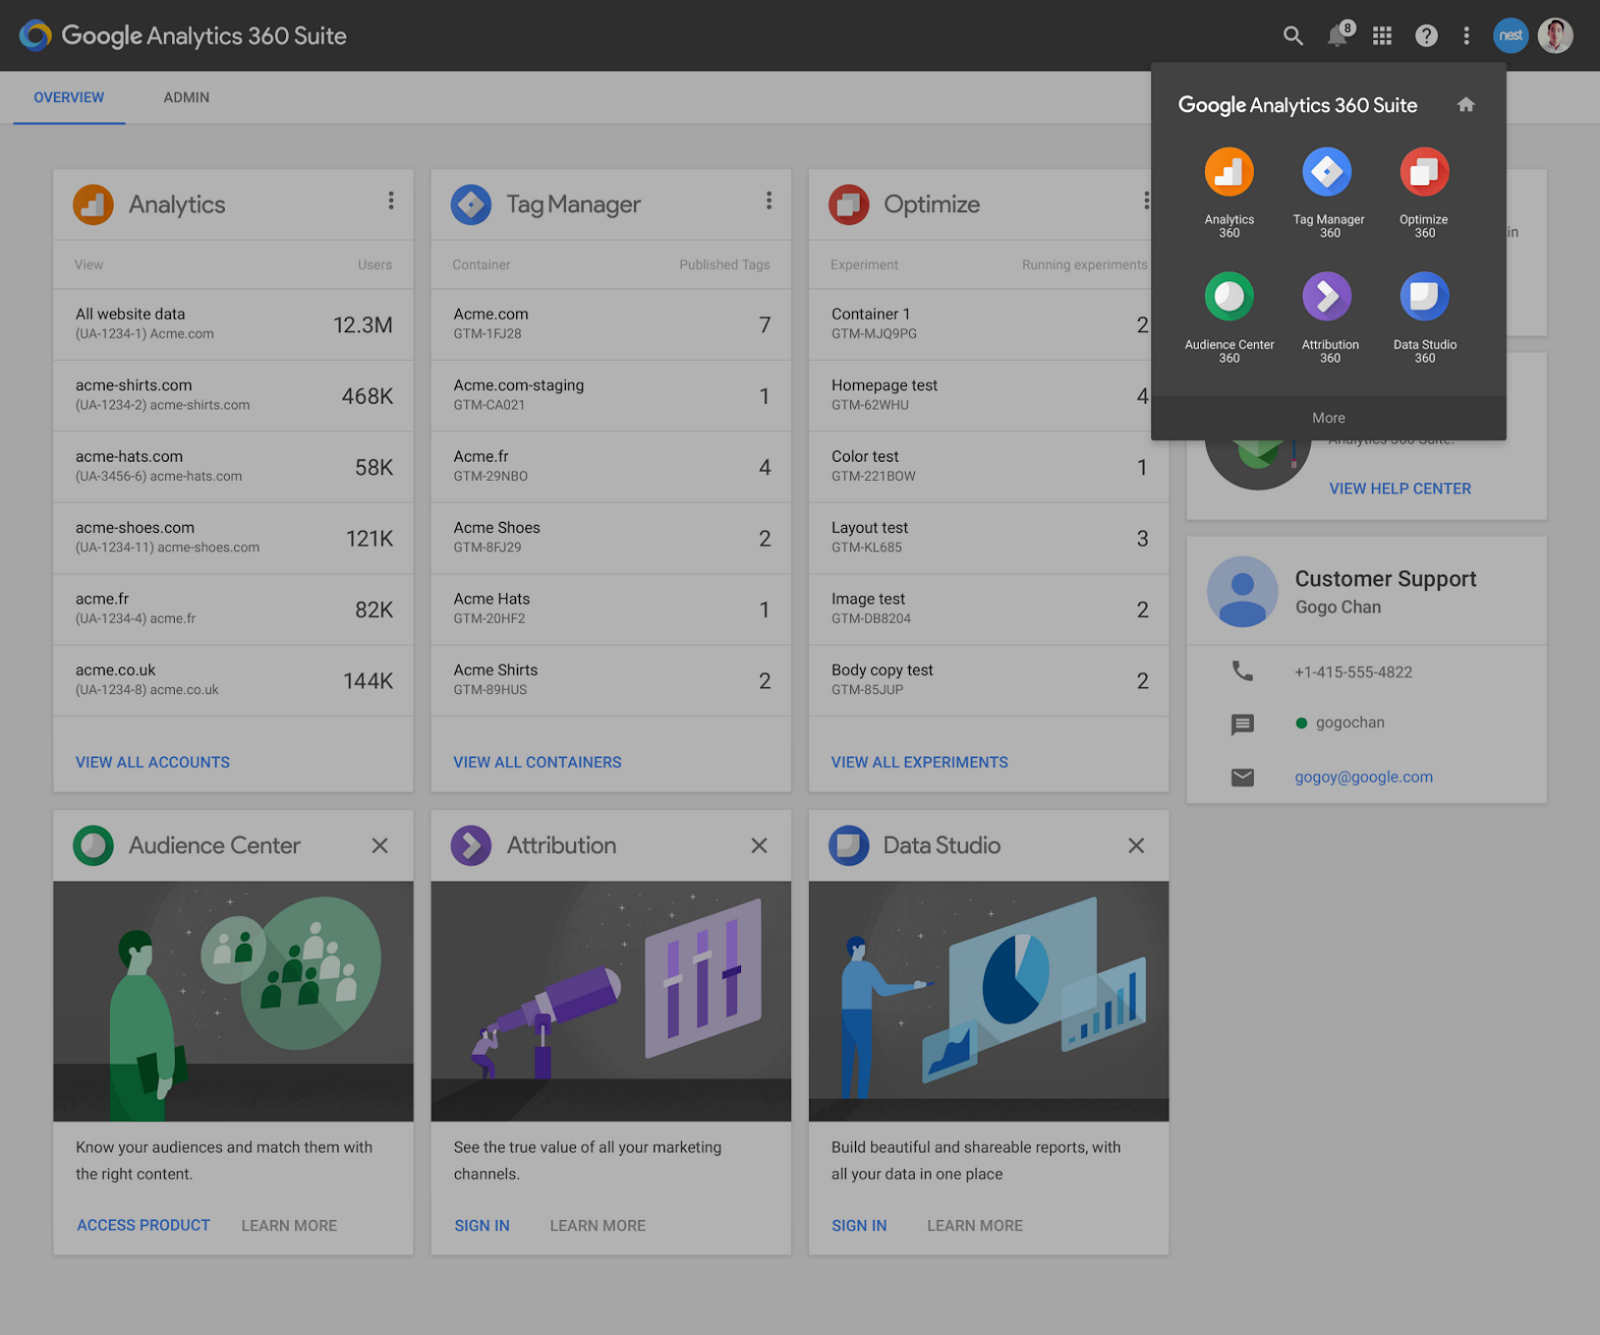
Loaded with six products, four of which are brand-new, the Google Analytics 360 Suite offers easy-to-use tools that enable sharing of data and insights throughout an organization.
- Google Audience Center 360 (beta). This powerful data management platform (DMP) helps marketers understand their customers and find more like them across channels, devices, and campaigns. It offers native integration with Google and DoubleClick, plus it's open to third party data providers, DSPs and more.
- Google Optimize 360 (beta). This website testing and personalization product helps marketers deliver better experiences. Marketers can show consumers multiple variations of their site and then choose the version that works best for each audience.
- Google Data Studio 360 (beta). A new data analysis and visualization product that integrates data across all suite products and other data sources ― turning it into beautiful, interactive reports and dashboards. Built-in real-time collaboration and sharing is based on Google Docs technology.
- Google Tag Manager 360. Built from our industry-leading tag management product, it empowers enterprise marketers to move faster and make decisions with confidence. It offers a simplified way to gather site information (all those tiny bits of code) and powerful APIs to increase data accuracy and streamline workflows.
- Google Analytics 360, formerly known as GA Premium, will roll out exciting new capabilities throughout the next couple of months as investments continue to grow. It will serve as the measurement centerpiece by analyzing customer data from all touch-points and integrating with our ad products to drive marketing effectiveness.
- Google Attribution 360, formerly known as Adometry, has been rebuilt from the ground up to help advertisers value marketing investments and allocate budgets with confidence. Marketers can analyze performance across all channels, devices, and systems to achieve their most effective marketing mix.
The Google Analytics 360 Suite offers integrations with many third party data providers and platforms. It also plugs right into Google AdWords and DoubleClick Digital Marketing, our core ad technology. That means marketers can turn analytics into action by combining their own data from multiple sources ― website data, audience data, and customer data (e.g. CRM) and more ― and using it to make ads more relevant for people.
“The Google Analytics 360 Suite has a native integration with DoubleClick — that’s a game-changer. Now I can personalize my media based on website user behaviors, such as what they purchase,” said Khoi Truong, Director of Media and Data Optimization at L’Oreal Canada.
When will the Google Analytics 360 Suite launch?
This is just the beginning of our ongoing innovation in enterprise marketing analytics -- we can’t wait to share more. In the meantime, visit our website for more details or hear from directly from our customers below.
Over the coming weeks we’ll dive into the capabilities and benefits of all the new products on the newly refreshed and renamed Google Analytics Solutions blog, and on the Google Analytics Google+ and Twitter pages. We’d love your feedback.Posted by Paul Muret, Vice President of Analytics, Display, and Video Products, Google
1 Source: Forrester Research, Inc. Discover How Marketing Analytics Increases Business Results