Tag Archives: Google Analytics

Google Data Studio for Publishers


As we have seen in a previous post, Google Data Studio (beta) is a great solution for visualizing Ecommerce data. But if you are a publisher and your website is supported by ads, you might be wondering if it would work well for you...wonder no more! In this post we will look at a sample report with real-world data from a publisher.

The report below was created for Online Behavior, , an ad-supported content website. The ads are delivered using DoubleClick for Publishers (DFP), an ad management solution that helps publishers sell, schedule, deliver, and measure their digital ad inventory. On top of that, the website uses DoubleClick Ad Exchange (AdX), which provides a vast global inventory in real time.

With the configurations above in mind, you will notice that the main conversion shown in the Data Studio report below is the metric Publisher Revenue - this represents all revenue coming from DFP and DFP Backfill (in this case, AdX). Please note that this metric is not available by default on Data Studio, if you have the same settings you can create this metric using a calculated field to sum DFP Revenue and DFP Backfill Revenue. In addition to this metric, the website also uses Newsletter Signups as a secondary goal. A typical publisher! 


Let’s take a look at some of the elements shown in the report above:
  1. Scorecard strip: in order to highlight the overall metrics for traffic volume (Users, Sessions, Impressions) and outcomes (CTR, Revenue, Signups) we created a grey strip in the top of the chart. They show the last 28 days values, and right below them you will see a comparison to last period (green is good, red is bad).
  2. Line charts: while the total metric value is very important, it is also critical to keep track of the trends. The two line charts in the report will help the viewer understand if there are any sudden spikes or declines that require additional attention. In this case we chose the main volume metric (Impressions) and the main outcome metric (Revenue).
  3. Donut charts: who doesn’t love donuts?! Those charts are used to provide an overview of the most important Channels when it comes to the two conversion metrics: Publisher Revenue and Newsletter Signups. In summary, Organic brings a lot of Revenue and Display brings a lot of Signups.
  4. Tables: there is no chart that can beat a table when it comes to presenting detailed data. The two tables in the bottom left corner of the report show, for each article and author (author name is sent to Google Analytics through a Custom Dimension), how many impressions, the CTR, and the total Revenue. Using bar charts and heatmaps in a table greatly improves its readability.
  5. Bar charts: in the bottom right corner two bar charts were added to add more info about new and returning users and the devices used.
If you are a Publisher, we hope this will bring some inspiration! You can check out the full report above using this link

Please note that in order to report DFP data in Google Analytics you will need to use Google Analytics 360 integration with DFP (learn more). Happy visualizing!

Posted by Daniel Waisberg, Analytics Advocate


Enterprise-Class Tag Management: A look back on recent features

We built Google Tag Manager with the goal of solving tagging problems for our customers: decreasing implementation time so you can focus on the things that matter most to you, reducing errors so you can have more confidence in your data, and speeding up your tags to make your users’ experiences faster, and make the web a better place.

Last week, we launched workspaces to improve collaboration and enterprise workflows in Google Tag Manager. This is just the latest in a series of improvements designed to better meet the needs of our enterprise customers. In case you haven’t been keeping up with all of our many updates, here are some things you may have missed:

Testing & Security:
  • Environments – Building on our strong preview and debugging capabilities, Google Tag Manager and Tag Manager 360 now also support publishing changes to specific testing environments (e.g. Dev, Staging, QA). You can set up as many environments as you need for your organization and name them whatever makes sense for you. When you go to publish, simply choose the environment you’d like to publish your changes to. It’s never been easier to test your tags to make sure your upcoming tag changes align with your upcoming site changes, and that you get things right the first time.
  • Malware detection – To protect the safety and security of your users, Google Tag Manager and Tag Manager 360 will now automatically detect when tags deployed through your containers point to sites where we’ve found malware. You’ll be notified that there’s a problem, and the culprit tags will be paused so you can track down the issue without risk to your website and your users.
Organization:
  • Folders – As your containers grow over time, it can become difficult to keep track of all of your tags, triggers, and variables. With folders, you can organize these items into logical groupings, making them easier to work with for yourself and your team members.
  • Tag sequencing – Not all tags work independently. Sometimes it’s important for your tags to fire in a specific order. With tag sequencing you can specify tags to fire immediately before or after a given tag to ensure that things happen just the way you expect.
Mobile:
  • Mobile app tag management – Google Tag Manager for mobile apps has been rewritten to be simpler, smaller, and faster. It is now integrated with Firebase, Google’s new mobile app developer platform, which provides end-to-end development tools and analytics.
Services & Support:
  • Tag Manager 360 – Launched earlier this year as part of the Google Analytics 360 Suite, Tag Manager 360 includes services and support to help you get up and running faster, service level agreements (SLAs) to guarantee that you’ll be able to work on your tags as needed and that they’ll consistently fire based on your configuration, and integration with the 360 Suite for centralized account access and user management.
Interested in Google Tag Manager 360? Visit our website to learn more.

Explore important insights from your data — automatically

For marketers, business owners, and product designers, it’s important to be connected to data at all times. However, data by itself rarely provides the insight needed to truly drive a business forward. It can take hours of analysis to come up with just one or two key insights and even longer to share and act on that new understanding. In a constantly-connected world, where customers can make purchases anywhere, anytime from their mobile devices, this lag in time-to-insight is costly.

That’s why we’re pleased to announce that we’re providing a new stream of automated insights in the Google Analytics mobile app. Available on the Assistant screen, this addition to Google Analytics lets you see in 5 minutes what might have taken hours to discover previously. Even better: it gets smarter over time as it learns about your business and your needs. It’s available now in our mobile app on Android and iOS, so you can easily grab insights on the go.
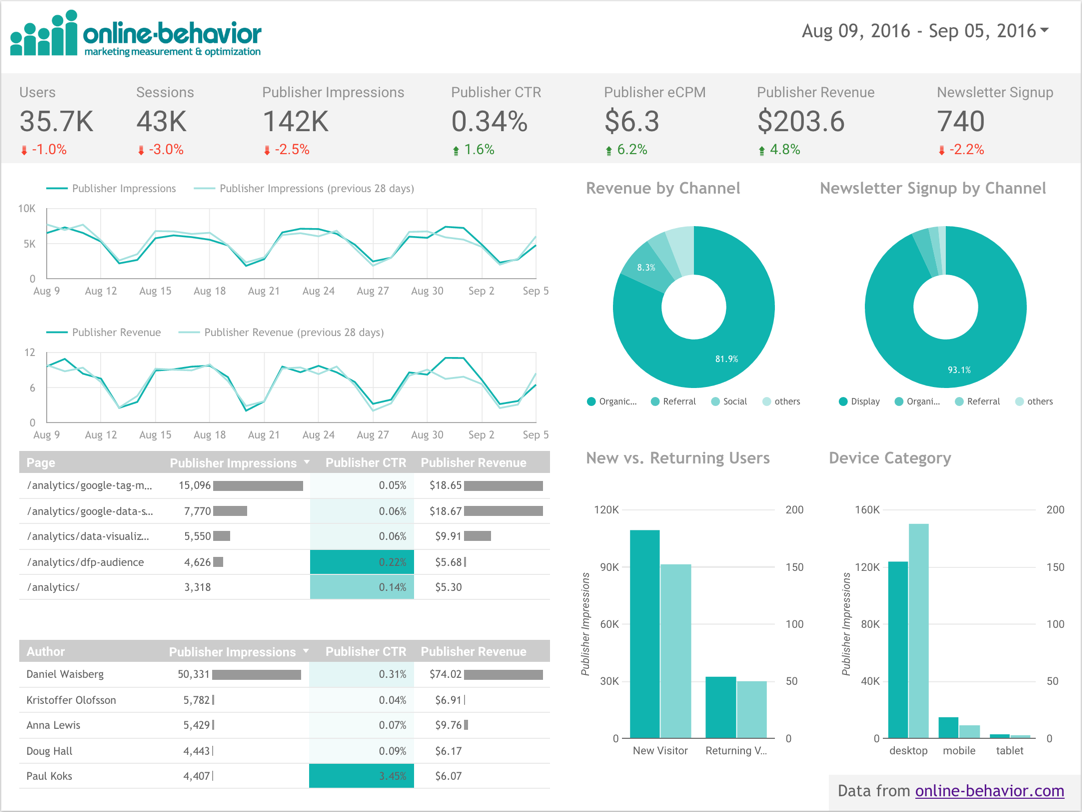
To enable this functionality, we use Google machine intelligence to find critical insights among the thousands of metric and dimension combinations that can be reported in Google Analytics. It helps make analytics data universally accessible and useful as it:
  • Combs through your data to give you meaningful insights and recommendations.
  • Offers quick tips on how to improve your Google Analytics data.
  • Gets smarter over time by reacting to your feedback and how you use it.
  • Helps you share insights so your whole team can take action.

Go beyond simple reporting to view findings and insights automatically, in language you can read: our insight stream enables faster, more informed decision-making that can have real impact on your business.

For example, the holiday season drives a huge portion of annual sales for many retailers. During this busy time of the year, retailers face questions that can be the difference between making their numbers for the year or falling short: Which products are going to be popular this season? Where should we advertise? How are our customers hearing about us and purchasing from us? Answering just one of these questions and acting on that information can take analysts and marketers hours or even days.

Data insights in Google Analytics automate the first steps of answering these questions by instantaneously surfacing opportunities and anomalies hiding in the data. For example, they can tell you which products are experiencing higher than normal sales growth, which advertising channels are driving the most conversions and the best returns, and on which devices customers engage with your brand. This moment-to-moment information gives retailers the power to make nimble, smart decisions that directly impact performance.
You can view your automated insights in the Assistant tab in the official Google Analytics mobile app on Android and iOS for all English-speaking users. We're working to bring this exciting functionality to the web version of Google Analytics and to expand availability to other languages.

We plan on improving with your feedback, so please try the app and then let us know what insights you’d like to see automated.

Enterprise Class Administration in the Google Analytics 360 Suite

If you're in marketing or analytics, you know consumer behavior has shifted dramatically — mobile has created new opportunities for businesses to reach customers at the right moment with the right message at every step in the buyer journey. That’s why earlier this year, we launched the Google Analytics 360 Suite, a set of integrated data and marketing analytics products, designed specifically for the needs of enterprise-class marketers and data analysts.

Since this launch, we’re now excited to announce a series of improvements available to Suite customers. The Google Analytics 360 Suite houses vital data for marketers to understand how their marketing programs, websites, and apps are performing; carefully controlling access to this data and monitoring what happens with it is a top priority, and we’ve made solid improvements.

User management for your Organization

Managing users’ access to your data and Suite assets is critical, and must be done in the context of your organization. The first step towards controlling your data access is to let us know which accounts your organization manages. Organization administrators can do this in the new Suite Home product: http://360suite.google.com/. Administrators will see an “Admin” tab, and underneath it lies the ability to link and verify all of your accounts with the Suite’s products to your organization:


Linked accounts must be verified before user management features will apply to them.

Centralized  User Auditing

Once you have linked and verified all of your accounts within Suite products, we compile a powerful user-auditing report for you. This report lists all users that have access to any of the accounts you linked across all Suite products. This is the only place where you can find a cross-product and cross-account list of users.


For each user in this report, we list rich data to help you make informed decisions about who has access to your corporate accounts. We show the user’s name and picture (when available), their Suite roles, and which products within your organization the user has access to. For all linked Google Analytics accounts, we show the last time the user accessed data from any of them.

Even more details can be loaded per user to show a summary of all the data that user has access to, such as how many properties or containers the user can access, whether the user is licensed for Data Studio, etc.


Filtering

You can use advanced filters to restrict data shown on screen; for example, you can show only users who haven’t accessed Analytics data over the last 6 months:


Remove Stale Users

Combining all of the actions above, you can complete an important task: identifying and removing stale users from your Analytics accounts (other Suite products to come in the future.) After you filter for only users who haven’t logged in recently, you can visit the details pane for those users and remove them from Analytics:


Change History

Suite Change History lets you keep track of when a change was made, who made the change, and what was changed. For example, you can easily see when someone linked a new account to your organization, added or removed users, changed the service level for an object, or changed the end date on an order. Having a record of these changes eliminates confusion over something like an increase in billing. Instead of wondering, you can search your change history to see that one of your administrators changed the service level for a property from Standard to 360, or made changes to the billing parameters. Access to change history is restricted to Owners.


Get Started: Complete your Suite Setup to Use these Features

Organization administrators can login to 360suite.google.com to complete their Suite setup and start using these features right now; contact your account manager if you’re not sure who your organization administrators are. Verify all accounts linked to your organization, then visit your Organization page in Suite Admin to enable the Suite experience today.

Put all these powerful administration features to use right now for your organization to tightly monitor & control access to your valuable data. We have many more improvements planned for the future; so stay tuned as we launch more, and truly bring an enterprise-grade experience to life in the Google Analytics 360 Suite.

Magicbricks Stays Up and Running With Real-Time Monitoring From Google Analytics 360

Magicbricks is India’s top high-end property portal. The website caters to a global market with its unique services and novel online features for both buyers and sellers. Given their commitment to user experience and performance across their site’s global operations, they needed a real-time solution to monitor and optimize against their key digital KPIs.

The company worked with Tatvic Analytics Private Limited, a Google Analytics 360 Certified Partner, to develop a way to reduce website downtime and promptly alert management when outages would occur. Using this real-time anomaly alerts platform, the company would clearly see variances in KPIs and move quickly to troubleshoot and fix them.

The results of this real-time monitoring solution were impressive – response time for detecting errors and unexpected behavior has improved by 70%. 
“As a No.1 property portal, Magicbricks aims to provide our users with an outstanding experience to help them make confident property decisions. Google Analytics 360 helped us measure various unexpected website behaviors which were hampering user experience. The response time for detecting errors, unexpected behavior, and monitoring performance improved by 70% after we deployed this anomaly detection solution.” Sudhir Pai, CEO of Magicbricks
How did they go about building their real-time monitoring solution? First, they defined key metrics for real-time anomaly detection checks. Second, they created their real-time monitoring platform using Google Analytics 360 data processed through Real Time and Management APIs. Third, they applied an anomaly algorithm to data to calculate deviations in real time. Fourth, alerts were sent via SMS to different leaders within the company when variances in KPIs occurred. Learn more about the details in the full case study.
The automated SMS alert system has been improved to detect outages, determine severity, and provide real-time performance updates to senior and middle managers throughout Magicbricks. Today the full Magicbricks team can make the most of these real-time insights to keep the site up and running―and earning more every day.

Posted by Cathy Candano and Daniel Waisberg, Google Analytics team.


Google Analytics adopts Privacy Shield

Today, we’re glad to announce that we have self-certified our adherence to the EU-U.S. Privacy Shield framework.

The Privacy Shield establishes a new framework for transfers of personal data from Europe to the United States. It is a significant milestone for the protection of Europeans’ personal data, legal certainty of transatlantic businesses, and trust in the digital economy.

From now on, Google has committed to applying the Privacy Shield’s principles and safeguards to EU-U.S. transfers of personal data, by default. No action is required on our customers’ part. Google’s certificate will soon be accessible here.

Enterprise-Class Tag Management: Announcing Workspaces

Companies of all sizes use Google Tag Manager, but larger organizations often have very different needs than others. That’s why, over the past year, we’ve launched Google Tag Manager 360, and have been working to build features that better address the needs of enterprise customers.

Today, we’re excited to announce one of these new features: workspaces in Google Tag Manager and Tag Manager 360!

Until now, all tag changes were prepared in a single container draft before being versioned and published. This sometimes led to complicated workflows and workarounds for multi-user teams and their agencies. Workspaces give you more than one space to do your work. Teammates can now easily work on tags at the same time, or make quick changes without publishing everything that’s in the works. Simply create a new workspace, make your changes, and hit publish. Tags, triggers, and variables being worked on in other workspaces will remain unaffected.

The new workspaces are essentially places to work on sets of changes that will become versions. When a workspace is versioned or published, its name, notes and list of changes will be carried over to the version, so you have a full history of what’s changed in your container and when.

What happens if tags you’re working on in one workspace are changed in another? Not to worry. Tag Manager will let you know if there are conflicts when a new version is created. Then it will guide you through merging them into your workspace with an easy-to-use conflict resolution tool!

You’ll also notice that we've made the Google Tag Manager and Tag Manager 360 interfaces faster and easier to use. Need to enable a built-in variable while working on a tag? Sliding screens let you configure related tags, triggers, and variables without dropping out of your current editing flow. Want to know which tags a certain trigger is applied to? Trigger and variable screens now tell you exactly where they’re being used. Not sure what type of variable to use to grab a value from your site? Configuration screens are now easier to read and include more in-line guidance.

Starting today, Tag Manager 360 customers will be able to create unlimited workspaces in their containers! Having unlimited workspaces is ideal for the large organizations and complex collaboration efforts that Tag Manager 360 was designed for. If you’re a Tag Manager 360 customer, or a customer of another Google Analytics 360 Suite product, reach out to your Account Manager to learn more.

Users of the standard version of Tag Manager will also benefit. All containers will be enabled for up to three concurrent workspaces (a default workspace—similar to the container draft today—and two additional custom workspaces). The enhanced interface will also give you greater visibility into exactly what changes are being made when you hit publish.

We'll keep thinking about how to make tagging easier for you. We already have improvements planned for workspaces and other areas of Google Tag Manager and Tag Manager 360 to make our products even more powerful and easy to use. We’ll have more to share soon!

Interested in Google Tag Manager 360? Visit our website to learn more.

AccuWeather delivers enhanced value to advertisers with DoubleClick for Publishers and Google Analytics 360

The Challenge
Publishers use DoubleClick for Publishers (DFP) to manage and serve ads across their sites and apps, and use Google Analytics 360 to understand user behavior on their sites. DFP reports on the ads and ad units on the site, while Analytics 360 reports on the pages on the site.

Each platform on its own doesn’t provide insight into the intersection of data with the other. And with two platforms speaking two different languages, it hasn't always been easy for publishers to understand how user behavior influences revenue and how ads influence user behavior.

That’s why last year we launched an integration between DFP and Analytics 360.

The Solution 
Through the integration, publishers using Analytics 360 can see DFP metrics like impressions, clicks, and revenue within the Analytics 360 interface. This enables publishers to combine revenue data with user behavior insights—for example, the number of ad impressions or revenue each page of their site generates. AccuWeather is one such publisher.

AccuWeather Case Study 
AccuWeather brings real-time weather news and information to more than a billion people worldwide through its website and popular suite of apps. The company knew that if it could better understand the needs of those visitors and match them with more relevant messages from advertisers, it could provide more value to advertisers and boost its own ad revenues. By linking its DFP and Analytics 360 accounts, AccuWeather could see how the behavior of its website visitors affected revenue.

With DFP metrics now in Analytics 360, AccuWeather could see that average revenue per 1,000 sessions rose by 45% on a country-level basis when two new companies began advertising on accuweather.com. This revenue increase was driven by users who were actively in-market to travel and were looking at weather in “exotic” locations such as Turks & Caicos and Barbados. With insights like these, the team has been able to create highly tailored advertising packages with high-value, unique audience segments that sales teams can sell directly or through programmatic marketplaces like the DoubleClick Ad Exchange.


“The integration of DoubleClick for Publishers and Analytics 360 gives AccuWeather real-time visibility to the next level of campaign performance insights and is helping us make better advertising decisions. We’re now creating new behavior-based ad products that are being very well received by our advertisers,” says Steve Mummey, Director of Ad Strategy & Audience Development, AccuWeather.

For more, read the full case study with AccuWeather.

Even More Capabilities Available for Publishers 
In addition to seeing DFP metrics in Analytics 360, publishers will be able to use a consolidated reporting section, see DFP ad unit data together with Analytics 360 data, and do deeper analysis on their DFP data in Google BigQuery.

Reporting 
DFP metrics are consolidated into a reporting section in Analytics 360, making it easy for publishers to understand how their online content impacts revenue.

The figures in the above image are for illustration only and do not represent actual data in AccuWeather’s DFP or Analytics 360 accounts.


Ad Units
Publishers sell their online ad inventory based on the thousands or millions of ad units they have available on their properties. Individual ad slots can be grouped together into ad units so that publishers can create a hierarchy of ad units that represents the structure of their website. Then, publishers can match each advertiser’s message with the right ad slot.

Through this integration, publishers can now see their Analytics 360 data through the lens of their ad units. DFP ad unit hierarchy is mapped to Analytics 360 along with related metrics such as impressions, clicks, and dollars.

And now that analyst and ad operations teams can speak the same language, publishers are able to analyze DFP data through the lens of demographic and interest data in Analytics 360—and they can identify things like which affinity category or user lifestyle is driving the most revenue per 1,000 sessions by ad unit.

The figures in the above image are for illustration only and do not represent actual data in AccuWeather’s DFP or Analytics 360 accounts.


Google BigQuery 
Now that DFP metrics are available in Analytics 360, they can be exported to BigQuery. This means more metrics, more exports, and more data sources. Publishers can run their own revenue models and explore in more detail the intersection of revenue and user behavior.

Stay tuned for more updates from Analytics 360 as we continue to invest in new and exciting capabilities!

3 easy tips to build a relationship with your audience

Drawing new visitors to your site is only half of the battle. Having a plan for them to follow once they get there is the key to encouraging repeat visits and building a meaningful relationship with your readers.

To engage user-focused design for your site, it’s important to consider the following:


1. Keep It Simple

Gating desirable content can be a great way to learn more about visitors by prompting them to fill out a form or sign up for your newsletter to access it. However, roughly 67% of users will abandon an effort to obtain information or purchase something online if there are too many steps to take. Make sure your users get what they need in as few steps as possible. Matched content is another way to keep visitors from checking out too soon by increasing your odds of presenting them with content they are directly interested in.

2. Identify User Moments

People often look for inspiration and ideas while they complete a task online. Anticipating your visitors’ needs can help you set up your site to better serve them so you can capture and capitalize on these important moments. Whether they are purchasing something or just browsing, presenting this information in the right format can greatly increase the amount of time they spend on your site. 


For example, if you’re an eCommerce site selling chocolates, having recommendations alongside each product such as gift boxes, complementing candy, and drink pairings can get your site visitor thinking about the holidays or gifts for their loved ones.

3. Create engaging Calls to Action 

Bold “sign up” buttons and friendly prompts or reminders move visitors to take action. From bold colors and text to exaggerated size and other visual clues, there are a number of ways to make these important actions stand out on your site and even fun for users to engage with. In fact, our own AdSense team tested different campaign graphics on our marketing campaigns and saw higher implementation and engagement rates.
 

To learn more about familiarizing your audience with your brand, check out the AdSense Guide to Audience Engagement.


Posted by Jay Castro
From the AdSense Team

Source: Inside AdSense


Which TV Ads Made the Podium During the 2016 Olympics?

Note: Now that the 2016 Games are over, we've updated the analysis from the original opening ceremonies post to look at TV ad performance for the entire Olympics.


When the 2016 Olympics kicked off almost three weeks ago, many TV advertisers were crossing their fingers that their strategy would pay off.  Reaching as many as an estimated 27.9 million total viewers in the U.S., they were hoping their ads delivered relevant and compelling creative to the right audiences.  To answer the pay-off question, advertisers will predominately look at three specific areas of performance:
  1. Which ads were noticed by the audience?
  2. Which ads drove interest, shifted perception, and increased intent?
  3. And, which ads drove actual consumer response?
To get some insights into these questions, Google evaluated the top 12 brands totaling over 3.5 billion impressions that aired ads during the NBC broadcasts of the event.  The analysis is based on a combination of consumer surveys and second-screen (mobile, desktop, and tablet) response data. Presented in a live Google Data Studio dashboard, the result is a unique view into the full-funnel performance of the ads evaluated.

Awareness

Commercials during large, live sporting events like the Olympics are often uniquely created to leverage both the scale of the audience and the context of the event.  Whether it is telling the personal story of an athlete or playing to our passions like patriotism, they are intended to strike an emotional connection, entertain us, or make us stand up and take notice.

Nike's "Unlimited" ads were the big winner with almost 35% of respondents having remembered seeing the ads when prompted. Including an ad with the first quadruple amputee to summit Mount Kilimanjaro, Nike's powerful ads outpaced typical recall rates in the 20%-25% range.  Coca Cola was a close second with their "That's gold" ads which mixed Olympic competition with everyday moments.  Tide, McDonald's, and Samsung rounded out the top five with respectable recall rates. On overage, ad recall rates for the top five improved 3% percentage points from the initial analysis following the opening ceremonies.
Olympics Ad Recall
Almost 35% of respondents remembered seeing the Nike ads.
Additionally, of those respondents recalling the ad, only 37% could recall the specific product or service featured in the ad.  The net is that only about 13% of viewers can recall both the brand and product in a specific advertisement.  Tide's"Small can be powerful" ad with Simone Biles had the highest product recall rate at just over 50%.

Interest

Advertisers also want the ad to shift perceptions and create interest in the product or service featured.  By surveying both viewers who did not see the ad (unexposed) and those who did see the ad (exposed), we are able to get insights into the impact of each ad’s messaging and creative. Overall, the results were impressive.  On average, respondents who saw the ads were 27% more positive about the associated brands than those who did not.  Likewise, respondents who saw the ads were 32% more likely to find out more and/or purchase the product being advertised.

Compared to the lift measured during the opening ceremonies, both favorability and intent increased significantly over the span of the Olympics increasing ten and twelve percentage points respectively.
Ad Lift in Favorability and Intent
Consumers who saw the ads, were on average, 25% more positive about the brand and were 28% more likely to find out more or purchase the product in the ads.
Interestingly, the baseline favorability and purchase intent for both non-sponsors and Olympic sponsors are relatively equal.  However, non-sponsors saw a greater lift than sponsors with three more percentage points for favorability and seven more percentage points for intent.

Desire

These commercials don’t just make us laugh or make us feel better about the brand — they also make us search and visit websites. Second-screen searching—whether it’s to re-engage with the ad or to learn more about the product — is a powerful indication of desire.  By measuring incremental search queries on Google during the broadcast that are specific and modeled to be attributable to ads shown, we are now able to include responses in our analysis.  During the broadcasts, TV ad driven searches were almost exclusively on mobile — 83% compared to an average of 55% for those brands when the ads were not airing.  For brands, that means a presence on the TV screen isn’t complete without a strategy for small screens, as well.
"83% of searches on Google as a result of seeing the ads occurred on phones and another 10% occurred on tablets making a second screen strategy key to TV advertising."
BMW featured multiple products including a "Performance wheelchair" and garnered the top spot on the podium with a response strength index of 3.21.  McDonald’s and Samsung fought it out for the silver and bronze with 2.01 and 1.57 respectively.  The answer to the question “Do emotional ads work as well as product ads?” is, in this instance, “Yes.”  Both emotional and product ad creatives drove 50% more searches on average.  Also interestingly, ads by non-sponsors drove 17% more searches than their sponsor counterparts.
Indexed Ad Driven Response
Compared to the average of the top 12 ads studied, BMW drove 3.2 times more searches.
Finally, Coca Cola was the overall winner with strong full-funnel performance placing in the top three across all three funnel stages.

Whether people are tuning into the Olympics or their favorite TV show, they use their smartphones to search for information triggered by what they’re seeing.  In these micro-moments, advertisers need to be there, be useful, and be accountable.  That means if you advertise on TV, you can now get a new view of performance across each stage of the funnel — using a combination of consumer surveys and digital response, all in a matter of days.  Armed with these new insights, advertisers are now able to better understand and improve the performance of these investments in concert with their digital media.

Sourcing

Using Google Consumer Surveys to provide consumer ad awareness and interest research, an online survey was conducted in the United States during the period 8/19 - 8/21/16 using a validated, representative sample with a minimum of 700 respondents.  Response data is based on incremental TV ad-driven search queries (Google) during the course of the broadcast that are specific to the ad shown and are modeled by Google Attribution 360 to be attributable to the airings of the commercials. Response data is normalized for total ad impressions during the broadcast for each advertiser.

Happy Analyzing,