Tag Archives: Google Analytics

Join us live on May 23, 2017 as we announce the latest Analytics, DoubleClick and Ads innovations

What: Google Marketing Next keynote live stream
When: Tuesday, May 23, 9:00 a.m. PT/12:00 p.m. ET.
Duration: 1 hour
Where: Here on the Google Analytics Blog

Be the first to hear about Google’s latest marketing innovations, the moment they’re announced. Watch live as my team and I share new Ads, Analytics and DoubleClick innovations designed to improve your ability to reach consumers, simplify campaign measurement and increase your productivity. We’ll also give you a sneak peek at how brands are starting to use the Google Assistant to delight customers.

Register for the live stream here.

Until then, follow us on Twitter, Google+, Facebook and LinkedIn for previews of what’s to come.

Two New Analytics Academy Courses and Year-Round Certification

For three years, many have participated in our free online courses on Analytics Academy, which aim to help you become an analytics expert and learn best practices on how to make your data actionable. In 2013, we started with a single course focused on Digital Analytics Fundamentals, and have since grown our offerings to include Google Tag Manager, Ecommerce and more.

Today, we are introducing two new courses for Analytics Academy: Google Analytics for Beginners and Advanced Google Analytics.


In Google Analytics for Beginners, you will join instructors Justin Cutroni and Krista Seiden to learn the basics of Google Analytics, including how to create an account, implement the code, and set up filters. You'll also learn how to navigate the interface, analyze reports, set up goals, track campaigns, and create dashboards.

Our Advanced Google Analytics course goes in depth on how data gets collected and processed. You’ll learn how to use configurations like Custom Dimensions, Custom Metrics, and Event Tracking. The course also demonstrates advanced techniques, including segmentation, channel reports, audience reports, custom reports, and marketing strategies like remarketing.

Both of these courses include interactive demos and activities to apply what you have learned, using our free Google Analytics Demo Account.

In addition to this pair of new courses, Analytics Academy has added some new features:

• 24/7/365 Certification: You can complete courses at your own pace and earn a certificate of completion at any time. No more certification windows!

• User Profile: You can track your progress and access your certificate from your user profile.

• Track your lesson progress: You can track your progress through a course, and resume a course where you left off. 


Sign up for Google Analytics for Beginners or Advanced Google Analytics and start learning today. 

Happy Analyzing.

Posted by Katie Richardson, Program Manager, Google Analytics

Happy 1st Birthday, Google Analytics 360 Suite! It’s an insights party, everyone’s invited

Time flies (and data mounts) when you’re having fun with measurement. One year ago today, we announced our enterprise suite of marketing measurement and analytics solutions, the Google Analytics 360 Suite. Today we wanted to reflect on this first year. Because, well, a lot has changed. 


Where we started

As marketers know, in today’s mobile-first world, people expect more from brands. They want questions answered quickly, and they want a relevant, engaging experience.

That’s a tall order. So on March 15, 2016, we introduced the world to the Google Analytics 360 Suite, an enterprise measurement solution comprising analytics, tagging, site optimization, data visualization, attribution, and audience management. It helps marketers get more insights — not more data — and deliver more meaningful experiences to customers. Built from the ground up with modern technology and cross-product integrations, it does the heavy lifting for marketers.

Last fall, we welcomed Google Surveys 360 to the suite family, allowing marketers to gauge brand health, get user feedback on site experiences, and understand marketing impact with fast, reliable insights. A great addition to the 360 Suite, Surveys makes getting performance marketing insights and market research to better answer the “why” really easy.


It’s just the beginning: we’re on a journey together

This past year we’ve continued to check in with marketing decision-makers to see what challenges they still face in their data-driven transformations (so we know where to make product enhancements), and here’s what we’re hearing:

  • Building a culture of growth
    Leading marketers are embracing data and testing to continually improve the customer experience — or simply, make a website better — day by day. This growth mindset requires a willingness to experiment. And with that comes the challenge of getting comfortable with failure. Remember: There’s still a lot to be learned from (and celebrate in) a success rate of 1 in 10.
  • Dealing with data
    When we surveyed marketing decision-makers at the end of last year, 61% said they struggled to access or integrate the data they needed in 2016. And 26% of marketers said they didn't have the right analytics talent or enough of it.1 If marketers spend too much time wrangling with data, that means measurement is not always top of mind.
  • Measurement is sometimes an afterthought
    Only 5 out of 10 marketers said they think about measurement while developing campaign strategy.2 When data keeps pouring in, thinking about what campaign information you need to collect may be the last thing on your mind. But if you don't define your measurement goals from the beginning, you may not collect the right data to understand what's working and what isn't.

Big plans for the year ahead

Marketers who rethink measurement for a multi-screen world are reaping the benefits. In fact, leading marketers are 75% more likely than the mainstream to have moved to a more holistic model of measurement in the last two years, according to a recent study from Econsultancy and Google.3 But, getting a handle on all your data can take time. And that’s OK.

Google has some exciting product developments in the works that will help marketers automatically uncover insights and make smarter, faster decisions. In fact, we recently shared an Analytics 360 update that gives our customers the fastest access to the freshest first-party data we've ever offered.

The party’s just getting started. Stay tuned in for another exciting year.

Happy analyzing!

1 Google Surveys, U.S., "2016–2017 Marketing Analytics Challenges and Goals," Base: 203, marketing executives who have analytics or data-driven initiatives, Dec. 2016. 
2 Google Surveys, "Measurement in Campaign Timeline", Base: 1,092 marketing executives, U.S., August 2016. 
3 Econsultancy and Google, Analytics and Measurement Survey, 2016, Base: n=500 marketing and measurement executives at North American companies with over $250MM in revenues

Lessons Learned: Testing and Optimization Tales from the Field

Max van der Heijden is a user experience and conversion specialist at Google who works with companies across Europe, the Middle East, and Africa. Max shares his thoughts about how companies can build a culture of growth and experimentation.


How many times have you launched new features or page designs on your website without testing first?

In an ideal world, companies should test everything before rolling out site changes. But some websites have too little traffic to generate credible results from experiments, and some bugs should just be fixed if they prevent users from achieving their goal. At the very least, analyze your analytics data and use qualitative methods such as user tests and surveys to validate any improvement ideas you have before implementing. If you have the traffic volume: Test!

I’m part of a team at Google that works with advertisers to identify opportunities for improving website user experiences through experiments and testing roadmaps. When our team of UX specialists begins consulting with a new company, the first three things I tell them are:

  1. The possibilities for improvement are enormous. Even if an experiment increases your conversion rate by “just 5%,” you can calculate the positive effect on your revenue.
  2. What works for one may not work for all. No matter how many times we have seen recommendations or “best practices” work on other — maybe even similar — websites, that does not mean it will work for your users or your business.
  3. Expect failures — and learn from them. Testing takes time, and it's hard to know which tests will pay off. Embrace failures and the lessons learned from them.

Making the switch from “get-it-live” mode to a test-and-learn mindset takes time and effort. Leading companies are building a culture of growth: one where people focus on using data and testing to optimize the customer experience day by day. Below are some of the key lessons learned as we work with teams embracing this growth mindset.

Get top-level support

When we first talk with customers, we insist a decision-maker attend our meetings. If there's no support from the top, all of our testing ideas could end up on the shelf collecting dust. Obviously, the marketing executive or CEO won’t have an a-ha moment if you frame testing as a way to improve conversions. The trick is to show how testing impacts a business goal, such as revenue or, better yet, profit. Then the decision-maker will have an ohhh moment: As in, “Ohhh, I knew this was important, but I didn’t think about how a small change could have such a big impact on our bottom line.”

Top-level support will help you get the resources you need and unlock the potential of people already working on experiments. The trend we see is typically one or two persons who start doing the optimizations. They are usually mid-level designers or data analysts who have an affinity for conversion rate optimization, but are often working in a silo.

On the other end of the spectrum, we see companies that have fully bought into the power of experimentation. Multiple customers even have a group of product managers who work on projects with a group of specialists, including a data scientist, copywriter, designer, and even a design psychologist.

Tip: Look for these three types of people to jumpstart a culture of growth in your organization.

Prioritize, prioritize, prioritize

You can't test every idea at once. And prioritization should not be a guessing game.

When we surveyed a group of our EMEA advertisers at a conversion rate optimization event, 38% of the respondents said they use their gut or instinct to prioritize, while 14% allow the HiPPO (highest paid person’s opinion) to call the shots.1 Instead, try using a framework that takes into account past lessons learned and resource requirements.

Map test ideas in a speed-versus-impact grid, and prioritize experiments that are quick to launch and likely to have the biggest impact. Keeping track of all prior test results is another way to ensure past learnings come into play when faced with a HiPPO.

Tip: Start with ideas that will be simple to test and look like they could have the biggest potential impact.


Turn fairweather fans into engaged experimenters

Over time, as you share testing insights and achieve a few wins, more people will jump on board and you’ll need to train people on a repeatable testing framework.

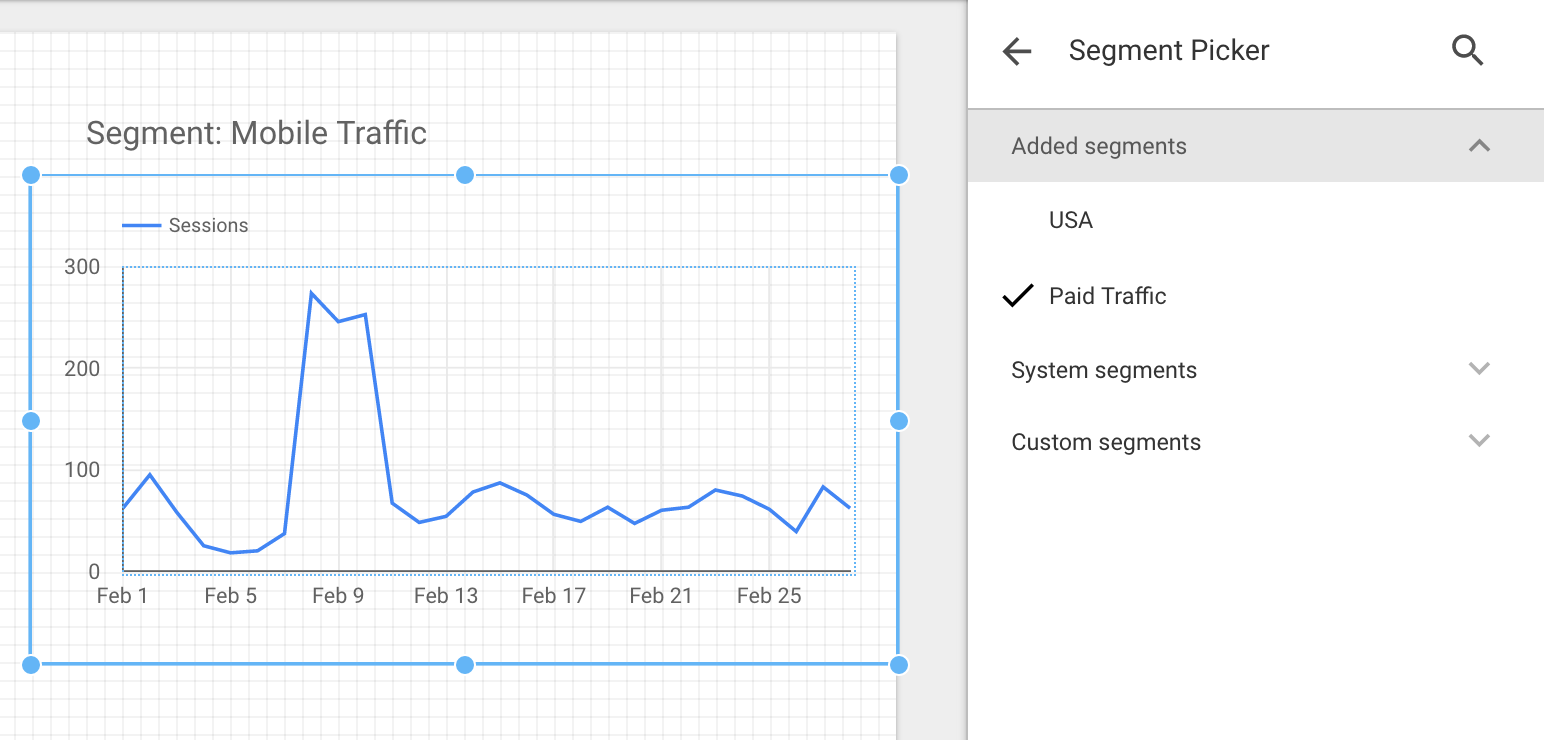
Testing is part of a cycle: What does the data tell you? Did the experiment succeed or fail for every user, or just for a specific segment of users? Analyze your test results, especially from failed experiments, and use those insights to improve the customer experience across your touchpoints. And then conduct another test.

Just as important: How do you keep people excited and engaged in the process? Try using a shared document to invite everyone to submit their improvement suggestions for your website or app. You can even add gamification to this by keeping score of the most impactful ideas. Or, have people guess which test variation will win before you run the test. When you share the results, recognize or reward people who correctly predicted the winner.
Tip: Three ways to get your team engaged with testing and optimization

Feel good about failures

By its very nature, experimentation involves a lot of failure. A typical website might have 10 or 100 or even 1,000 things to test, but it might be that only a small percentage of those tests lead to significant, positive results. Of course, if that one winner leads to a 5% or 10% improvement in conversions, the impact on revenue can be enormous.

When we surveyed EMEA advertisers at one of our events, we found that companies running one to two tests a month had a 51% success rate. But for respondents who said they ran more than 21 tests a month, the success rate decreased to 17%.2

In the beginning, it’s easier to spot areas for improvement and “low-hanging fruit.” The more experiments you run, the more you’ll be focusing on smaller and smaller things. Then, the more you test, the less “successful” you will be. "Our test success rate is about 10%," says Jesse Nichols, Head of Growth at Nest. "But we learn something from all our tests."

Download the guide How to Build a Culture of Growth to learn more about best practices for testing and optimization.

1-2 Source: Conversions@Google 2016 - State of CRO event attendee survey, 145 respondents, EMEA, September 2016.

Agilent Technologies Democratizes Data With Smooth Migration to the Google Analytics 360 Suite

Agilent Technologies provides laboratories worldwide with instruments, services, consumables, applications, and expertise. They are experiencing a shift as more of their buyers are turning to the web for information on healthcare equipment and services.

Image: AdvanceBio Columns Improve Laboratory Workflows (source
As part of a recent digital transformation to meet their audience’s needs, they sought to expand the analytics capabilities of the company. They worked with E-Nor, a Google Analytics 360 Services and Sales Partner, to develop a measurement strategy and support an analytics technology migration to the Google Analytics 360 Suite.
Below is a quick summary of how Agilent is democratizing their data with the Google Analytics 360 Suite, to learn more read the full case study.
The key challenge was to provide a solution with minimal technical overhead that encouraged analytics adoption within the organization. Agilent also needed a solution that would integrate well with data from other sources. 

Together, Agilent and E-Nor developed a measurement strategy incorporating business objectives, strategic initiatives, and key performance indicators. They then outlined a complete migration plan to meet many requirements, including implementation, dashboarding, data governance, and more.

Once the plan was in place, it was put to motion! E-Nor supported Agilent’s teams through a successful analytics solution migration. As a result, data from Analytics 360 is now used to help make both strategic and niche decisions throughout the organization. BigQuery and Data Studio expand capabilities by providing easy access to advanced analysis for key stakeholders.
“Google Analytics 360 has enabled an analytics culture where all digital teams have access to data in real time, and insights can quickly become business action.” Karen Brondum, leader of the Digital Analytics COE at Agilent
Thanks to Agilent and E-Nor’s collaborative efforts, the company has experienced a 400% growth in analytics users. They were also able to lower the cost of ownership for their analytics program, with less effort from all teams required to get to business insights. Learn more about how they achieved those results in the full case study.


Posted by Tara Dunn (E-Nor) and Daniel Waisberg (Google)

Data Studio now globally available

Last month we announced we removed the five report limit in Data Studio, allowing you to create and share as many reports as needed — all for free. Today we are opening up access to 180+ countries, enabling even more businesses to easily connect to data and create beautiful, informative reports that are easy to read, easy to share, and fully customizable.

New, powerful features

In addition to making Data Studio accessible in more countries, we’re also adding more powerful features to help you better analyze and report on your data, including:

Filters

You can now filter your data in more ways, and it's easier to reuse filters on multiple charts. This new functionality includes:
  1. Reuse – Create a filter once and then use it on as many different components on the report as you want. No more recreating identical filters!
  2. Compound filtering – Combine multiple AND and OR filter conditions together into one reusable filter.
  3. Metric filters – Filter metric values that are too large, too small, or within a specified range.
Learn more in the Filter Help Center article.

New Filters UI

Google Analytics segments

You can now apply Google Analytics segments to your charts!

A Google Analytics segment represents a subset of your data, for example, Returning Users. You can now see all your Google Analytics segments in Data Studio and apply them to any chart. And, if you update the definition of your segments in Google Analytics, those changes will apply to the segments in Data Studio.

Learn more in the Segments Help Center article.

Data Studio allows you to link to your Google Analytics segments.

More powerful data connectors

We’ve improved several of our most popular data connectors, YouTube, DoubleClick Campaign Manager, and AdWords, by adding many new dimensions and metrics. Some highlights include adding YouTube video title, DoubleClick Campaign Manager revenue and cross-environment conversions broken out by app, AdWords campaign ID, and keyword quality score. For a full list of all the new fields, please see the Data Studio release notes.

Google Cloud Platform integrations
We’re also announcing tighter integration with the Google Cloud Platform to enable faster data reporting at scale and more powerful functionality.

File upload

Not all your data resides within SQL or Google databases. Data Studio now has the ability to upload up to 2GB of CSV data for free enabling you to bring in data from anywhere. Have more data? Upload directly into BigQuery using your BigQuery account to take advantage of the scalable processing power of Google's infrastructure.

Tighter BigQuery integration

Not only can you upload data directly into BigQuery, Data Studio now supports Standard SQL in BigQuery for custom queries and partitioned tables.

Learn more about these new features
Not sure where to start? You can browse our gallery of Data Studio templates. Need more information on these new features? Visit the Help Center articles for more details:


As always, your feedback and questions are welcome in the Data Studio community forum.

Happy reporting!
Posted by Dave Oleson, Data Studio Product Manager

The life of a help center article

Google has dozens of help centers both for external and internal products. Our Technical Writers work hard to keep up with new features, constantly adding new articles, reviewing user feedback and usage metrics to improve existing content. They work closely with Product Managers, Engineers, Marketing and other parts of the company to make sure their content is accurate and in line with the messages Google wants to convey.

The Google Analytics 360 Suite publishes 8 Help Centers, including Analytics, Tag Manager, Optimize, Attribution and others. With so much knowledge being shared, we thought it would be interesting to our users to understand how we produce this content and where our ideas come from. So we decided to talk to one of our Technical Writers, Rick Elliott, who is responsible for content published in the Data Studio Help Center.


Basically, all help content comes from asking the question: what does the user need? We hope the product is intuitive and easy to use so that extra help is not required, but there are always concepts or flows that require more explanation. So that's the start of a new Help Center article. Depending on the situation, a new article usually stems from 1 of 3 sources:
  1. We launch a new feature and it requires documentation.
  2. We get questions from users on the help forum that can be answered by a new article.
  3. A writer gets a bee in their bonnet and decides we need to document something more fully.
    After that, it's a process of interviewing the subject matter experts and trying it through lots of sample reports to make sure the flows are right. Once the first draft is done, it is sent out for review and comments, but there may be another round of review and feedback before it gets published. Another big step in the help center content flow is localization: we usually get the translated content out a week or two after publishing the English version. 

    Watch the video to learn more about how Rick developed massive Help sections such as the  chart references and the "warm welcome report".

    Posted by Daniel Waisberg and Rick Elliott

    Real-time just got real: Google Analytics 360 offers fresher insight

    You’ve just launched a website or feature. Your toe is already tapping. Wait, wait, wait — you can hardly wait one hour to see exactly how it’s performing. Sound familiar? If you’ve been there, we have exciting news for you.

    Google Analytics 360 can now provide updated insights as quickly as every 10 minutes. We’re proud to give our customers the fastest access to the freshest first party data Google Analytics has ever offered.

    What did you just say?!
    If you need to know how your sites, microsites, or digital engagements are doing right now, we’ve got you covered. Most first-party data in Analytics 360 can now be collected, processed, and available — via our UI, API, and BigQuery integration (coming soon) — in as fast as 10 minutes. This means you can move faster to:
    • Fix things when they’re broken
    • Detect trends and react when things are popular
    • Understand and take action on the impact of cultural events or social memes
    To see how fresh the data is in your report at any time, just look for this icon in the upper right:
    When you see this icon, it means you’re looking at today’s data and the report is supported and super fresh. Hover over the icon to see how fresh the data is!

    This new level of freshness is only available to Analytics 360 users. To learn more about which reports, views, and properties support fresher data, and the factors affecting data freshness, check out our help center.

    Some site owners just can’t wait
    Brands and sites in the business of capitalizing on momentary consumer attention are excited about fresher insights. Take the case of publishers and retailers as an example.

    Publishers strive to put the richest, most interesting content in front of users at any given point in time. The trick is understanding what’s rich and interesting right now — and that’s a constantly moving target.

    Publishers have long referenced our real-time Google Analytics reports to make decisions, but sometimes they’re looking for deeper insight than what is provided in those reports. Fresher insights across additional Google Analytics reports help our publishers make even more informed content decisions, paving the way to better user acquisition, user engagement, and a stronger relationship between content consumer and publisher brand.

    Online retailers are in the same boat. When celebrities wear a product or mention a brand on social media, product interest may spike. Retailers may have just minutes to capitalize on purchase intent before it wanes.

    When a product’s popularity is on the rise, retailers can react by upping its prominence to capture interest, running focused promotions or recommending related products to expand consideration. With fresh insights available as soon as every 10 minutes, retailers move faster and turn trending interest into sales.

    Speed is good, but safety comes first
    As you know, Google Analytics has the ability to pull in data from other sources like AdWords and DoubleClick. We refer to these as “integration sources” and these sources operate with additional requirements, like fraud detection, that mean that the data in these reports are exempt from our enhanced freshness capabilities.

    For example, any report with Ads data, including a dimension widened by an Ads integration, will continue to be made available within hours. For further details on which reports are supported or not supported, please read the help center article here.

    Audience Data Mining Case Study: PBS & LunaMetrics

    Google Analytics 360 can be used to collect and process a wealth of data, and there are many opportunities to make use of it. But some companies want to take advantage of the powerful data mining tools offered by the Google Cloud Platform: enter the Google Analytics 360 export to BigQuery. Today we're publishing a new case study developed by LunaMetrics and PBS, showing how Google Analytics 360 and the Google Cloud Platform were used  to classify audiences to improve user experience design, personalization, and targeting for marketing and messaging. 

    PBS television programming reaches millions of people, and its website PBS.org is an online content hub that supports that television experience and provides online video streaming content. PBS.org, like many websites, strives to understand its users and their needs for features and content by developing personas and audience segmentation. Personas often begin with anecdotal knowledge of customers or users and can be informed by many kinds of data, including interviews and other qualitative ethnographic data as well as surveys and other quantitative market research.

    PBS was able to develop an additional approach with Google Analytics 360 and its BigQuery export: employing a data-driven method to classify audiences. PBS already had a robust Google Analytics implementation, with the default information enhanced by Event Tracking for on-page interactions and a wealth of internal information surfaced and stored in Custom Dimensions.
    A data mining algorithm classified clusters of similar users based on a number of behavioral factors.
    PBS partnered with LunaMetrics on a Data Science Solutions project to distill large and complex datasets like these into concrete, usable results. LunaMetrics applied data mining techniques to find patterns of audiences based on their website behavior. Using BigQuery along with Google Cloud Platform products such as Cloud Datalab and Cloud Storage, they were able to extract answers from over 330 million website sessions.

    The analysis identified six distinct groups of users, for instance those who primarily focus on either particular kinds of content (such as news or information for parents) or features (with different preferences for watching video online or on TV-connected devices). PBS was able to use these findings to reinforce and refine their existing personas, now based on behavioral data.  Moving forward, these personas can inform the creation of new audiences to be used in remarketing, advanced reporting and content experimentation.

    For more information, check out the full case study. For the technical details, check out Audience Modeling with Analytics 360 and Google Cloud Platform on the LunaMetrics blog.

    Posted by Jonathan Weber (Lunametrics) and Daniel Waisberg (Google)

    ‘All Killer, No Filler’: The Next Web finds the right message with Google Optimize 360

    In a world where consumer behavior can shift on a dime, marketers constantly ask themselves: How can we be more useful to our customers? With all the data businesses collect, the challenge becomes tuning out the noise to focus on insights your team can act on.

    Today’s most successful businesses have turned to a new approach: building a culture of growth and optimization. This is where everyone in an organization is using data to test and learn as a means to improve the customer experience every day.

    The Next Web, a technology-media company and online publisher, has embraced this testing culture and turned to Google Optimize 360 to help them find just the right message to drive readers to their conference website.

    The Next Web Case Study 


    The Next Web’s conferences bring tech leaders, entrepreneurs, and marketers together to innovate, share, and look ahead. The first TNW conference was created in 2006 by Patrick de Laive and Boris Veldhuijzen van Zanten, when they couldn’t find the kind of event they needed to showcase their own startup.

    That first event drew a respectable 280 attendees, but the founders knew they needed a better way to promote future TNW conferences. That’s when they launched thenextweb.com, a tech news and culture website that today attracts 8 million users a month. The Next Web’s two annual conferences in New York City and Amsterdam now draw over 20,000 attendees.

    The Next Web’s marketing team uses promotional messages within articles on thenextweb.com to drive potential attendees to the conference website and sell tickets. To find out which combination of messages works best, they used Google Optimize 360, an integrated part of the Google Analytics 360 Suite.


    "We want more people to read content on thenextweb.com as a first step," says Martijn Scheijbeler, who leads the marketing team's efforts. "If we can convince them to become a loyal user, we can try to interest them in different opportunities. In the end, we’d like them to join us at one of our events to experience what The Next Web is really about." 

    With one of its conferences coming up, The Next Web's marketing team wanted to compare different headlines and descriptions to see which combination would drive more readers to its conference page. Using Optimize 360, The Next Web team ran a multivariate experiment to discover the combinations that worked best.


    For The Next Web, the results were clear: The "All Killer, No Filler" headline with the "This one's different, trust us" description was the winner. During the experiment it performed 26.5% better than the original headline and description, with a 100% probability to beat baseline.

    Today The Next Web team tests and optimizes its conference messages day by day. Better messaging means more traffic to The Next Web conference site, and that means more attendees. It also gives the marketing team extra wins like higher awareness and more newsletter signups.

    “Optimize 360 and Analytics 360 make testing easy for us,” Martijn says. “They give us much better insights into how many clicks we’re getting for each message. We’re reaching more people who want to come to our conferences, and those better results are going right to our bottom line.”


    For more, read the full case study with The Next Web.