Tag Archives: Geo

Introducing the Google My Business API

Google My Business is helping businesses around the world connect with their customers when they search for them on Google. Today we’re introducing the Google My Business API to make it easier for large businesses and third parties to integrate with the Google My Business platform and publish updates to customers on Google Search & Maps. For example, you can now set your special hours for the holiday season and update them across all of your locations using the Google My Business API.

Through the new Google My Business API, developers can:

  • Create business locations with information such as name, address, phone number, category, business hours, and more
  • Manage special hours
  • Mark a business location as permanently closed
  • Manage business photos
  • List, invite and remove managers on locations and business accounts
  • Read listing state to identify Google updated, duplicate and suspended locations
  • Search/Filter locations by name, category and label
  • Set the service area for a business either by specifying a point and radius or Place IDs

Here's a sample java function that creates a new location and sets special holiday hours:
public static Location createLocation(String accountName) throws Exception {
  Location location = new Location();

  // Street address
  Address address = new Address();
  List addressLines = Arrays.asList("740 Valencia Street");
  address.setAddressLines(addressLines);
  address.setLocality("San Francisco");
  address.setAdministrativeArea("CA");
  address.setCountry("US");
  address.setPostalCode("94110");
  location.setAddress(address);

  // Business hours
  BusinessHours businessHours = new BusinessHours();
  List periods = new ArrayList<>();
  List days = Arrays.asList("Monday", "Tuesday", "Wednesday", "Thursday", "Friday");
  for (String day : days) {
    TimePeriod period = new TimePeriod();
    period.setOpenDay(day);
    period.setOpenTime("11:00");
    period.setCloseTime("20:00");
    period.setCloseDay(day);
    periods.add(period);
  }
  businessHours.setPeriods(periods);
  location.setBusinessHours(businessHours);

  // Special hours
    Date christmasEve = new Date().setYear(2015).setMonth(12).setDay(24);
    Date christmasDay = new Date().setYear(2015).setMonth(12).setDay(25);
    List periods = new ArrayList<>();
    periods.add(new SpecialHourPeriod()
        .setStartDate(christmasEve)
        .setOpenTime("11:00")
        .setCloseTime("20:00")
        .setEndDate(christmasEve));
    periods.add(new SpecialHourPeriod()
        .setStartDate(christmasDay)
        .setIsClosed(true));
   SpecialHours specialHours = new SpecialHours()
        .setSpecialHourPeriods(periods);

  location.setSpecialHours(specialHours);

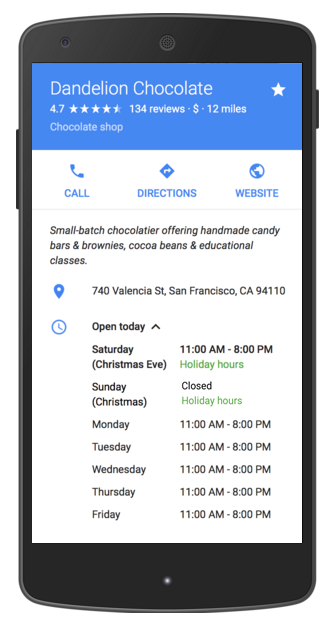
  location.setLocationName("Dandelion Chocolate");
  location.setStoreCode("DC1");
  location.setPrimaryPhone("415 349-0942");
  location.setPrimaryCategory(new Category().setCategoryId("gcid:chocolate_shop"));
  location.setWebsiteUrl("https://www.dandelionchocolate.com/");

  // Create Location
  CreateLocationRequest createLocationRequest = new CreateLocationRequest();
  // RequestId is a unique id for each location created
  createLocationRequest.setRequestId(“1a84939c-ab7d-4581-8930-ee35af6fefac”);
  createLocationRequest.setLocation(location);
  createLocationRequest.setLanguageCode("en-US");
  Mybusiness.Accounts.Locations.Create createLocation =
      mybusiness.accounts().locations().create(accountName, createLocationRequest);

  Location createdLocation = createLocation.execute();

  System.out.printf("Created Location:n%s", createdLocation.toPrettyString());
 
  return createdLocation;
}
When special hours are set in Google My Business, we will tell customers that they’re seeing holiday-specific opening hours on Google:

To learn more about the Google My Business API and to apply for access, visit our developer page.

Questions or feedback? Contact the API team on the Google My Business API Forum.

Posted by Aditya Tendulkar, Product Manager, Google My Business

The new Google Maps SDK for iOS includes bitcode support, new events and more

Today we are launching the Google Maps SDK for iOS 1.11, which includes bitcode support, new events and some features previously available only in the Android SDK.

Bitcode is an intermediate representation of your app that is uploaded to the Apple Store. With this abstraction, Apple can optimize for specific target devices at provisioning time.

The Google Maps SDK for iOS 1.11 also introduces two new events: didLongPressInfoWindowOfMarker and didCloseInfoWindowOfMarker. The long press event takes advantage of iOS long-touch as another way for users to interact with Maps SDK for iOS enabled apps. The close event is particularly useful if you wish to programmatically zoom back out on the map after the user has looked at the detail associated with a particular marker.

We have also added start and finish rendering events to the GMSMapViewDelegate and GMSPanoramaViewDelegate protocols. The start rendering events are triggered when tiles have just been requested or labels have just started rendering. The finish events are triggered on rendering completion for tiles and StreetView panoramas, respectively.

Finish events can be used in conjunction with an activity indicator to accurately represent when a map has finished rendering. The sample code below shows how to include this functionality. (We’ve also included SVProgressHUD in the sample below to improve the user experience, but it is not required)

import UIKit
import GoogleMaps

class MapRenderingViewController: UIViewController {
  @IBOutlet var mapView: GMSMapView!

  override func viewDidLoad() {
    super.viewDidLoad()
    mapView.delegate = self
  }

  // MARK: - GMSMapViewDelegate

  func mapViewDidStartTileRendering(mapView: GMSMapView!) {
    SVProgressHUD.showWithStatus("Loading tiles")
  }

  func mapViewDidFinishTileRendering(mapView: GMSMapView!) {
    SVProgressHUD.dismiss()
  }
}
Lastly, the Google Maps SDK for iOS 1.11 offers new features & bugfixes we think you'll find useful, including:

  • Setting ground overlay opacity with an alpha value
  • Polygon hole support
  • Increased camera tilt range at high zoom
  • Additional Places autocomplete functionality

Take a look at our release notes and update to Google Maps SDK for iOS 1.11 today.

Posted by Megan Boundey, Product Manager, Google Maps Mobile APIs

Predicting the Future with Google Maps APIs

Planning journeys ahead of time has always been difficult, since traffic conditions vary greatly over time. Developers have used live traffic data from the Google Maps APIs for years to help drivers with this problem, but up to now, this has been available only for journeys starting very close to now, and limited to Google Maps for Work customers only.

Today we’re extending traffic predictions in the Google Maps APIs indefinitely into the future - a feature we call predictive travel times. This will let developers plan journeys hours, days or even weeks in advance, using Google’s model of what the traffic conditions will be like on that day. We’re also making all traffic features in Directions API and Distance Matrix API available under our Standard Plan (2500 requests/day for free, with pay-as-you-go pricing for extra requests), and increasing the waypoint limit in Directions API for these developers from 8 to 23 waypoints. (Traffic features and higher waypoint limits in the JavaScript Maps API remain limited to Google Maps for Work customers for now.)

Using these new traffic features is super simple—just add the departure_time parameter to Directions API or Distance Matrix API queries, and the results will contain the travel time estimate given the predicted traffic conditions at that time. The route returned may also change depending on traffic conditions, which lets developers recommend the fastest route to their users. For example, the image below shows the fastest route from San Francisco International Airport to the Google campus in Mountain View late at night when there’s no traffic (blue), and during peak hour when an accident on Highway 101 has slowed traffic to a crawl (red).
Screen Shot 2015-11-10 at 8.26.11 PM.png

Since traffic conditions far in the future could vary greatly, developers can set an optional traffic_model parameter to choose whether they’d prefer to get an optimistic, pessimistic or best_guess estimate of the travel time. For example, one of our customers, Redfin, plan to use the Google Maps APIs to predict how long it will take to drive between homes, so they will use the pessimistic traffic model to ensure there’s enough travel time taking traffic into account. On the other hand, a developer building thermostat app wants their user’s house to be warm by the time they get home from work, so they would use the optimistic travel time estimate to calculate when their user is likely to get home, and when their thermostat needs to turn on.

The default traffic model, best_guess, returns the most likely travel time given everything that’s known about the traffic conditions—both the historical model for the queried time and day of the week, and the actual live traffic conditions right now. This can be used in apps that give drivers an indication of what their travel time will most likely be.

To learn more about the traffic features in the Google Maps APIs, please take a look at our video, check out the documentation for the Directions API, the Distance Matrix API and the JavaScript Maps API Directions and Distance Matrix services, or download the updated client libraries for Java or Python.

Posted by Elena Kelareva, Product Manager, Google Maps APIs

The Google Maps APIs team hits the road with ‘Code the Road’ in Europe


After an exciting road trip across the U.S. this summer, we decided to bring Code the Road to Europe to highlight what developers have made possible with the Google Maps APIs. We’ll be driving our customized 1979 Volkswagen T2 Bus with 50 Horsepower, 78Tkm on a four stop trip across Europe where along the way we’ll meet with developers, customer and partners.

Code the Road Europe kicks-off in Tel Aviv on November 10. From there we’ll be heading across Europe—stopping in Berlin, Hamburg and London.

We will also be hosting three developer meetups: Tel Aviv on November 10, Berlin on November 12 and London on November 25. The meetups will highlight how developers can use the Google Maps APIs in their apps and websites and include sessions with Google Engineers and customers. We’re expecting these meet-ups to fill-up quickly, so register today to reserve a seat at a location near you.

We’ll be hosting a 24-hour hackathon in Hamburg beginning the afternoon of November 18. Ubilabs and the Google Maps APIs team will be bringing developers, product managers and students together to develop innovative solutions to lend a hand in the Syrian Refugee Crisis.

We will be sharing on-the-road updates and photos on the site throughout the trip. We hope to see you on the road!

Posted by Tobias Espig, EMEA Marketing, Google Maps APIs

Map Tips: (What’s nearest; Who’s closest?) Creating a better customer experience with the Distance Matrix service


Editor’s note: ‘Map Tips’ are designed to answer frequently asked questions about Google Maps APIs. For important tips on how to deploy Google’s mapping tools, read more from Corey Bradford, Google Maps Solution Architect at Google.

Many location-based sites and applications can accurately tell users how far they are from nearby points of interest. However, they often provide only straight-line distance (ie as the crow flies), which isn’t always a true representation of proximity. Alternatively, these applications can be improved by the Distance Matrix service available in the Google Maps Javascript API and the Distance Matrix Web Service, which provides accurate travel distances and times, and for premium customer can even factor in current traffic conditions.

Store locators and rideshare/taxi applications are common applications that can benefit from using the Distance Matrix service. In both use cases, a user is trying to determine their relative distance from either a store or taxi.

Store locators
Suppose a customer has provided their location, “1903 Toro Canyon Rd, Austin, TX 78746.” (Point C on the map) Using straight-line distances, your application found your three nearest stores, as shown on this map:
dm_map1.png
“As the crow flies,” store #1 (shown in the image below as "B") is clearly nearest to the customer location, “C.” However, there’s a river between these locations. Unless the customer intends to use watercraft for part of their travel, they’ll need to travel via the nearest bridge or tunnel. The Directions Service provides the suggested route, confirming the need to travel much farther than the straight-line distance:
dm_map2.png

Since we know that the straight-line distance doesn’t accurately reflect the proximity of the stores in this case, let’s make a call to the Distance Matrix Service to determine actual driving distances and times. Here are the results returned:


Store #
Straight-Line Distance (mi)
Driving Distance (mi)
Driving Time (min)
Driving Time with Current Traffic (min)
1
1.4
5.4
15
20
2
2.7
4.4
9
15
3
2.5
4.7
11
11

Now we have some useful information for the customer. First, we can see that, although store #2 is the farthest in a straight line, it’s actually the shortest driving distance. In addition, in normal traffic conditions, it’s also the shortest driving time. However, if we consider current traffic conditions, we see that store #2 will take longer to reach than store #3. The following maps, which use the Directions Service along with the traffic layer, illustrate these results:
dm_map3.png

In this case, the customer may choose to visit store #3 (shown in the image below as "B") if they are leaving now or store # 2 if they plan to travel later, after traffic clears.
dm_map4.png

Rideshare and taxis
Now let’s consider another example: users looking to hire a car service or dispatchers who need to direct the nearest taxi to a customer. As the following maps shows, the user can see the actual current drive times, provided by the Distance Matrix API, of each driver to their location, regardless of straight-line distance.
Taxi mobile map.png

What's Under The Hood
Now that we’re taken a look at how driving distances, duration, and duration in traffic information can benefit your customers, you might be wondering “How can I implement this as a developer?” Below are code snippets from the store locator example that provide the technical details of how to build these features using the Distance Matrix service.

For simplicity, we’ve pre-defined the customer and store locations:
var customerLocation = '1903 Toro Canyon Rd, Austin, TX 78746';

var store1 = '3808 W. 35th, Austin, TX 78703';
var store2 = '4933 Plaza on the Lake, Austin, TX 78746';
var store3 = '6500 Bee Cave Rd, Austin, TX 78746';
Using this location information, we make a call to the Distance Matrix service:
function calculateDistances() {
  // Create a new Distance Matrix Service object
  var service = new google.maps.DistanceMatrixService();
  
  // Set the options such as the pre-defined origin
  // and destinations, as well as specifying to use
  // duration in traffic
  
  service.getDistanceMatrix({
      origins: [customerLocation],
      destinations: [store1, store2, store3],
      travelMode: google.maps.TravelMode.DRIVING,
      unitSystem: google.maps.UnitSystem.IMPERIAL,
      avoidHighways: false,
      avoidTolls: false,
      durationInTraffic: true
  }, callback);
} 
   
function callback(response, status) {
  if (status != google.maps.DistanceMatrixStatus.OK) {
    console.log('DistanceMatrix Error: ', status);
  } else {
    // Get the arrays of origins and destinations
    var origins = response.originAddresses;
    var destinations = response.destinationAddresses;
    
    for (var i = 0; i < origins.length; i++) {
      // For each of the origins, get the results of the 
      // distance and duration of the destinations
      var results = response.rows[i].elements;
      for (var j = 0; j < results.length; j++) {
    // Store the results for later sorting
   storeResults.push([destinations[j],
       results[j].duration_in_traffic.value,
                  results[j].distance.value]);
      }
    }
    // Sort the results by duration in traffic
     storeResults.sort(function(a, b) {
           return a[1] - b[1];
         }); 
  }
}
The call returns the following data, which includes the critical information of driving distances, duration, and duration in traffic:
destination_addresses" : [
      "3808 West 35th Street, Austin, TX 78703, USA",
      "4933 Plaza on the Lake, Austin, TX 78746, USA",
      "6500 Bee Cave Road, Austin, TX 78746, USA"
   ],
   "origin_addresses" : [ "1903 Toro Canyon Road, Austin, TX 78746, USA" ],
   "rows" : [
      {
         "elements" : [
            {
               "distance" : {
                  "text" : "5.4 mi",
                  "value" : 8631
               },
               "duration" : {
                  "text" : "15 mins",
                  "value" : 917
               },
               "duration_in_traffic" : {
                  "text" : "20 mins",
                  "value" : 1188
               },
               "status" : "OK"
            },
            {
               "distance" : {
                  "text" : "4.4 mi",
                  "value" : 7157
               },
               "duration" : {
                  "text" : "9 mins",
                  "value" : 569
               },
               "duration_in_traffic" : {
                  "text" : "15 mins",
                  "value" : 911
               },
               "status" : "OK"
            },
            {
               "distance" : {
                  "text" : "4.7 mi",
                  "value" : 7490
               },
               "duration" : {
                  "text" : "11 mins",
                  "value" : 635
               },
               "duration_in_traffic" : {
                  "text" : "11 mins",
                  "value" : 635
               },
               "status" : "OK"
            }
         ]
      }
With this data, customers can sort the store results according to their preferences and make better decisions about which store to visit.

We hope you’re able to take advantage of some of these features in your website or application. For more details on implementing the Google Maps Javascript API Distance Matrix service, visit our developer documentation and review our available code samples. You can also find out more about the Distance Matrix API, part of our Google Maps Web Services APIs.

Always-on Android Wear apps with the Google Maps API


Some Android Wear apps are most useful when they are always available to the user, even at a glance. Now, with Google Play Services 8.1, the Google Maps Android API supports ambient mode, the API that provides always-on capabilities. In ambient mode, the map adjusts its style to provide a simplified, low-color rendering of the map. All markers, objects, and UI controls disappear, keeping the map on the screen while letting the user know that it is not currently ready to accept user input. An important advantage is the camera position and zoom level are retained, thus keeping the user’s context within the map.

The screenshot below show how maps appear in interactive mode and in ambient mode:

To implement ambient mode in your maps, follow these steps:

  1. Set your your targetSDKVersion to 22 or higher
  2. Add the following dependencies to build.gradle for your app to add the wearable support library.
  3. dependencies {
    compile 'com.google.android.support:wearable:1.2.0'
    provided 'com.google.android.wearable:wearable:1.0.0'
    }
    
  4. Add the wearable shared library entry into the wearable app manifest:
  5. <application>
    <uses-library android:name="com.google.android.wearable"
    android:required="false" />
    ...
    </application>
  6. Add the WAKE_LOCK permission to the handheld and wearable app manifest:
  7. <uses-permission android:name="android.permission.WAKE_LOCK" />
  8. Have your Activity extend WearableActivity. This will provide the overrides that notify your app when the wearable enters, exits and provides screen updates in ambient mode.
  9. In the onCreate() method of your activity, call the setAmbientEnabled() method. This tells the framework that the app should enter ambient mode rather than returning to the watch face.
  10. Set your map to support ambient mode. You can do this by setting the attribute map:ambientEnabled="true" in the activity's XML layout file, or programmatically by setting GoogleMapOptions.ambientEnabled(true). This informs the API to pre-load necessary map tiles for ambient mode.
  11. When the activity switches to ambient mode, the system calls the onEnterAmbient() method in your wearable activity. Override onEnterAmbient() and call MapFragment.onEnterAmbient() or MapView.onEnterAmbient(). The map changes to a non-interactive, low-color rendering of the map.
  12. When in ambient mode, your app can update the display every minute by overriding onUpdateAmbient(). If you need more frequent updates, check out this guide.
  13. When the activity leaves ambient mode, the system calls the onExitAmbient() method in your wearable activity. Override onExitAmbient() and call MapFragment.onExitAmbient() or MapView.onExitAmbient(). The map returns to the normal rendering and is now ready to accept user input.

With always-on maps on Android Wear, you can now show maps at a glance. For more information on these APIs check out the documentation and the sample code.

Map Tips: Style maps like a wizard


Editor’s note: ‘Map Tips’ are designed to answer frequently asked questions about Google Maps APIs. For important tips on how to deploy Google’s mapping tools, read more from Ed Boiling, Google Maps Solution Architect at Google.

At Google, we understand that not everyone dreams in the same beautiful shades of orange and yellows of our Google Maps road network or the calm blues of Google Maps waterways. The reality is that our customers might want to make the water purple or their roads green. Sometimes you need a muted map with no labels to overlay your own data, or maybe you want the colors to match the branding of your website.

That’s why we offer Styled Maps. You can create the styles by hand and test your code to see how they look, or use our time saving visual tool — the Google Maps Style Wizard. The Google Maps Style Wizard allows you to select features and their elements, apply operations to those features, and save the styles to JSON, which you can copy and paste into your application.
Styled_map.png

With this simple JSON file, you can tailor that map to your needs—the color scheme of your website, a greyscale map to show details or to highlight a big event.

1. Select a type of feature to style in the Selectors panel. For any element type (e.g. roads, water) you can choose to style the shapes (select “Geometry”) or the text (Select “Labels”), or both. You can show a map of anywhere you wish as a preview.
Screen Shot 2015-09-07 at 11.56.33.png

2. To change the visibility, lightness or color, choose the combination of Stylers that match your needs. For example, to switch off all the map labels, select Feature type “All”, Element type “Labels” and check the box for the “Visibility” styler. Choose “Off” as the option for Visibility. To make all the water purple, select Feature type “water”, Element type “geometry” and select the “fill” option. Fill changes the solid color and stroke changes the line color. In the Stylers section choose the shade you want using the sliders or the hexadecimal value. For purple, either slide R to 204, G to 0 and B to 255 or enter #CC00FF in the text box.
Screen Shot 2015-09-07 at 11.58.19.png

3. Once you are happy with the styling of the feature type, click the Add button in the Map Style panel to save the style and create a new style to work on. Repeat Steps 2 to 5 to build up the set of styles for your map. Styles are applied in the order they are listed in the Map Style panel. To copy the style into your own Maps API map, click the Show JSON button to display the JSON object to pass to the style property of your MapOptions object. To generate an example map with this style using the Static Maps API, click the Static Map button.

4. Select a type of feature to style in the Selectors panel. For any element type (e.g. roads, water) you can choose to style the shapes (select “Geometry”) or the text (Select “Labels”), or both. You can show a map of anywhere you wish as a preview.
Screen Shot 2015-09-07 at 11.56.33.png

5. To change the visibility, lightness or color, choose the combination of Stylers that match your needs. For example, to switch off all the map labels, select Feature type “All”, Element type “Labels” and check the box for the “Visibility” styler. Choose “Off” as the option for Visibility. To make all the water purple, select Feature type “water”, Element type “geometry” and select the “fill” option. Fill changes the solid color and stroke changes the line color. In the Stylers section choose the shade you want using the sliders or the hexadecimal value. For purple, either slide R to 204, G to 0 and B to 255 or enter #CC00FF in the text box.
Screen Shot 2015-09-07 at 11.58.19.png

6. Once you are happy with the styling of the feature type, click the Add button in the Map Style panel to save the style and create a new style to work on. Repeat Steps 2 to 5 to build up the set of styles for your map. Styles are applied in the order they are listed in the Map Style panel. To copy the style into your own Maps API map, click the Show JSON button to display the JSON object to pass to the style property of your MapOptions object. To generate an example map with this style using the Static Maps API, click the Static Map button.

Here’s a complete example for a map with no labels and purple water.

[
  {
    "featureType": "water",
    "elementType": "geometry.fill",
    "stylers": [
      { "color": "#cc00ff" }
    ]
  },{
    "elementType": "labels",
    "stylers": [
      { "visibility": "off" }
    ]
  }
]

This style creates a muted grey scale map with just basic outlines that’s ideal for overlaying a data visualization using one of the many Maps API methods available.

[
  {
    "stylers": [
      { "visibility": "off" }
    ]
  },{
    "featureType": "landscape",
    "stylers": [
      { "visibility": "on" },
      { "color": "#e5e3df" }
    ]
  },{
    "featureType": "water",
    "elementType": "geometry",
    "stylers": [
      { "visibility": "on" },
      { "color": "#d4d4d4" }
    ]
  }
]
Screen Shot 2015-09-07 at 12.01.07.png

We hope you’re able to incorporate the Styled Maps capabilities into your website or application. Start customizing your maps today with the Google Maps Style Wizard. If you need some inspiration, visit our friends at snazzymaps.com to see a gallery of styled maps - you can start from any one of the hundreds of user uploaded Google Maps styles.

Map Tips: Speeding up page load times with the Google Maps JavaScript API


Editor’s note: ‘Map Tips’ are designed to answer frequently asked questions about Google Maps APIs. Since web performance is so hot right now, we want to provide some useful information. For important tips on how to deploy Google’s mapping tools, read more from Mark McDonald, Google Developer Relations. Also, our friends over at Wikipedia have just done something similar!

Asynchronously loading JavaScript on your pages can give you huge performance wins. We have just updated all of our JavaScript Maps API samples and you can make these changes to your site, too. Read on to find out what we did and how it works, or skip straight to Unblocking scripts to see what you can start to update on your site today.

Loading JavaScript 101

There are plenty of great developer resources that describe browser rendering processes in detail, and you should read them all, but right now we’re interested in how <script> tags affect page load time. Here’s a quick refresher.
  1. As a browser loads its stream of HTML content representing the page to render, it builds DOM and CSSOM trees representing the page structure and style, respectively.
  2. JavaScript can change both the DOM and the CSSOM, for example through document.createElement() and myElement.style.backgroundColor.
  3. Ergo, when the browser hits a <script> tag, either in-line or externally hosted, it has to pause any further processing of the script and any further HTML rendering until the script has been fetched and any CSS declared prior has been fetched and processed. Take note—this is critical as it affects the speed at which the first round of content is displayed in the browser.
Ilya Grigorik has written on this topic in detail, so check out his article on asynchronously loading JavaScript to find out more.

Unblocking scripts

The first change we made to our samples was to add the async and defer attributes to the script tag:

<script src="https://maps.googleapis.com/maps/api/js" async defer></script>

The async attribute instructs the browser to fetch the script asynchronously, then execute the script as soon as it is retrieved, removing both the block on DOM construction and the wait for CSSOM construction.

The defer attribute is an older, more supported attribute that instructs the browser to execute the script when the DOM is ready. We’ve included it because the async attribute is not supported in all browsers (specifically, older versions of Internet Explorer). In older browsers (as far back as Internet Explorer 5.5), defer still speeds up the page load, so it’s worth including even though it’s ignored in newer browsers when async is present.

The WHATWG spec explains the behavior:

There are three possible modes that can be selected using these attributes. If the async attribute is present, then the script will be executed as soon as it is available, but without blocking further parsing of the page. If the async attribute is not present but the defer attribute is present, then the script is executed when the page has finished parsing. If neither attribute is present, then the script is fetched and executed immediately, before the user agent continues parsing the page.

The second change we made to our samples was to move the map initialization code from the window’s onLoad event to use a callback. So this code:
<script src="https://maps.googleapis.com/maps/api/js"></script>
...
<script>
function initMap() {
  var map = new google.maps.Map(document.getElementById('map'), {
    center: {lat: -34.397, lng: 150.644},
    zoom: 8
  });
}
google.maps.event.addDomListener(window, 'load', initMap);
</script>

Now looks like:
<script>
function initMap() {
  var map = new google.maps.Map(document.getElementById('map'), {
    center: {lat: -34.397, lng: 150.644},
    zoom: 8
  });
}
</script>
<script src="https://maps.googleapis.com/maps/api/js?callback=initMap" 
async defer></script>

This change allows the Maps API code (which now executes as soon as it has been fetched) to run the map initialization code as soon as it can. We’ve also moved the <script> tag after the custom code, to avoid a race condition where the Maps API code could load before initMap is declared.

When implementing this, you should also ensure that any DOM objects you need (particularly the map) are going to be available when your code is called, which could be before DOMContentLoaded fires. For simple inline scripts, you can guarantee this by putting the script after the element in the page.

The numbers

Here are the before & after screenshots of the waterfall from Chrome DevTools. The first image shows the old technique, without async/defer or any callbacks. In addition to the code above, the test code logs window.performance.now() at the end of initMap, which is used to calculate the point at which you can start making map customizations.

Before:
DOMContentLoaded is triggered at ~600ms (658ms in the screenshot below) and map customizations can begin around 700 - 1000ms.
sync.png

After:
DOMContentLoaded is triggered at 35ms and map customizations can begin at around 300 - 500ms.
async.png

I can use this everywhere, right?

Alas, no. As the script tags are no longer synchronously loading in a predictable order, any code using the google.maps namespace needs to run within the callback or sometime afterwards.

To work around this constraint, you can either fall back to loading the API synchronously or mix in your code with the parent class once it’s available. If you choose to load it synchronously, you can still move the <script> tag to the end of the <body> section so your page renders quickly.

There are 2 particular cases you should look out for:
  • Subclassing anything in the Google Maps JavaScript API (for example, custom overlays). You must ensure your classes are defined after the callback has been executed.
  • LatLngs defined outside of the map initialization function. Most functions now accept LatLngLiterals, so you can simply pass { lat: 33, lng: 151 }.

Updating your own code

This optimization applies beyond just the Maps APIs and you should check your own sites too. After you’ve updated your Maps APIs code, look for externally loaded scripts and determine if your code needs to be executed at the point at which it has been defined. If not, add a callback mechanism and the async/defer attributes.

While you’re there, many popular JavaScript libraries support (in fact, encourage) use of the async attribute. You can find out which ones using the PageSpeed tool.

We hope you can squeeze even a few extra milliseconds of performance out of your page loads. Remember that performance is a feature!

Maps Zen — Not lost


Editor's Note: Gone are the days when users were impressed with a marker on a map. The Maps Zen blog post series covers integrations of Google Maps APIs to help your apps provide great maps user experiences. What’s a zen pattern? Simply put, a design pattern that results in harmonious user experiences.


Maps are awesome because they show us where to go. But how are your users getting to their chosen destination? The Directions API web service provides step-by-step directions from point A to B and can get your user where they’re going. Being a web service, it is protected by an API key and thus it should not consumed in the mobile app - proxy it via your server as shown here.

The Directions API can give you walking, cycling and driving directions as expected. But it also gives great public transport directions. When guiding users to a destination, it’s best to show them the path on a map.

Polylines are a great way to show a path but rather than have them simply appear on the map, it’s nicer to animate them in place. In the image below, the intended path grows providing a clear distinction about the direction of travel.

So now we’re showing users where to go and how to get there. But once they’re at their destination, our app’s work is not done. In Shibuya, a city in Tokyo, Japan, there are many tall buildings whose shops visible from the road. It can be really hard to tell which one of those is the destination. In effect, users can be left feeling lost after they get to their destination. Thankfully, there’s a Maps API for that!

Street View is a great way to visualize the user’s destination, or any address really. Adding Street View adds a real-world visual element to your app and provides meaningful context for users. Users will generally expect that they can interact with a Street View since they’re likely to pan and scan around the location so be sure to leave not to disable interactivity with the StreetViewPanorama.

You can add a StreetViewPanorama into your app by including it in your XML layouts, like so.
<fragment
    android:id="@+id/streetview"
    android:name=
        "com.google.android.gms.maps.StreetViewPanoramaFragment"
    android:layout_width="match_parent"
    android:layout_height="match_parent"/>

You can provide a location for the StreetViewPanorama using the following Java code.
streetViewPanorama.setPosition(targetLatLng);
StreetViewPanoramaCamera camera =
    new StreetViewPanoramaCamera(zoom, tilt, bearing);
mStreetViewPanorama.animateTo(camera, duration);

With guided directions and the addition of Street View in your apps, users are given a visual representation of their destination. They’re no longer lost on the way there and they’re not lost when they get there.

New Controls Style for the Google Maps JavaScript API

Controls are UI elements that allow your users to interact with a map. Whether they are moving Pegman to see Street View or switching between map and satellite modes, people use the controls to explore and get the information they need from a map.

The Google Maps JavaScript API has a range of options that let developers customize controls by changing their visibility, positioning, styling and behavior. Control options give developers a lot of flexibility to change the way controls work on their maps.

Today, we are rolling out an update to the Google Maps JavaScript API default controls. The updated controls have a more modern look and feel and are more consistent with other Google Maps products, including the Google Maps Embed API and the Google Maps website. Most features of the new control style have already been available to signed-in maps, but today we are excited to make the new control style available by default to all maps, not just those with signed-in mode enabled.

This API update changes the position, color and size of many of the controls, as well as the functionality of a few controls. For example, the zoom control feature is now on the bottom right instead of the top left, with only “+” and “-” buttons instead of a slider. In addition, some controls and control options are no longer available in v3.22 of the API (the current experimental version). The Google logo has also been updated to the new version.

Old
New
Screen Shot 2015-08-25 at 7.33.31 AM.png

You can temporarily switch back to the old control style in API versions 3.22 (current experimental version) and 3.23 (experimental version from November 2015). In versions 3.22 and 3.23, the old control style can be obtained setting a single parameter, google.maps.controlsStyle = 'azteca', before you initialize the map. This parameter will be available until August 2016, giving you ample time to make any required updates to your application. In version 3.24 (experimental version from February 2016), this parameter will be removed. If you are using custom controls or UI elements that overlap the map, we recommend that you test your application with the new controls style and make any updates well before August 2016. The new logo is the only change that affects all API versions and cannot be removed.

For full details of how individual controls will be affected, as well as how to revert to the old controls style, please refer to our developer documentation. You can also visit the Maps API versioning guide for details of how Maps API versions work, how to check which API version you are using, and other best practices for developers.

Posted by Elena Kelareva, Product Manager, Google Maps APIs