Tag Archives: Geo

abbyputinski.com — Google Maps with a twist

We love the teamwork behind AbbyPutinski.com, designed by San Francisco illustrator Abby Putinski, and developed by her husband Adam. In this guest blog post, Adam will walk us through how he worked with Abby to give the map a unique, illustrated look, as well as fun-to-use animations.

Abby is a designer and illustrator living in San Francisco. In building her site, Abby wanted to take users on a journey to discover and explore some of her favorite places in San Francisco, in a way that reflected her illustration style. Taking Abby’s design direction into account, I began building the site, working with the Google Maps API to make the visual experience come to life for visitors of the site. The app is powered by Ember.js, so the application template includes a helper to render a MapView. Custom Overlays are used to take users on a journey around San Francisco.


Designing in Reverse 
To make the map feel like an illustration, Abby used the Styled Maps Wizard to play with colors of the map. By using very few colors and disabling most of the roads and landmarks, she was able to give the map a flat, simple look. After exporting the JSON from the Styled Maps Wizard, Abby worked with screenshots of the map to design the rest of the experience.

 
Some of Abby’s favorite landmarks in San Francisco


The animated GIF in situ on the map as a custom overlay.

Defining a custom overlay 
To create a fullscreen overlay, the bounds are set to the Southwest and Northeast corners.


Positioning the overlay on the map 
The MapView has two child views. The DOM element for a custom overlay actually needs to reside inside the markup generated by Google Maps, but the overlay is an Ember.View so the MapOverlayView is actually rendered as a sibling of the MapCanvas and then moved into the correct spot later.


Keep the overlay centered while panning 
The default behavior for a custom overlay is to re-calculate the styles when the map is panned, but to build an overlay that stays centered on the map, the overlay should only be drawn once and then pan with the map.


Creating the overlay 
Finally, once the overlay has been created and rendered, resolve a promise letting the application know the map is ready.


Final Thoughts 
This project was extremely fun and was successful due to the collaboration between design and development. The Google Maps API gave us the creative freedom to completely customize the map, while Custom Overlays really pulled the experience together.

Posted by Monica Tran, Google Maps API Marketing

Adam and Abby Putinski are a husband and wife design/dev team located in San Francisco. Learn more about their work at abbyputinski.com

Visualizing Airport Delay Correlations with Google BigQuery and the Maps API

Author Photo
Last week Felipe and Michael from the Google Cloud Platform Developer Relations team released a video demonstrating the new Pearson correlation analysis available in Google BigQuery. Their example used more than 70 million flight records to find correlations on departure times, which could be used to predict whether your plane would be late. Specifically, you can find out which set of airports best predict your airport’s possible flight delays the following day.

As you can see from their code (watch the video for context), they’re using iPython Notebook to work with the BigQuery results, and matplotlib to get a quick visual of results. But one aspect that’s hard to see in these results is the spatial relationship of the airports. Maps to the rescue!

My goal was to create a simple visualization, where selecting any airport would highlight which airports you should look at to predict delays the next day. Using the Google Maps JavaScript API I went ahead and did just that:


To create this map, using the same code noted above, we first created a JSON dump of the correlations on departure time for each airport to each other airport. Then, using an article on visualizing earthquakes as a template, I modified the code so that we have a simple dictionary of all airports, keyed by their airport id. Last but not least, I added a function that gets called when an airport marker is clicked in order to restyle all the other airport markers according to their correlation. This method checks the selected season (winter, for example, has different correlations than spring), and highlights correlated markers by setting the color and scale of the circle symbol.


Thanks to BigQuery, running complex correlations over billions or trillions of attributes is surprisingly easy. But don’t forget if your data does have some spatial component, a quick mapping visual can add some great context to your results.

Posted by Josh Livni Maps Developer Relations Team

Full screen maps and new marker features now available in the Google Maps Mobile APIs

This week we are pleased to announce updates for the Google Maps Android API v2 and the Google Maps SDK for iOS. We’re listening to your feedback, adding features requests that you’ve starred more than 195 times on the issue tracker. This includes cross platform support for map padding, flat markers, and marker rotation, described in the video below:


Full screen maps with map padding
Want to add a translucent Action Bar overlay to your map in Android? Or use a full screen layout in iOS 7? Map padding makes it easy to create full screen maps with custom interface overlays. Google Maps UI controls and attribution will automatically be repositioned in the visible area, and changes to the map camera take padding into account, so you don’t need to do this yourself.


Full screen layout maps are more immersive on Android (left) and iOS 7 (right).

Give your markers a sense of direction
We’ve added a marker rotation property, to allow you to rotate a marker around it’s anchor point. The new flat property allows you make the marker lie flat on the map surface, rather than popping out to face the camera. These two new properties are especially useful for indicating compass directions when the map is rotated or tilted.

Marker animations come to iOS
Time to make your markers move! There are a few ways to animate markers on Android, and today we’re adding the ability to animate marker position and rotation on iOS using the Core Animation framework. Animation for these properties happens automatically, but this can be customized if you’d like something a little different, or turned off entirely. You can also animate the icon of your marker using the existing images and duration properties of UIImage.


Playback GPS routes using flat markers (left), or use animated marker icons (right, iOS only).

Platform specific updates
The latest version of the Google Maps SDK for iOS now officially supports iOS version 6 and above, adding support for iOS 7, and removing support for iOS 5.1. Those of you running maps on mathematically intensive applications will be glad to know we have added ARMv7s support (and we’re investigating ARMv8 as well). For the the full list of new features and bug fixes see the Android and iOS release notes.

We’re rapidly adding new features, so if you had your fingers and toes crossed for a feature that isn’t in this release, please let us know on the issue tracker. Lastly, if you have any technical questions that aren’t answered in the developer documentation, post them to the Google Maps Developer Community on Stack Overflow.

Sun Surveyor shines with Street View

In this guest blog post, we hear from Adam Ratana, a hobbyist photographer and software engineer by day, and developer of the Android and iOS Sun Surveyor apps by night. In this tutorial, Adam talks about his creative implementation of custom polylines on Street View panoramas in the Google Maps SDK for iOS.

 As a photography enthusiast, I’m always looking to capture images at the magic hour. My goal when creating Sun Surveyor was to give users an immersive way of visualizing the location of the sun and the moon, making it easy for anyone to figure out when the natural lighting is just right for the perfect shot.

When I set out to build Sun Surveyor, I knew I wanted to give users an easy way of visualizing the location of the sun and the moon. Sun Surveyor has an augmented reality (AR) feature, which overlays sun and moon paths on top of the device camera’s view. This is useful for understanding how light will change over time at a particular location. While I also created a Map View to show the paths on a Google Map for remote locations, it was not as intuitive as augmented reality.

Visualizing the sun and moon paths in augmented reality and map views

When Street View launched in the Google Maps SDK for iOS in v1.4.0 (July, 2013), I couldn’t wait to visualize the sun and moon paths within an interactive panorama. Street View panoramas bridge the gap between Sun Surveyor’s Map View and AR experiences by giving users an augmented reality experience, wherever they want to go.

Sun and moon paths with Street View panoramas

Implementing a sun path Overlay on Street View
I took a creative approach to working with the Google Maps SDK for iOs.  While polylines can be implemented in Map View, this isn’t yet possible in a Street View panorama. To display paths and other items that move with the Street View panorama, I needed to:
  1. Create an overlay on top of the panorama upon which to draw the items
  2. Synchronize the positions of the overlay items with the panorama as it moves
  3. Determine which data are visible and where on the screen to draw them
For this tutorial, I have provided a sample project that will get anyone started doing the same. Let’s walk through the steps.

I. Creating an Overlay

In our main UIViewController, we add a subclass of UIView for the overlay, make its background color transparent, and place the GMSPanoramaView below it in the view hierarchy.


Representing Overlay Items
We represent the overlay items with a protocol having two methods: updateWithPanoramaView and draw. The updateWithPanoramaView method updates an item’s screen location geometry, while draw draws it to the current graphics context.

We store all items to be drawn in a collection, update their positions based on the panorama position, and draw the collection in our view’s standard drawRect method.

If we want to make sure these items are drawn in a certain order that might change based on the data, we can add z-indexes to them and then sort the collection by z-index after we update them and before drawing.

II. Syncing the Overlay with the Panorama
To make sure this overlay view stays updated as the panorama moves beneath it, we can update the view’s data in an implementation of GMSPanoramaViewDelegate’s didMoveCamera method. We can use a CADisplayLink to ensure the overlay view is redrawn at regular intervals, and use a flag to make sure it is only redrawn when necessary.


Optimization
CoreGraphics can be a bottleneck. [UIBezierPath strokePath] and [NSString drawAtPoint] are expensive as you can see by profiling with Instruments. For performance intensive applications, an alternative is to use OpenGL. Avoiding overdraw is always a good idea, so the first optimization, if needed, is to carefully examine what is being drawn to the screen, and draw only what is necessary.

III. Mapping data to the panorama view
The GMSProjection class has a pointForCoordinate method that returns the screen pixel location for a coordinate on the Map. This is useful for overlaying elements on top of a GMSMapView, and is used in the Sun Surveyor Map View to draw text related to sun and moon paths on top of the Map.

GMSPanoramaView has a similar method, pointForOrientation. This method allows us to query the panorama for a screen pixel location given a GMSOrientation (bearing and pitch tuple) relative to the panorama location, where the camera is stationed, at ground level. This is useful to make sure an item we overlay onto the view remains in the same location relative to the scene, even as the camera moves and the view shifts.

Because the camera has a Field of View that determines what is visible on the screen, some orientations are not visible (such as behind the camera position). pointForOrientation helpfully returns NAN (not a number) for such orientations, so we know the given orientation is not visible.

With sun path data already expressed in terms of orientation relative to the ground level of the viewer, drawing corresponding paths with screen pixel locations is easy. We map our data with pointForOrientation, and draw what is visible by checking the result for NAN.


The sample project uses a panorama of Sydney, Australia, looking west, with a sun path for 12/20/2013.


Bonus: altering the Field of View
Version 1.4.1 of the SDK added support for changing the GMSPanoramaCamera’s field of view (FOV). The field of view determines how much of the scene is visible on a device screen, as well as how much distortion around the edges of the view is present. Smaller values for FOV are the equivalent of having a telephoto lens on a real camera: it brings distant objects closer.


Left: FOV of 60 degrees. Middle: 90 degrees (default). Right: 130 degrees.


Street View Panoramas are awesome and easy
The Street View panorama viewer in the Google Maps SDK for iOS is an example of a great API. The GMSPanoramaView class is simple to understand and use. In the course of a weekend, I was able to deliver a fun, interactive and highly requested feature to Sun Surveyor’s iOS users. I can’t wait to see what people are able to do with this new Street View Panorama feature in my app, and I look forward to seeing all the other implementations that others develop!

Stonehenge, as seen from a Street View panorama in Sun Surveyor


Posted by Monica Tran, Google Maps API

Sun Surveyor visualizes the sun and moon in a variety of ways for photographers, filmmakers, solar industry professionals, architects, homebuyers, gardeners, and anyone needing to predict or understand the movement of the sun and moon.

Adam Ratana is a Carnegie Mellon University graduate living in, and loving, Pittsburgh, PA. He produces dance music as a member of Pittsburgh Track Authority, enjoys photography, traveling with his wife, and writing fun software in his free time. Adam also enjoys attending the Pittsburgh Cocoaheads chapter meetings.

Fab Friday is Animated

Author Photo
It’s been a few weeks since the last Fab Friday post. The team has been hard at work on a couple of new videos for you. Take a look:

First up is The Mobile Experience, a new series where Paul Saxman talks about mobile map design. In this episode, Paul talks about building a smartphone interface for browsing a collection of places on a map that can be browsed one handed.


Paul posted his Google Maps Android API v2 code on GitHub.

Next up, we have an episode of DevBytes: Maphacks on animating markers. Ankur Kotwal and Chris Broadfoot talk about the latest techniques for marker animation on the Google Maps Android API v2.


That’s all for this week, have a great weekend and happy mapping!

Posted by Mano Marks, Maps Developer Relations Team

Building Better Maps in Russia and Hong Kong

When you travel or look at a map of your city, you want it to be as accurate as possible. We do too. That’s why we’re launching our Ground Truth initiative in Hong Kong and parts of Russia (including Moscow, St. Petersburg, Novosibirsk, Yekaterinburg and large areas in the west of the country), so we can build a better map that helps you find what you need and get to where you’re going, quickly and easily. These new, updated maps for Russia and Hong Kong will automatically become part of your maps using our JavaScript, Android, and iOS APIs. Ground Truth enables us to update a country’s map at a faster pace to provide you with an up-to-date map that mirrors the real world as closely as possible. Ground Truth also makes it possible for you to contribute your local knowledge to the map and report any issues you find through the Report a Problem tool, so together we can build a better map.


The updated maps in Russia and Hong Kong now provide detailed walking paths in many well-known parks and landmarks, making navigating easier especially in pedestrian-friendly Hong Kong. For example, we’ve added walking paths to Victoria Park - you can now zig zag across the park as you please.


Russia is rather large, so many people prefer to travel by car. Today’s update is good news for drivers as well, as we’ve made big improvements to our road network. We’ve updated street names, turn restrictions and one-way streets as well as completely new maps in more than 50 towns across Russia. So the next time you drive to the city center for shopping, try out the Google Maps app for Android and iPhone to get there.


If you’d rather adventure by sea, we’ve also added ferry routes, down to the specific harbor of departure. For example, in the updated map of Hong Kong’s Central and Western District below you can see the ferry routes as well as nearby points of interests and transportation options.


The updated map also indicates places of interest more clearly, such as hospitals, national parks, and universities. For example, Moscow State University, Russia’s oldest and largest university, now has more detail with cleaner walking paths, named roads, and labels for different department buildings.


Whether you’re gazing at the awe-inspiring spirals of St. Basil’s Cathedral in Moscow or strolling through the bustling Tsim Sha Tsui Promenade in Hong Kong, Google Maps is here to help you see, explore, and discover the world!


To learn more about Ground Truth, check out this presentation from Google I/O 2013: https://www.youtube.com/watch?v=FsbLEtS0uls

Posted by Kirill Levin, Google Maps Software Engineer

Map of the Week: Orbitz

In today’s guest blog post, we hear from Monika Szymanski and Mike Kelley, of Orbitz' Android engineering team, who recently migrated from version 1 to version 2 of the Google Maps Android API

About Orbitz
Nearly 30% of Orbitz.com hotel bookings are now made via mobile devices, fueled in part by the growth of the Android platform. The recently released 3rd-generation update of the Orbitz - Flights, Hotels, Cars app for Android brings major speed and ease of use improvements along with the latest Android UI design patterns to the app. The Google Maps Android API v2 is also integrated into the hotel search experience. Read on to find out how we did it, with tips and sample code along the way.

Migrating from v1 to v2 of the Google Maps Android API 
While users of the Orbitz.com Android app will notice some changes to the app’s user interface for maps, the changes to our code are more than skin deep. New classes offered in v2 of the Google Maps Android API like MapFragment and SupportMapFragment, the transition from ItemizedOverlays to Markers, and the addition of a well-supported info window pattern have made including a Google Map in an Android app much easier.

Say hello to the 3rd generation of Orbitz - Flights, Hotels, Cars app, using the Google Maps Android API v2

Featuring Fragments 
Prior to the introduction of MapFragment (and SupportMapFragment)  in v2, we had to write a lot of code to manually show/hide the map view in our app. Only one instance of MapView could be created per activity, so we had to be overly clever about persisting that instance in our Activity. Lack of proper Fragment support was a common pain point for developers integrating v1 of the Google Maps Android API in their application.

When Fragment support was added in v2, we essentially rewrote our map code to take advantage of the new features of MapFragment. Let’s start by taking a look at our hotel results Activity layout:

You’ll notice that we’re not including the actual fragment in the layout - we add the Fragment at runtime, because we don’t want to pay the cost of the fragment transaction and add all the markers on the map, unless the user requests it.

You’ll also notice a bit of a hack at the bottom of the layout. In testing, we found that the MapFragment would leave a black box artifact on the screen on certain devices when the user opened our sliding menu navigation. Adding a simple FrameLayout “above” the map seems to fix the problem.

Extending SupportMapFragment makes it much easier to separate the map display logic from our Activity and list fragment. Our SupportMapFragment (and its inner classes) is responsible for:
  • Adding markers representing each available hotel 
  • Customizing the GoogleMap UI options 
  • Centering and animating the map to show the added markers 
  • Showing an info window when a marker is clicked 
  • Launching an Intent to display more details when an info window is clicked 
Next up, we’ll talk about how we add markers to the map and keep memory usage down.

Managing Markers 
One of the challenges in migrating from v1 to v2 of the Google Maps Android API was figuring out the best way to know which hotel’s info to display when a marker is tapped. To solve this, we place each <Marker, Hotel> pair in a HashMap when adding the markers to the Google Map. Later, we can use this HashMap to look up a marker's corresponding hotel info.

The code snippets below illustrate how we do it.


This HashMap allows us to look up the selected hotel in our InfoWindowAdapter, enabling us to display more information about it.


We place quite a few markers on the map for hotel results and each marker can have a different custom image. It's really easy to run out of memory and we were getting quite a few OutOfMemoryExceptions early in development. To manage memory more effectively, we made sure we didn't create a new new Bitmap and BitmapDescriptor for every marker placed on the map. We also ensured that the resources were recycled after we were done with them.


When the user taps a marker, we want to show more information; that’s where info windows come in handy. 

Introducing Info Windows 
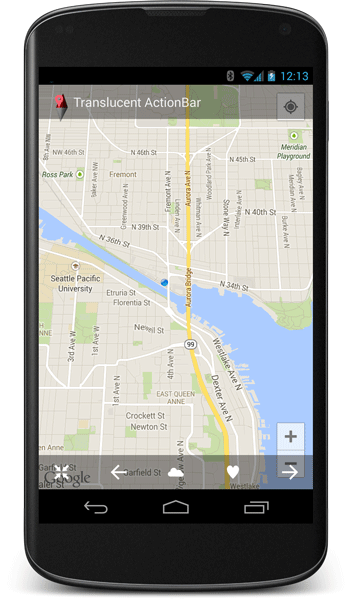
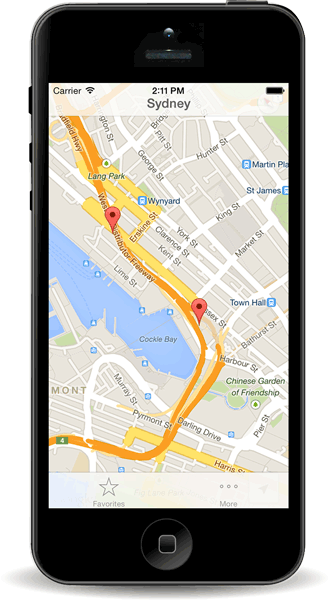
Aside from simply viewing the location of all available hotels on a map, users are typically interested in the name and price of the hotel. The architecture for implementing this information window changed considerably from version 1 to version 2 of the Google Maps Android API. 

Before: Info windows in the Google Maps Android API v1
When using v1 of the Google Maps Android API, our app displayed more detailed hotel information in a custom info view when the user tapped on a hotel marker. That custom view displayed the hotel name and price, and triggered a custom animation when the view was added to the screen. This animation made it appear that the view was growing from inside the pin on the map.

We achieved this effect by setting the LayoutParams to MapView.LayoutParams.BOTTOM_CENTER and MapView.LayoutParams.MODE_MAP, which centered the bottom of the custom view on top of the tapped hotel marker.

With the introduction of the Google Maps Android API v2, MapView.LayoutParams.MODE_MAP was removed, so we explored alternative treatments to show the hotel information when the user clicks on a result. For our purposes, the best alternative was to use the new info window interface. 

After: Info windows in the Google Maps Android API v2
Creating an InfoWindowAdapter is pretty straightforward. The API provides two ways to populate the info window; either by supplying the contents of the info window (shown in the default window stylec) or creating a full View. Because we wanted to have a custom window background, loaded from a 9-patch, we opted to build a complete View for the info window by overriding the getInfoContents() method to return null, and by returning a custom View from getInfoWindow().

Here’s a sample of our code:


We could further simplify this code by having our HotelView take a Hotel model as a parameter in the constructor. 

A caveat with info windows is that even though they are populated by the returned View, the info window is not treated like a *live* View object. The system will call the view’s draw() method only once, then use that cached rendering as the user continues to interact with the map. Our existing animation didn’t work in the Google Maps Android API v2, but we decided to be consistent with the platform and remove the animation rather than try to hack around this limitation.

We <3 Google Maps Android API v2
Upgrading from version 1 to version 2 of the Google Maps Android API was virtually painless and fun to do! The introduction of MapFragment helped us separate the map display logic from the rest of the code and made code reuse much easier. Using custom info views was very straightforward with the new info window interface. We look forward to adding even more Google Map features to our app.

Posted by Monica Tran, Maps Developer Marketing

Monika Szymanski is a Lead Engineer on the Android team at Orbitz, where she works on apps that are friendly, fast, and easy to use. In her free time, she enjoys outdoors, running, red wine, and anything chocolate.

Mike Kelley is a Software Engineer at Orbitz, where he works on Android travel tools to help people travel smarter. He's a Michigan grad, transportation and technology enthusiast and craft beer buff. Some of Mike's ideas and projects live online at theelfismike.com.

Orbitz Worldwide (NYSE: OWW) is a leading global online travel company that uses innovative technology to enable leisure and business travelers to search for, plan and book a broad range of travel products and services including airline tickets, hotels, car rentals, cruises, and vacation packages. Orbitz Worldwide owns a portfolio of consumer brands that includes Orbitz, CheapTickets, ebookers, and HotelClub. Also within the Orbitz Worldwide family, Orbitz Partner Network delivers private label travel solutions to a broad range of partners including many of the world's largest airlines, and Orbitz for Business delivers managed corporate travel solutions for corporations.

Fab Friday Stays Indoors

It’s Friday again, and you’ve survived another week. Time for some mapping!


I’ve got another video for you! Yesterday I released a Google Maps Shortcuts episode on indoor maps in the Google Maps SDK for iOS. Check it out:


I’ve also put together this playlist for iOS Developers using our SDK.


For JavaScript developers, Emily Bennett is doing a series of tutorials on Webdesigntuts+ on using the Google Maps API. Emily is the creator of the Portsmouth History Photo Map which we featured as a Map of the Week. She’s got three tutorials up, and one more on the way. Nice work Emily!


That’s all for this week. Have a great weekend and happy mapping!


Posted by Mano Marks, Maps Developer Relations Team

Interactive Map of the Paris Metro

Interesting Maps API Components used: Geometry Library, KMLLayer, Styled Maps, Polylines, InfoWindows, Symbols, Markers

This week we are featuring a sample app by the French web development house Medusis. They have put together a custom directions application that guides you between Paris metro stations. It is available in both French and English. It is a beautiful app that uses several interesting features of the Maps API, some of which may not be immediately obvious.

The map is centered, naturally, on the city of Paris. The Paris Metro network is shown using a KMLLayer object. That way they can load in a large amount of unchanging data. You’ll also notice that the base map is styled to mute it to emphasize the metro lines, while preserving access to the Google base map data.


To find directions you can either use the drop down boxes in the top left or simply click on the stations. Notice that a couple of things happen. The KMLLayer that loaded the original layers switches to a grayscale KML file, to allow the use of Polylines to emphasize only the routes needed.


Each station also gets an InfoWindow that has the icons of the Metro lines serving that station. Each trip can be made of more than one Metro line. The portion of the line used in a particular trip is highlighted by using a Polyline. Markers for hubs and the origin and destination are highlighted using a Circle Symbol.


The map uses its own algorithm to compute the best route, using our Geometry Library to calculate distances to find the correct route.

This is a great demonstration piece on using the Google Maps API to show custom data. Well done Medusis.

Posted by Mano Marks, Maps Developer Relations Team


Fab Friday is Custom Made

Another week down, and time for another Fab Friday.


First up this week, I’ve got a video for you. Don’t I always have a video for you? The inimitable Brett Morgan filmed another Maps Shortcut episode, Custom Info Windows in the Google Maps SDK for iOS. Check it out:


Next I have a map for you. August 1st was Swiss National Day, and to celebrate, we have a timeline of when the cantons joined the Confederation.


This timeline is brought to us by Vasile Cotovanu, who also created the Swiss Cantons mercator puzzle, and more. And as usual, all his code is over on Github.


Finally, for you do-gooders, there’s a great event coming up. Apply now for the 2013 Geo for Good User Summit:


Calling all mapping specialists who use their powers for environmental and social good! Apply now for this annual hands-on technical workshop hosted by the Google Earth Outreach team from Nov 12-15 at the Google headquarters in Mountain View, CA: http://geoforgood2013.earthoutreach.org


That’s all for this week. Have a great weekend, and happy mapping!


Posted by Mano Marks, Maps Developer Relations Team