I’m a technical writer at Google. In this post I share a project that uses the new Data layer in the Google Maps JavaScript API, with a Google Sheets spreadsheet as a data source and a location search provided by Google Places Autocomplete.
Although this project is about technical communication, you can easily adapt it for other special interest groups too. The code is on GitHub.
The map in action
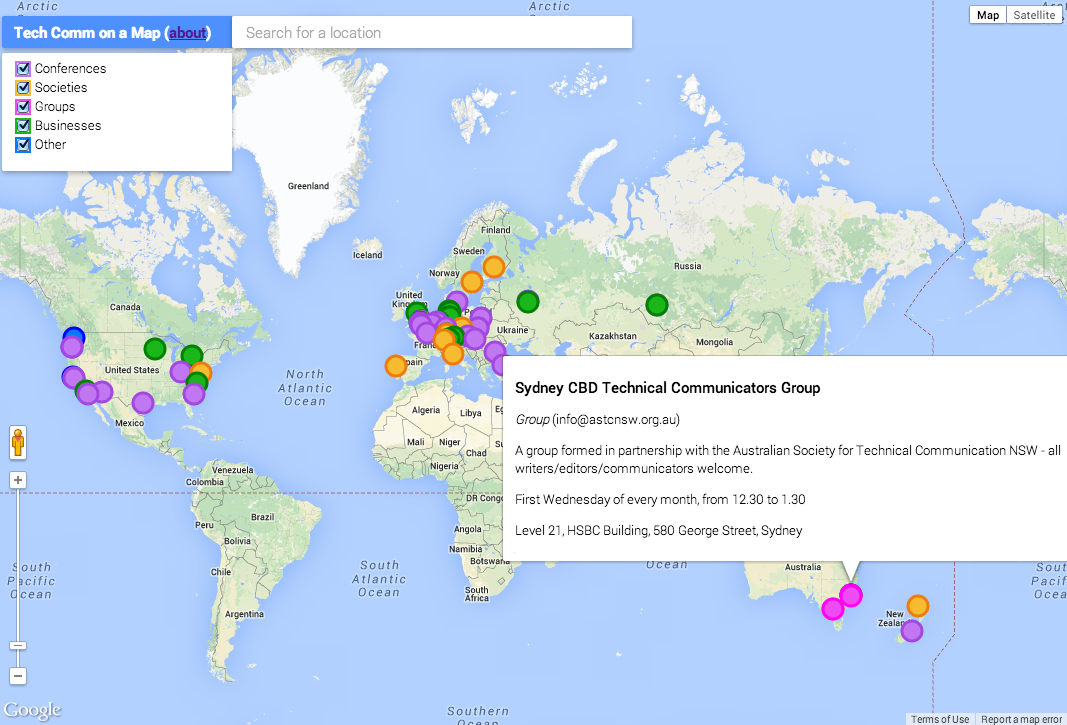
Visit Tech Comm on a Map to see it in action. Here’s a screenshot:
When you hover over a circle, an info window pops up with information about the item you chose. If you click a circle, the map zooms in so that you can see where the event or group is located. You can also search for a specific location, to see what’s happening there.
Let’s look at the building blocks of Tech Comm on a Map.
Getting hold of a map
I'm using the Google Maps JavaScript API to display and interact with a map.
Where does the data come from?
I needed a data entry and storage tool that provided a data entry UI, user management and authorization, so that I didn’t have to code all that myself. In addition, contributors shouldn’t need to learn a new UI or a new syntax in order to add data items to the map. I needed a data entry mechanism that is familiar to most people – a spreadsheet, for example.
In an episode of Google Maps Developer Shortcuts, Paul Saxman shows how to pull data from Google Drive into your JavaScript app. That’s just what I needed. Here’s how it works.
The data for Tech Comm on a Map is in a Google Sheets spreadsheet. It looks something like this:
- In Google Sheets, choose ‘Tools’ > ‘Script Editor’.
- Add a new script as a blank project.
- Insert the above code.
- Choose ‘File’ > ‘Manage Versions’, and name the latest version of the script.
- Choose ‘Publish’ > ‘Deploy as web app’. Make it executable by ‘anyone, even anonymous’. Note: This means anyone will be able to access the data in this spreadsheet via a script.
- Choose ‘Deploy’.
- Copy the URL of the web service. You’ll need to paste it into the JavaScript on your web page.
In your JavaScript, define a variable to contain the URL of the Google Apps script, and add the JSONP callback parameter:
Then use jQuery’s Ajax function to fetch and process the rows of data from the spreadsheet. Each row contains the information for an item: type, item name, description, website, start and end dates, address, latitude and longitude.
The new Data layer in the Maps JavaScript API
Now that I could pull the tech comm information from the spreadsheet into my web page, I needed a way to visualize the data on the map. The new Data layer in the Google Maps JavaScript API is designed for just such a purpose. Notice the method map.data.add() in the above code. This is an instruction to add a feature in the Data layer.
With the basic JavaScript API you can add separate objects to the map, such as a polygon, a marker, or a line. But by using the Data layer, you can define a collection of objects and then manipulate and style them as a group. (The Data layer is also designed to play well with GeoJSON, but we don’t need that aspect of it for this project.)
The tech comm data is represented as a series of features in the Data layer, each with a set of properties (type, name, address, etc) and a geometry (latitude and longitude).
Style the markers on the map, with different colors depending on the data type (conference, society, group, etc):
The Place Autocomplete search
The last piece of the puzzle is to let users search for a specific location on the map, so that they can zoom in and see the events in that location. The location search box on the map is provided by the Place Autocomplete widget from the Google Places API.
What’s next?
Tech Comm on a Map is an ongoing project. We technical communicators are using a map to document our presence in the world!
Posted by Sarah Maddox, Google Developer Relations team.


