Tag Archives: Geo

Maps Zen — Visualize


Editor's Note: Gone are the days when users were impressed with a marker on a map. The Maps Zen blog post series covers integrations of Google Maps APIs to help your apps provide great maps user experiences. What’s a zen pattern? Simply put, a design pattern that results in harmonious user experiences.


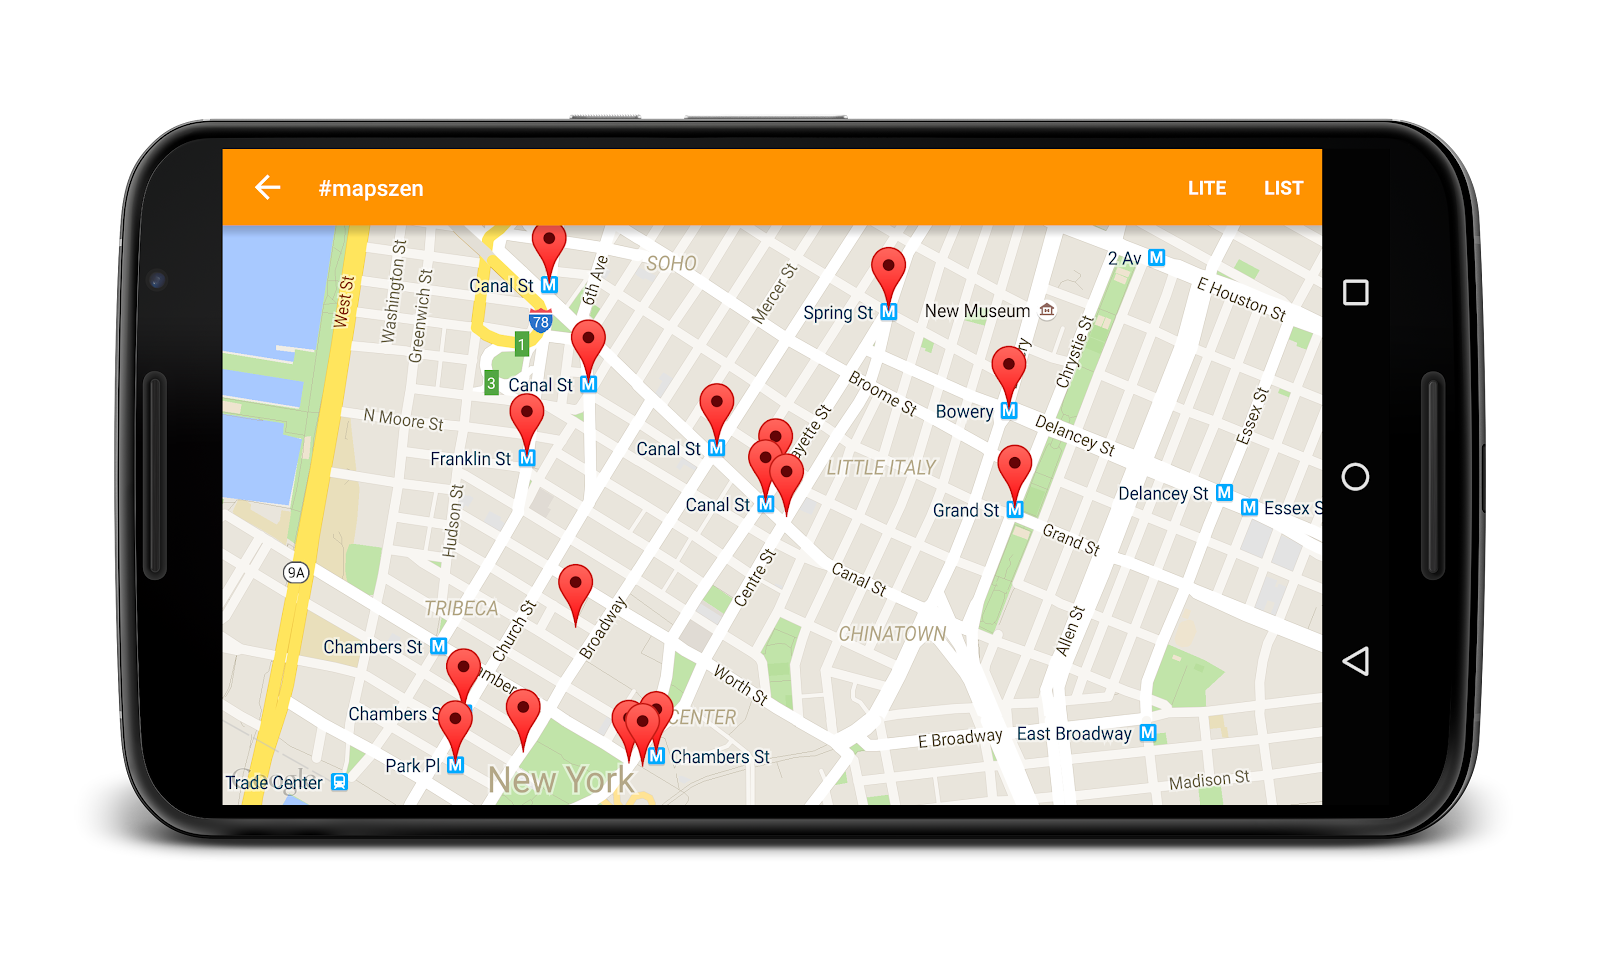
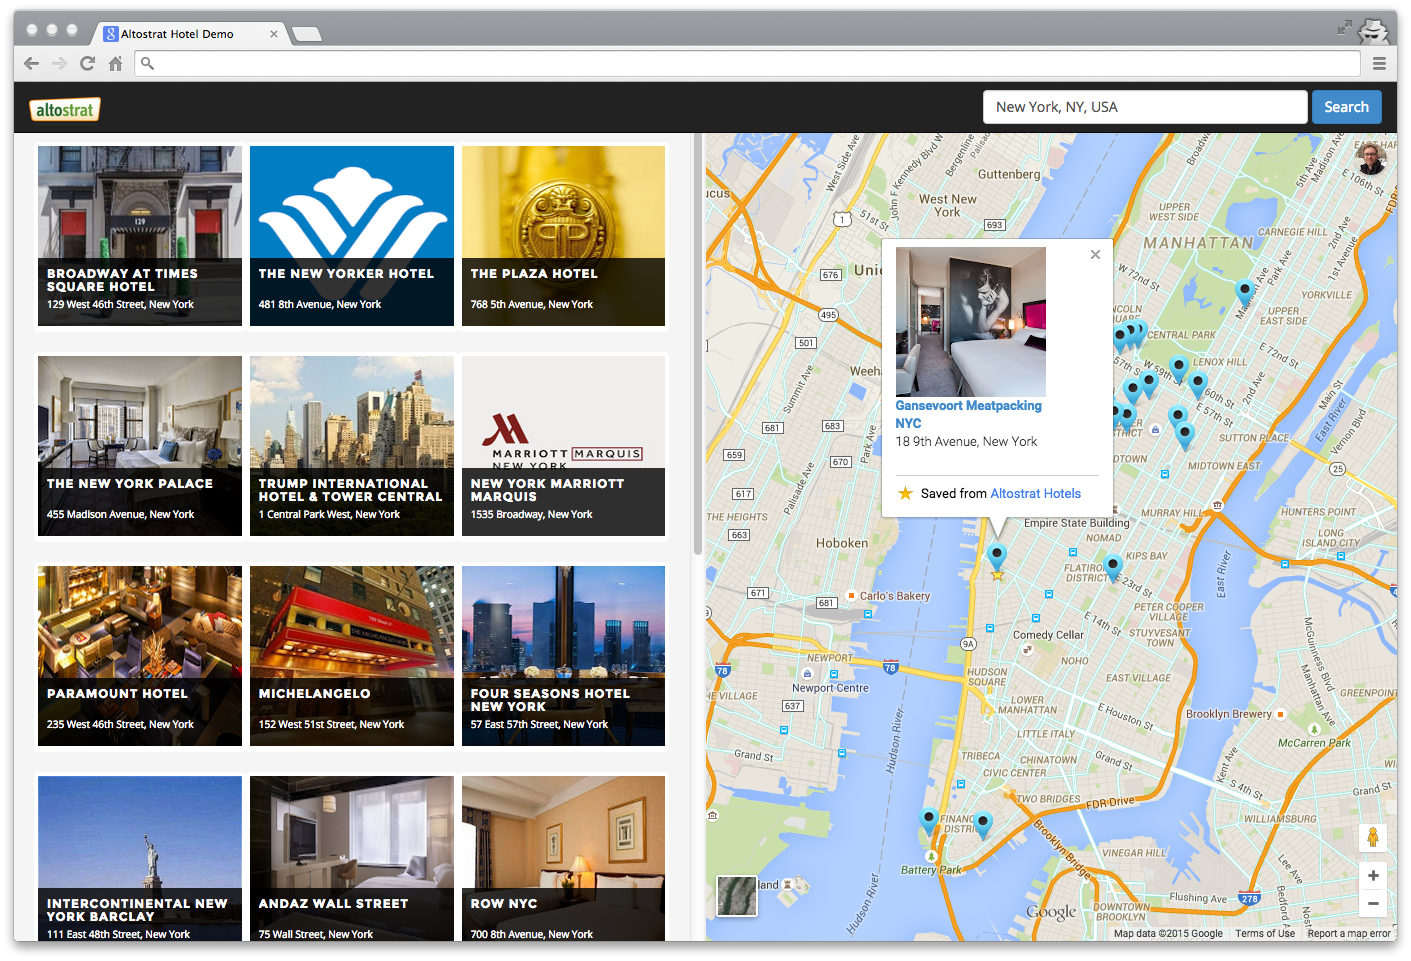
Markers are much more useful than identifying points on a map. Markers can also be used as a way to visually convey information about a place. If a user is searching for a well rated restaurant, they’d fire up your app to find that there’s a bunch of restaurants in their vicinity. But it’s not easy to tell which ones are actually worth visiting. To see the ratings for each place, they’d end up having to tap each one first.

Here’s an how marker selection and marker animations can be a great way to show this information. In this example, markers that lack colour rate poorly and the vibrant colorful markers are the highly rated ones. There’s also animated steam on some markers also helping to highlight the best rated restaurants!

To achieve the steam animation, the marker icon is being changed by calling the setIcon() method periodically. A delay of 32ms roughly corresponds to 30 marker icon updates a second — animating the icon at 30 frames per second.
mAnimHandler.post(new Runnable() {
@Override
public void run() {
marker.setIcon(mSteamFrames.nextFrame());
// Next frame in 32 ms
mAnimHandler.postDelayed(this, 32);
}
});

To desaturate the marker icons, a ColorMatrixColorFilter from the Android framework being used. First, setup the color filter based on the restaurant rating scale via a ColorMatrix. In this case, any restaurant that has a 3 star rating will be presented as having an entirely grayscale icon. Restaurants with a 4.5 star or higher rating will be presented in full color. The restaurant scale is set it to a Paint object and the filter is applied to the marker image using a canvas.
ColorMatrix desatMatrix = new ColorMatrix();
desatMatrix.setSaturation(restaurantRating);

ColorFilter paintColorFilter = new
ColorMatrixColorFilter(desatMatrix);
Paint paint = new Paint();

paint.setColorFilter(paintColorFilter);

Canvas canvas = new Canvas(newImage);
canvas.drawBitmap(oldImage, 0, 0, paint);

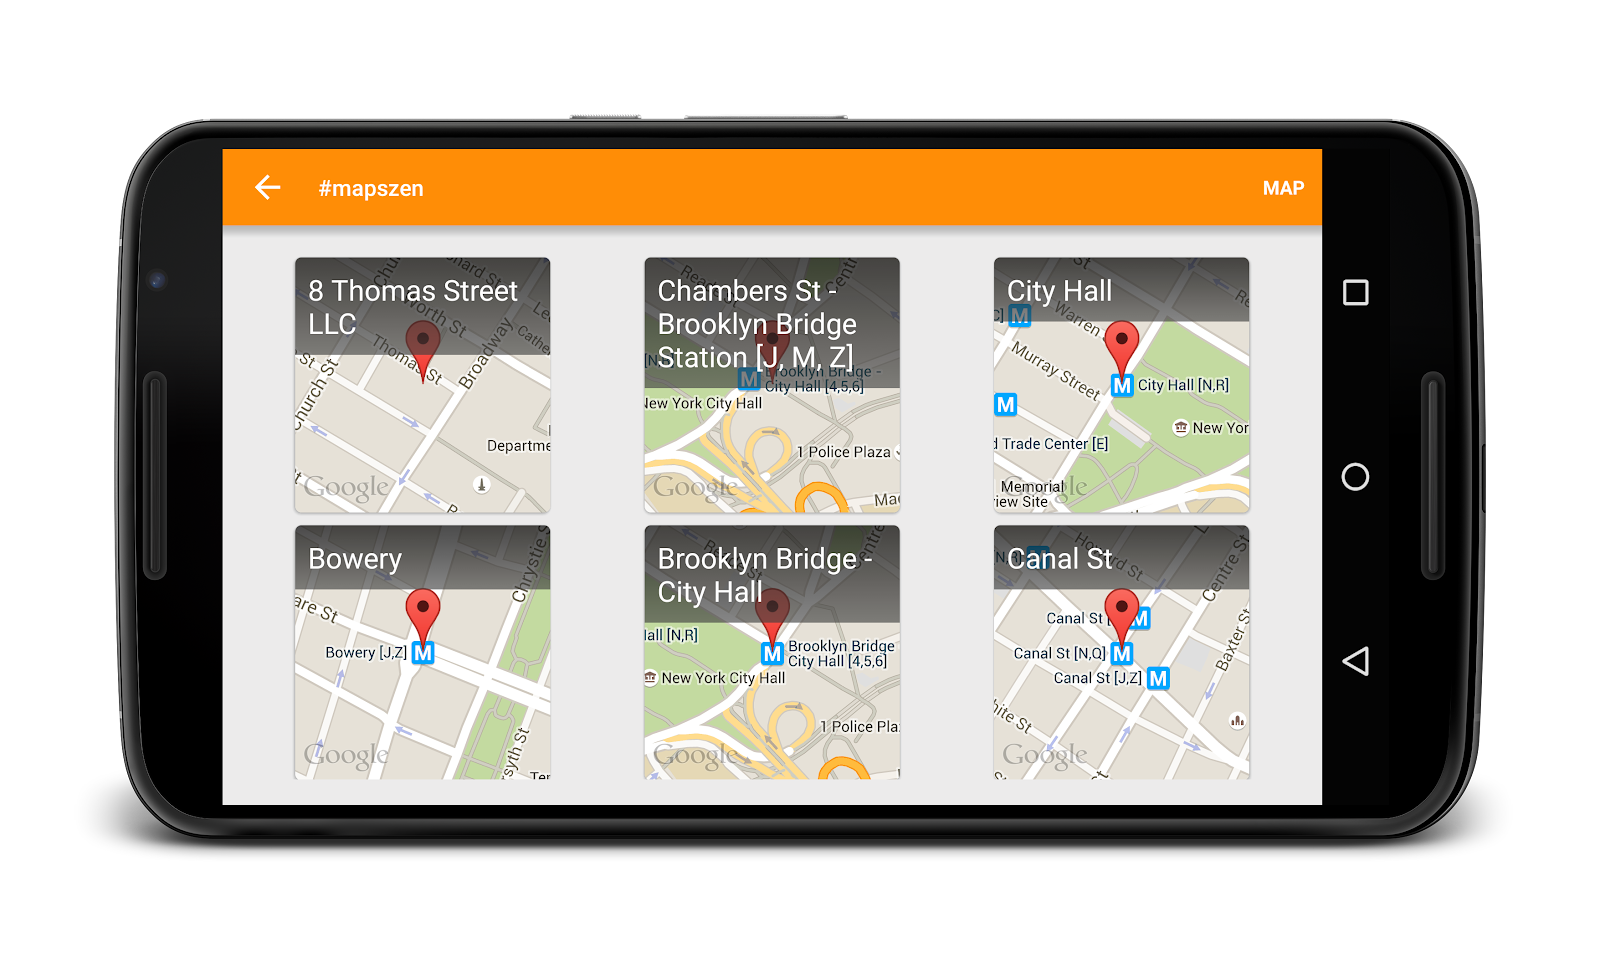
Markers are great for showing points on a map but sometimes you can end up with too many. In this case, we have too well rated many restaurants around us - sure, it’s a nice problem to have but it’s not helping the user choose a restaurant. In such situations, you need to display many markers but still keep the view comprehensible. We’re going to look at two ways to overcome these issues.

The first is through the use of marker clustering. As the zoom levels of the map change, markers are aggregated making for a much more digestible view. Now as the map zooms out, markers will combine, showing how many restaurants are in the surrounding areas.

This visual effect may seem like a lot of work, but it is not. The Android Maps Util library provides a four-step implementation of marker clustering:

1. Add the library to your gradle config.
compile 'com.google.maps.android:android-maps-utils:0.3+'
2. Implement ClusterItem interface in your main data class.
public interface ClusterItem {
LatLng getPosition();
}
3. Instantiate the cluster manager and register it for a couple of map listeners.
mClusterManager = new ClusterManager<>(this, mMap);
mMap.setOnCameraChangeListener(mClusterManager);
mMap.setOnMarkerClickListener(mClusterManager);
4. Replace your marker management code with calls to the cluster manager - the cluster manager will manage adding and removing the markers for you.
mClusterManager.addItem(clusterItem);
5. You can optionally customise the effect further by providing custom aggregate markers (showing images instead of a count for example).

Let’s look at the second method to show marker aggregation - it looks really cool! Here, the count of markers are replaced with a heat map showing the concentration of these markers.

Achieving this effect is also just four simple steps using the Android Maps Utils library, thanks to its heatmaps.

1. Add the library to your gradle config.
compile 'com.google.maps.android:android-maps-utils:0.3+'
2. Instantiate a HeatMapTileProvider and pass it your LatLngs.
mHeatmapTileProvider = new HeatmapTileProvider.Builder()
.data(mLatLngCollection)
.build();
3. Use it to create a map overlay.
mTileOverlay = mMap.addTileOverlay(
new TileOverlayOptions().tileProvider(mHeatmapTileProvider));
4. You can optionally customize this further by specifying the gradient and the radius of the heatmap.

It’s worth keeping in mind that information overload is a common problem with mobile apps. Location apps, in particular suffer from poor user experiences when dealing lots of places. The Android Maps Utils library offers beautiful visualizations enabling you to build amazing maps.

Kocomojo brings beacon technology to marketers with Google Maps APIs


Editor’s note: Today’s guest blogger is Kristan Hamill, CEO of the proximity-based marketing company Kocomojo. Read how Kocomojo uses Google Maps APIs to help businesses build customer loyalty.

Access to real-time location data has opened up new ways to interact with and better understand customers and customer behavior. With the Kocomojo web dashboard and mobile SDK, marketers can create campaigns inside their own applications or third-party apps based on real-time customer locations and behavior. Since geo-targeting is becoming one of the most powerful ways businesses can connect with customers, we partnered with Google Maps Premier Partner Dito to build our Kocomojo proximity-based marketing platform, KocoConnectTM using Google Maps APIs.

Beacons (Bluetooth low energy devices ) broadcast their location to nearby portable electronic devices, allowing smartphones, tablets and other devices to perform actions when in close proximity to beacons. This gives marketers the ability to promote at close proximity in the range of three to fifty feet with accuracy up to three feet. You can read more about beacons on the Google Developers website.

When we combine geofences with beacon technology, marketers can create sophisticated geo-targeted and hyper-local boundaries that trigger campaigns on the mobile phone. These campaigns can direct customer foot traffic and help businesses interact with customers who are near or on premises. And the KocoConnect platform is beacon agnostic, working with iBeacon, Eddystone, and proprietary beacon protocols so that marketers using it have options when selecting beacon hardware.
Kocomojo screenshot map.png

The Google Maps JavaScript API allows us to insert maps into our Web dashboard, so clients can instantly visualize their data and make informed decisions. With the Kocomojo analytics tools, marketers can measure engagement rates, user preference on A / B tests, and promotion performance over time or within any particular boundary, making adjustments to campaign strategy as needed. People intuitively know how to use Google Maps, so they can quickly focus on the work that needs to be done rather than spend time learning a new interface.

The Google Maps Geocoding API and the Google Maps Drawing Layer let our clients draw a boundary around their stores to define the area in which they want to make offers to nearby customers. The same approach can be applied to building campaigns in remote areas, giving clients the flexibility to send targeted messaging to select neighborhoods and demographics.

When their customers are inside those boundaries, they’ll receive an offer or message on their phones. The boundary can be as small as a quarter mile or as wide as ten miles. The offers don’t have to be just for special sales — companies can also use them to build brand loyalty, for example, offering rewards for visiting a store a certain number of times or promoting an exclusive event.

When building proximity marketing campaigns in iOS and Android, we use the Google Maps Geocoding API Web Service. For iOS, we use the Google Maps SDK for iOS, and Android uses the Google Maps Android API.
Kokomojo_2.png

With the Google Maps APIs, we’re just starting to scratch the surface of what proximity-based marketing will eventually do. But even today, the results are phenomenal. Proximity-based marketing delivers a 60 percent engagement rate, which means that people respond to 60 percent of offers sent to them. That’s extraordinarily high. While that number may drop over time — new technologies often have the highest engagement rates when they’re first introduced — it’s clear that marketing that incorporates user’s location is here to stay, with benefits for both consumers and businesses.

Introducing a more flexible option to purchase the Google Maps Web Service APIs


The Google Maps Web Service APIs offer a powerful toolkit for the real world - including geocoding, directions, elevation for any point on earth, and snapping GPS crumbs to the road network.

Today we’re introducing a simple and flexible option for developers to instantly and easily scale with these Web Service APIs, by opening them up to pay-as-you-go purchasing via the Google Developers Console. In this new purchasing structure, the Google Maps Geocoding, Directions, Distance Matrix, Roads, Geolocation, Elevation, and Time Zone APIs remain free of charge for the first 2,500 requests per day, and developers may now simply pay $0.50 USD per 1,000 additional requests up to 100,000 requests per API per day. Developers requiring over 100,000 requests per day should contact us to purchase a premium licence.

To get started, head over to our updated Google Maps APIs developer site to check out the APIs, get a key, and provide your billing details to enable the higher limits.

Lastly, alongside this change we’ve updated our Google Maps/Earth APIs Terms of Service to include a section on payment terms as well as some clarifications to the deprecation policy, turn-by-turn navigation restrictions and derivative data sets.

Enjoy!

Maps Zen — Framing your shots


Gone are the days when users were impressed with a marker on a map. The Maps Zen blog post series covers integrations of Google Maps APIs to help your apps provide great maps user experiences. What’s a zen pattern? Simply put, a design pattern that results in harmonious user experiences.


Movie & television directors have fascinating jobs — shooting movies seems like a lot of fun, right? The idea that you’re in control of the camera, framing each shot and creating an evocative scene can be really inspirational. Maps developers have the same creative direction over UI. We get to build maps scenes to create evocative user experiences.

The Maps API provides a sophisticated camera, which enables you to frame your maps in three dimensions. Its has expected capabilities such as projections, zooming and panning but additionally you can rotate, tilt and animate the camera. With that in mind, here’s a map — one that you’ve seen many times before. It’s top down, displaying a certain region, at a pre-determined zoom level.

Lets take that same location and adjust its bearing and tilt. This feels like much more like a real place. The user feels a greater sense of depth; a feeling that there’s a bigger world out there.

When directing the camera for something like a house hunting app, the map can be presented in a way that shows more of the surrounding area. First, the map type has been changed to satellite mode and as a result, the nearby beach is more impactful.

As we select the next house in the search results, the camera animates to its next location and during this journey, we’re effectively flying over the area retaining location context. There are also changes to the zoom, bearing and tilt. Once again, the user gets a strong sense of depth and a feeling of exploration. This is crucial in a house hunting scenario since it’s all about location!

To accomplish such camera angles, check out the bearing and tilt methods on the CameraPosition builder. When transitioning from one CameraPosition to another, you’ll achieve a greater impact if you animate it to place rather that instantly moving there — to do this, use the animateCamera method on the GoogleMap object.
CameraPosition.Builder
target(LatLng location)
zoom(float zoom)
bearing(float bearing)
tilt(float tilt)

map.AnimateCamera(
CameraUpdate.newCameraPosition(cameraPosition),
durationInMs,
callback);

Camera framing and animations are powerful tools. As a camera director, it's important frame your shot in order to evoke the desired emotion.

Maps Zen — Seeing the Lite


Gone are the days when users were impressed with a marker on a map. This is the first in a series of Maps Zen blog posts covering integrations of Google Maps APIs to help your apps provide great maps user experiences. What’s a zen pattern? Simply put, a design pattern that results in harmonious user experiences.

A common UI pattern is showing a collection of places. At first glance it seems pretty easy. You could just throw together a list of place names and you’re done, right? Its not quite that simple. Here are two ways to visualize locations using the Google Maps Android API.

First is on the map itself. Here, we remove the UI and let the map markers be the primary point of interaction. This makes for a very immersive experience, however it's only effective if the markers fit comfortably on one screen. If the user has to zoom or scroll, the emphasis of your collection is lost. For example, “Train stations near me” works well since the results are co-located.

The second method of displaying a list of places that are spread out —it uses map thumbnails. The Maps Android API offers Lite mode — an ideal mode for such scenarios.

Lite mode provides a static map; effectively just the image of a map without the ability for the user to pan, or tilt the camera. This limited functionality, however, comes with some big benefits — it’s super fast and uses less memory. Additionally, you still get click listeners, markers and polylines. Lite mode makes it possible to show lists of maps — they are just images so you can instantiate many of these.

Enabling Lite mode is simple. If you’re creating your maps in Java, on creation, simply specify litemode in the GoogleMapOptions object as shown below.
GoogleMapOptions options = new GoogleMapOptions().liteMode(true);
If your map is declared via layouts, add the xml property in your layouts as shown below. Be sure to include the map namespace since it makes the litemode attribute available.
<fragment xmlns:android="http://schemas.android.com/apk/res/android"
    xmlns:map="http://schemas.android.com/apk/res-auto"
    android:name="com.google.android.gms.maps.MapFragment"
    android:id="@+id/map"
    android:layout_width="match_parent"
    android:layout_height="match_parent"
    map:liteMode="true"/>
At some point, you may need to replace the lite mode map with the fully-interactive one. In that situation, you can gracefully transition into a regular map triggered by a touch event. In the image below, Android Lollipop transitions are being used across screens. You can see the big map dissolve and the grid implode in place. For users on older versions of Android, a reasonable fallback is to instantiate a MapFragment and animate it into place.

With this technique, we’re able to mix and match Lite mode and regular maps seamlessly. I hope you’ve now seen the lite — Lite mode that is. It enables you to show multiple maps simultaneously whilst keeping your app performant.

Maps data and Google Maps APIs enable a new approach to agriculture


Antoine Beyeler, a computer programmer in Switzerland, took inspiration from insects to develop drones that sense obstacles as they fly autonomously. He’s now chief technology officer of SenseFly, which develops drone software that farmers, miners, and other industrial clients use to produce 3D maps.

Chris Seifert, a data expert in California, is developing software that uses weather and crop yield data to help farmers plant crops and deploy resources more efficiently. He co-founded AcreValue, which analyzes public-data sources to help farmers determine the agricultural value of land they want to buy or sell.

These “precision agriculture” startups are among a new wave of companies helping farmers boost yields while using lower quantities of water, fertilizer, and pesticides. Map data is a key component, helping drones fly straight and farmers visualize data in a way they can understand.

Farming usually conjures images of overalls and pitchforks. The reality is much more complex. “It’s become a very high-tech industry,” says Seifert, who studied at Stanford University and worked at Google before launching AcreValue. “Recently, a picture of someone’s tractor got posted on Reddit, and there are four or five different screens in that photo,” he says, including precision-planting monitors and tablets for Web browsing.

AcreValue collects data from government sources, compiles and analyzes them, and presents them on top of the map. It uses Google Maps JavaScript API and the Google Maps Static Maps API to build a satellite image-viewing tool with which “farmers can recognize the fields more easily,” Seifert says.
AcreValue_1.png

The result is that farmers who want to buy or sell land can find “a very Zillow type of experience” at AcreValue, Seifert says.

“If you’re running a very, very large business, and you’re running that business in an Excel spreadsheet, you’re missing out on a lot of the spatial detail you might be getting if you can have a map view,” he adds. “That sort of transparency into what’s happening in your operations is a huge benefit.”

According to San Francisco agricultural-technology company Granular, which acquired AcreValue earlier this year, agriculture worldwide is a $3 trillion industry. The Association of Unmanned Vehicle Systems International predicts that agriculture will make up most of the market for unmanned aerial vehicles, or UAVs, once the FAA legalizes them. Many small farmers are already using inexpensive drones to survey their land.
image (1).png

Because drones can fly to specific patches of a crop much more quickly than tractors can drive, says Ken Giles, a professor of biological and agricultural engineering at the University of California at Davis, they enable farmers to observe how weather or pest conditions develop before spraying pesticides or applying fertilizer.

“If you’ve got a vehicle (that can) do a targeted spray, then you don’t have to think ahead as much,” Giles says. UAVs “allow us to be more intelligent about our use.”

Using map data, farmers can program precise courses for their drones to fly to survey their fields. Heat maps developed from drone photography help farmers visualize water use, disease outbreaks, and plant health statistics.
image.png

Like Seifert, Swiss drone engineer Beyeler is targeting midsize to large farms with his company, SenseFly. Its software, which incorporates Google Maps data, enables farmers to draw a drone’s flight path, then track and update it on the fly. SenseFly’s standard interchange formats, such as GeoTIFF, KML, and shapefiles, help different systems communicate with each other, Beyeler says.

Using its built-in GPS technology, a SenseFly drone makes several passes over a crop to take photos and gather data. SenseFly’s software then uses the information to develop a high-resolution “normalized difference vegetation map” of chlorophyll presence, a key indicator of plant health.

Self-driving tractors, also gaining in popularity, can then use the vegetation map to determine how much fertilizer to dispense.

“The farmer can see things he can’t see with the naked eye,” Beyeler says.

When Beyler launched SenseFly in 2009, “drones hadn’t been seen so much in the private world, only in the military world,” he says. “We wanted to democratize the drone technology for civilian populations.”

“We have drones. What should we do with them?” Beyler asked. And his company was born.

Map Tips: Using the Google Maps APIs to book the perfect ride


Editor’s note: ‘Map Tips’ are designed to answer frequently asked questions about Google Maps APIs. For important tips on how to deploy Google’s mapping tools, read more from Richard Coombes, Google Maps Solutions Architect at Google.

The number of transportation booking apps—taxi, rideshare, shuttle and limo to name a few, has exploded over the last few years primarily due to the increase in GPS enabled smartphones, fast and reliable mobile connectivity and simple, secure payment options. These apps offer real benefits to customers, drivers and taxi booking companies and location plays a critical role for all of them. Google Maps APIs enable many feature-rich capabilities that can provide the best location-based information and user experiences for booking and tracking the perfect ride.

Here are eight helpful tips for optimizing your taxi or rideshare services with the Google Maps APIs:

1. Use Places API Autocomplete for easy address entry. The type-ahead-search suggestions available with Places API Autocomplete makes it fast and easy for the customer to provide an accurate pick-up and drop-off location with minimal keystrokes. The Autocomplete feature is available in Android, iOS, Javascript and as a web service for flexible integration options.

2. Automatically locate the customer for fast booking. If booking a taxi immediately, allow your customer to automatically communicate their current location using the location capabilities of their smartphone or browser. On Android and iOS make use of the Places API Place Picker UI widget so your customer can choose their location from a list of nearby places. Alternatively, the Geocoding API can provide the nearest address to their current location.
3. Use the Distance Matrix API to find the closest taxis based on drive time and drive distance. Performing a simple radius or “straight line” distance search to find the nearest available taxis can often provide misleading results. For example, a taxi may be on the far side of a highway or the other side of a river and take a long time to drive to the pick-up point. The Distance Matrix API can calculate the driving distances and times, based on Google’s road network, to improve the accuracy of your search results.

4. Show the real-time location of the customer and driver on a Google Map. Help reassure the customer that their ride is on the way by showing real-time location of the vehicle on a map—in relation to their position. If the driver is unfamiliar with the area this can also help guide her to the customer’s location. Google has global coverage so if you’re working in multiple countries we’ve got you covered. No need to work with multiple map providers. Asset tracking with Google Maps allows a taxi booking company to view the real-time location and status of all their taxis on a central map to help process offline bookings coming in via telephone calls. Need help storing and retrieving all of your taxi fleet locations? Take a look at our previous blog post on how to store your location data in the cloud with Firebase.


5. Provide the customer arrival times based on current traffic conditions. If your customer is in a hurry, it can feel really frustrating wondering when her taxi will arrive. Keep the customer informed of the vehicle’s estimated time of arrival using the duration-in-traffic information in the Directions API.


6. Provide an estimated fare and drop-off time to the customer. Before the journey starts, provide customers with an estimated fare based on the optimal route and traffic conditions. The Directions API can provide the route distance and duration in current traffic. Alternative routes can also be provided. These details can be used to estimate when the customer may arrive at their destination and how much it should cost.
7. Improve measurement accuracy of distance travelled using Roads API. If you’ve used GPS on a smartphone before you probably know that the accuracy can sometimes be poor, especially in highrise urban environments. If you need to calculate fares, driver payments, fuel consumption or maintenance planning then accurate distance reporting is vital. The Roads API can take your original jittery GPS data and snap them to the road network as well as fill in gaps (interpolate) in missing your GPS data to ensure the path smoothly follows the road. This leads to improved distance measurements and better visualisations of where the taxi has actually travelled.


8. Better understand vehicle speed and safety. Oftentimes a taxi booking company is relying solely on information coming from the driver’s and customer’s smartphone and no in-car telematic devices are available. The Roads API can provide the posted speed limit along a road. This speed limit can be compared with the calculated actual speed of the vehicle (from GPS data) to determine if and where speeding occurs.

We hope you’re able to incorporate some of these ideas into your taxi booking systems. Learn more about what Google Maps APIs can do for your websites and applications.

Labels meets markers with the Google Maps JavaScript API

Maps with many markers can be hard to navigate. On Google Search, we combat this problem by adding labels to the markers on the associated map. This allows users to associate a marker to the specific search result. Now developers are able to use this labeling property on the Google Maps JavaScript API.

Today, we are introducing a new label property to MarkerOptions that makes labeling your markers easier. The label property allows you to pass a letter, number, or any other character to your map markers, creating a map that is easier to navigate and read.

For example, to add the label A on a markers, you would add “label” to the pin you would like to mark:
var marker = new google.maps.Marker({
  // Supply map and position params as usual.
  label: 'A'
});

This feature is also available on custom icons, so you can continue to keep the same look and feel of your map.

You can set the origin of the text in your icons, as well as control the color of the text. For example:
var beachIcon = {
  url: 'images/beachflag.png',
  labelOrigin: new google.maps.Point(9, 9)
};

var marker = new google.maps.Marker({
  // Supply the map and position parameters as usual.
  icon: beachIcon,
  label: {
    text: '2',
    color: 'purple'
  }
});

For more details, check out the developer's guide and reference. As always, if you have a question, we recommend posting on Stack Overflow using the google-maps-api-3 tag. Happy mapping!

Posted by Richard Wang, Intern, Google Maps JavaScript API team

Tixsee builds a slam-dunk ticket-buying experience for the Dallas Mavericks using Google Maps APIs


Editor’s note: Today’s guest blogger is Brett Dowling, founder and President of Tixsee, an innovative Fan Experience Management Platform for the sports, entertainment, and venue management industries. Read how Tixsee used Google Maps APIs to build a unique ticket-purchasing platform for the Dallas Mavericks.

When you go to a basketball game, you want to make sure you get great seats, secure an awesome view of the court and are able to find your way around the arena. That’s what we’re doing for fans of the Dallas Mavericks with our Tixsee platform, an immersive shopping experience that lets people see the view from their seats before purchasing.

From the Mavericks’ Web site, fans can take a tour of the arena, stroll the aisles to see the view of the court from any seat, then buy a ticket. They can also tour the Mavericks’ store and buy team gear. Visitors make their way around the arena using familiar Street View controls. We used the Google Maps Street View Service in the Google Maps JavaScript API to build this experience. We worked with Business Photos America, Google Maps Business View Trusted Agency, to take more than 12,400 images of the arena. We used those images to create more than 1,000 high-definition panoramas that re-create the arena in 3D.
PastedGraphic-1.png

The Mavericks’ ticketing platform is much more than just the site’s interactive interface. Just as important is the content management system (CMS) that lets the team do things like create special offers to drum up excitement and increase ticket sales. We use the Google Maps Embed API to embed the Street View imagery inside the CMS. The backend users can then orient the panoramas and preview campaigns before deploying to the live project. For a social media campaign, they hid a photograph of an autographed team ball in the virtual arena, and the first person to find the ball online was able to keep it. Traffic to the site spiked.
PastedGraphic-2.png

We’ve got a lot more planned, especially for mobile, because we know people will be bringing their phones to the arena. We have plans to release apps for iOS and Android in the near future. We’ll be using the Google Maps Directions API so people can find their way to one of the eight parking lots near the arena, then navigate right to their seats. It’s all part of our ultimate goal: to build a platform for the Mavericks that intensifies the fan experience and reinforces the value of purchasing tickets to live events at the arena.

Map Tips: Create a connected mapping experience


Editor’s note: ‘Map Tips’ are designed to answer frequently asked questions about Google Maps APIs. For important tips on how to deploy Google’s mapping tools, read more from David McClusky, Google Maps Solutions Architect at Google.
Millions of websites and apps are leveraging the Google Maps APIs today—whether helping users book a hotel or find a great restaurant. But, did you know that by enabling signed-in maps you can make this an even more powerful experience for your users? With signed-in Maps, you can build applications where users will see a map completely tailored to them.

Within your application, users will have the option to sign-in to the Google Map with their Google account, and will be able to see all of their favorite places (such as their home and work locations) displayed on your map. If you display your own layers of data on the map, such as markers for store locations, you can enable your users to save those to their favorite places as well, to be viewable on other Google Maps throughout the web and mobile devices (such as maps.google.com or Google Maps for Android/iOS).

For example, imagine you are building a travel site to help users choose a hotel and plan nearby activities. By enabling signed-in maps, a user can save a hotel they found on your site to their personal Google account.

Later, when continuing their research on maps.google.com or on Google Maps Mobile, your user will see the hotel she saved (indicated by a star on the map), with a link back to your site.

Getting Started

It’s easy to get started. The first step is to enable sign-in on a map created with the Google Maps JavaScript API. You do this by including “signed_in=true” when loading the Javascript API:

<script type="text/javascript"
  src="https://maps.googleapis.com/maps/api/js?v=3.exp&signed_in=true">
</script>
When you enable sign-in with the Google Maps JavaScript API, your users will now see a map tailored to them, which means their saved locations will now show on the map. As you can see in the following picture, the user’s Google profile picture will also appear in the top-right of the map (when logged in with a Google account).

Next, you want to help your users remember the locations that matter most to them by allowing them to save places using the Attributed Save feature of the Google Maps Javascript API. With Attributed Save, saved places will appear on other Google Maps when a user views them on the web or mobile devices.

The easiest way to do this is by adding place and attribution properties to the MarkerOptions object when creating and adding a marker to your map.
var marker = new google.maps.Marker({
    map: map,
    // Define the place with a location, and a query string.
    place: {
      location: {lat: 40.739929, lng: -74.005792},
      query: Gansevoort Meatpacking NYC, New York, NY
    },
    // Attributions help users find your site again.
    attribution: {
      source: 'Altostrat Hotels',
      webUrl: 'https://developers.google.com/maps/'
    }
  });
By adding the place property with a location and query string, you are associating your marker with a specific point-of-interest in Google’s database of places. The attribution field allows your users link back to your site again in the future when viewing this saved place on other maps throughout the web. Note that attributed save requires the place to be known in Google’s database (either as a business name or an address). Here is a complete working code sample for reference.

Tips and Tricks

Here are some tips to help you make the most of signed-in maps using the Google Maps Javascript API:

When specifying the place to associate with a marker, use placeId rather than a query string to uniquely identify the place. Learn more about how to reference a place using a place Id.
Be sure to use include attribution for any markers added to the map, so your users can easily link back to your site when viewing favorite places on other maps throughout the web.
If you are showing only a single marker on a map, using the SaveWidget is a great way to highlight the location with a custom display

Resources

We hope you’re able to incorporate signed-in Maps into your website. To learn more about implementing signed-in Maps and Attributed Save, take a look at the following resources: