Tag Archives: Features

Improving Remarketing with Google Analytics: A UI Refresh and List Importing

Last year, we released a new, more powerful version of segmentation, supporting more robust user-centric analysis (recap here).

Now you can achieve the full power of this enhanced segmentation in Remarketing with Google Analytics.

With this overhaul (which is rolling out over the next two weeks), you can more easily create Remarketing lists based on origin, demographics, and behavior to re-engage with your audiences like never before.

New interface under Admin > Remarketing Lists


One of our early users shared their experience so far:

“We have 8 target user segments that we engage with through Eloqua. Google Analytics provides us with a flexible environment to track the behavior of these segments across all incoming traffic channels. Now we can easily import these segments to make our remarketing spend much more effective.” --Oleg Rogynskyy, CEO, Semantria

Got lots of segments that you'd like to act on? No problem. You can now import from your existing segments in the Remarketing list builder. This includes all custom segments you’ve created, plus segments you import from the solutions gallery.


And after importing...


We're excited to release this improvement and make Remarketing with Google Analytics simpler and more powerful.  You can get started by importing the Remarketing Starter pack from the Google Analytics Solutions Gallery.

Stay tuned for more improvements in the coming weeks! 

Posted by Dan Stone, Product Manager, Google Analytics 

Wrangle Your Site Categories And Product Types With Content Grouping

Viewing your site content in logical groups is important for sites and businesses of all types. It lets you understand how different categories of products are working together and the buckets that generate the most revenue. Or, if you run a news site understand which categories are the hottest and most in demand. Some of you have been analyzing these things in the past via Advanced Segments but we want to make this even easier and more useful across the product. That’s why we’re excited to launch Content Grouping.

Content Grouping allows sites to group their pages through tracking code, a UI-based rules editor, and/or UI-based extraction rules. Once implemented, Content Groupings become a dimension of the content reports and allow users to visualize their data based on each group in addition to the other primary dimensions.
We’ve been hard at work refining Content Grouping based on tester feedback to create a simplified experience that has been unified with the familiar Channel Grouping interface. Content Grouping supports three methods for creating groups: 1) Tracking Code, 2) Rules, 3) Extraction. You can use a single method or a combination of all of them. 
This will help you wrangle those long lists of tens, hundreds or thousands of URLs, most of which have a tiny portion of the pageviews (or entrances, exits, etc) each one being individually not interesting, but together telling a meaningful story. We would like to help you grasp and represent this data in a grouped format, helping you understand the overall areas that the website owner has (e.g. “product pages”, “search pages”, “watch pages”).
Content Grouping lets you group content into a logical structure that reflects how you think about your site. You can view aggregated metrics by group name, and then drill in to individual URLs, page titles, or screen names. For example, you can see the aggregated number of pageviews for all pages in /Men/Shirts rather than for each URL or page title, and then drill in to see statistics for individual pages.

Watch the below video to learn more:


Be sure and visit our Help Center to learn how to get started with Content Grouping today.

Happy Analyzing!

Posted by Russell Ketchum, Google Analytics Team

Google Analytics Dashboards for Quick Insights

The following is a guest post by Benjamin Mangold, Director of Digital & Analytics at Loves Data, a Google Analytics Certified Partner.

Creating custom Google Analytics Dashboards is a great way to monitor performance and get quick insights into the success of key aspects of your websites and mobile apps. You can create dashboards to meet your particular needs, from understanding marketing campaign performances, to content engagement levels, and even trends relating to goal conversions and e-commerce transactions.

Sample custom dashboard (click for full-size image)

The dashboards you create will depend on who is going to use them. You will want the dashboard used by your marketing manager to be different to the dashboard that is seen by your technical team - and different again for your CEO. You should always tie dashboards to the types of questions the particular person or stakeholder is going to ask. Basing your dashboards on particular roles or job functions within your organisation is a good place to start thinking about the type of dashboards you will want to design.
Dashboard Widgets

Each dashboard is made up of widgets which can be pieces of information or data from your Google Analytics reports. There are a number of different widgets and the ones you add to your dashboard will depend on the type of trends and insights you want to provide.


Metric widgets present a single piece of data on your dashboard along with a small sparkline.

Timeline widgets give a detailed sparkline showing trends by day. This widget allows you to show a single metric or compare two metrics.

Geomap widgets allows you to display a map within your dashboard. You can show the location of your visitors and even compare conversion rates or engagement by geographic location.

Table widgets display a table that combines information (a dimension) with up to two metrics.

Pie widgets present a pie or doughnut chart and are useful for visual comparisons.

Bar widgets are also useful for presenting comparisons. This widget allows you to pivot by an additional dimension and switch between horizontal and vertical layout.

In most cases you will want to use the ‘standard’ widgets. These present data that has been processed into the standard reports. You can also include ‘real-time’ widgets, but it is important to know that these will not be included if you are exporting or scheduling the dashboard.

Widget Filters

Filters can be applied to widgets within your dashboard, allowing you to further define what is presented in your dashboard. For example, if you want to include a metric widget to show the total number of visits from your Google AdWords campaigns, you could then add the following filter which will only include visits where the source is ‘google’ and the medium is ‘cpc’.


Sharing Dashboards

Once you have created your custom dashboards you can keep these private, share the dashboard with everybody who has access to the reporting view or even share them with the wider Google Analytics community. The Google Analytics Solutions Gallery is a crowdsourced collection of customizations and includes a number of great dashboards that you can add to your account.

Have a great dashboard? Want to win prizes? Loves Data, a Google Analytics Certified Partner are running a competition for the best Google Analytics Dashboard. Judges include Google’s own Justin Cutroni, Daniel Waisberg and Adam Singer. The competition closes on December 31, 2013 and winners will be announced in late January 2014.

Posted by Benjamin Mangold, Google Analytics Certified Partner

Optimizing AdSense Revenue Using Google Analytics

Recently Google Analytics launched two important new capabilities for its AdSense integration: AdSense Exits reports and AdSense Revenue as an experiment objective. They both come as a great additions to websites that use AdSense for monetization. In this post I will go over the the AdSense Analytics integration and how it can be used to optimize AdSense revenue.

Integrating AdSense and Google Analytics

Before going further into the wonders of the Analytics AdSense marriage, you should first be sure that your accounts are linked properly. Here is how to do it. First follow the steps in the screenshot below after logging into Google Analytics (Admin => AdSense Linking => Link Accounts): 

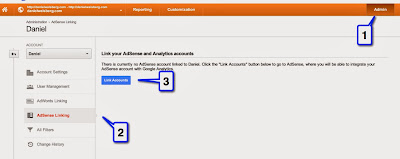
AdSense and Analytics Integration (click for full size)

You will be sent to your AdSense account in order to confirm the linking and then you will be sent back to Google Analytics to choose which profiles should include this data. If you have any problems or additional questions, take a look at the AdSense Help Center. After the integration is complete the following metrics will be available on your Google Analytics account:
  • AdSense revenue: revenue generated by AdSense ads.
  • Ads clicked: the number of times AdSense ads were clicked.
  • AdSense CTR (click-through rate): the percentage of page impressions that resulted in a click on an ad.
  • AdSense eCPM: AdSense revenue per 1,000 page impressions.
  • AdSense ads viewed: number of ads viewed.
  • AdSense Page Impressions: the number of pageviews during which an ad was displayed.

AdSense Reports On Google Analytics

Currently, there are 3 out-of-the-box AdSense reports available on Analytics: Pages, Referrers and Exits. You can find them here (direct link to report).

1. AdSense Pages

This report provides information about which pages contributed most to AdSense revenue. It will show each of the pages on the website and how well they performed in terms of AdSense. For each page in the website that contains an AdSense unit we will be able to analyze the following metrics: AdSense revenue, AdSense ads clicked, AdSense CTR, AdSense eCPM, AdSense ads viewed and AdSense page impressions. 

This report provides an interesting view of which page performed best, and it can be used to optimize website content. For example, if you find that posts about celebrities generate more revenue than posts about soccer, you might consider writing more about celebrities (if your main objective is to make money on AdSense.)

2. AdSense Referrers

This report provides information about the performance of domains that referred visitors who generated AdSense revenue. This information is extremely valuable; however, I suggest using a different report, since it provides more in-depth information: “All Traffic”. 

The AdSense Referrers only displays information about websites that generated AdSense Revenue, it does not provide information on other types of traffic sources and campaigns. For this reason, I believe the All Traffic report presents a more complete view. To find the report, go to this page (direct link to report) and click on the AdSense tab just above the chart.

3. AdSense Exits

AdSense Exit report shows the number of sessions that ended due to a user clicking on an AdSense ad. This is an interesting metric as it can show which pages have a "high conversion rate", i.e. the ratio of visits to a page and those that left the website clicking on an AdSense unit through it. If your monetization is made through AdSense this report will give just that: AdSense conversion rate per page.

Optimizing AdSense revenue using Google Analytics

Below is an example of how to use the integration from my Analytics for Publishers eBook. Most websites work with templates and each template may have different AdSense placements; this means that an important analysis would be to compare performance by template (or by category) rather than by page. 

In order to analyze template performance, we will need to create one segment per template. If you want to learn more about creating Segments, check this Help Center article. For example, let’s suppose your website has the following page templates:
  • Analytics pages with URLs structured as example.com/analytics/...
  • Testing pages with URLs structured as example.com/testing/...
  • Targeting pages with URLs structured as example.com/targeting/...
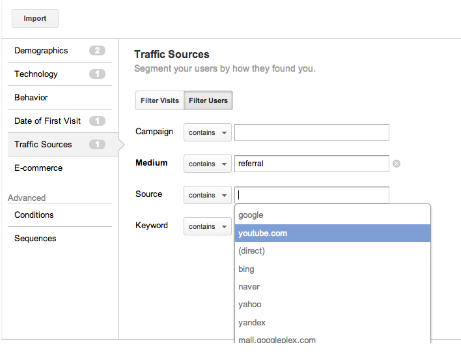
In this case you would create three segments using the dimension Page, each containing its unique pattern: /analytics/ for analytics pages, /testing/ for testing pages, and /targeting/ for targeting pages. Below is an example of how the segment would look for the analytics pages: 

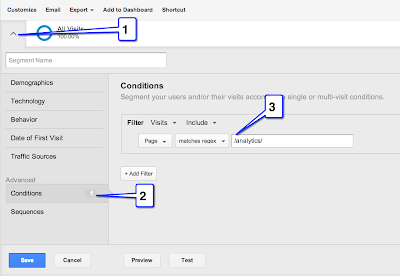
Analyzing template performance using segments (click for full size) 

After creating the segments for all three templates, you will be able to choose all of them in the top-left corner of the screen (just above the chart, see bubble #1 above) to see a comparison between them. Below is a screenshot showing how such a comparison would look like: 

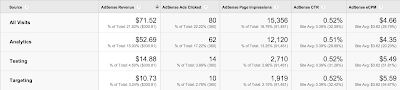
Table comparison metrics for different visitor segments (click for full size)
In the table above we are able to compare pages by all metrics available. For example, we can see that while the Analytics section has higher revenue, this is related to the number of impressions, which is also significantly higher. When we analyze further, we see that the Testing and Targeting sections have a good potential, with the same CTR but significantly higher AdSense eCPM. Based on these metrics we can understand which templates and content types are the most effective. 

As mentioned above, once you find out which pages are performing well and which pages are not, you can use Content Experiments to optimize them. Here is a Content Experiments guide.

Closing Thoughts

Here are a few takeaways for you to start optimizing today!
  1. Understand which content type and subject generates the highest revenue and create content based on this data.
  2. Understand which page templates bring the best results by using advanced segments.
  3. Analyze AdSense performance to learn which segments have a good CTR; this might bring insight into which audience to target.

Google News launches redesign in UK and India


Starting today, we’ll be rolling out changes to some international versions of Google News in an effort to unify the News experience across editions. As in the U.S. version, these changes offer richer visual navigation, help you find trending and popular news more easily, give you the option to further customize your news experience, and allow you to share pieces you care about in a simpler way.

We’ve also been working to give you a closer relationship with the publishers you love, who can now highlight some of their most compelling content right on your Google News homepage.

In order to bring you the best Google News experience possible, we’ll be periodically refreshing select editions, starting with the U.K. and India. We hope you enjoy these enhancements. As always, please feel free to submit your feedback or visit our Help Center if you have more questions.