Tag Archives: emulator

A Smoother Ride: Android Emulator Stability and Performance Updates

Posted by Neville Sicard-Gregory – Senior Product Manager, Android Studio


Looking for a more stable, reliable, and performant Emulator? Download the latest version of Android Studio or ensure your Emulator is up to date in the SDK Manager.

A split screen shows Kotlin code on the left and the corresponding Android app display on the right in Android Studio. The app displays the Google Play Store, Photos, YouTube, Gmail, and Chrome icons.

We know how critical the stability, reliability, and performance of the Android Emulator is to your everyday work as an Android developer. After listening to valuable feedback about stability, reliability, and performance, the Android Studio team took a step back from large feature work on the Android Emulator for six months and started an initiative called Project Quartz. This initiative was made up of several workstreams aimed at reducing crashes, speeding up startup time, closing out bugs, and setting up better ways to detect and prevent issues in the future.

Improved stability and reliability

A key goal of Project Quartz aimed to reduce Emulator crashes, which can frustrate and block developers, decreasing their productivity. We focused on fixing issues causing backend and UI crashes and freezes, updated the UI framework, updated our hypervisor framework, and our graphics libraries, and eliminated tech debt. This included:

    • Moving to a newer version of Qt, the cross-platform framework for building the graphical user interfaces of the Android Emulator, and making it stable on all platforms (as of version 34.2.13/ This was also a required change to ensure things like Google Maps and the location settings UI continued to work in the Android Emulator.
    • Updating gfxstream, the graphics rendering system used in the Android Emulator, to improve our graphics layer.
    • Adding more than 600 end-to-end tests to the existing pytests test suite.

As a result, we have seen 30% fewer crashes in the latest stable version of Android Studio, as reported by developers who have opted-in to sharing crash details with us. Along with additional end-to-end testing, this means a more stable, reliable, and higher quality experience with fewer interruptions while using the Android Emulator to test your apps.

A horizontal bar graph showing performance times of different versions of the Android emulator in milliseconds

This chart illustrates the reduction in reported crashes by stable versions of the Android Emulator (newer versions are at the top and shorter is better).

We have also enhanced our opt-in telemetry and logging to better understand and identify the root causes of crashes, and added more testing to our pre-launch release process to improve our ability to detect potential issues prior to release.

Improved release quality

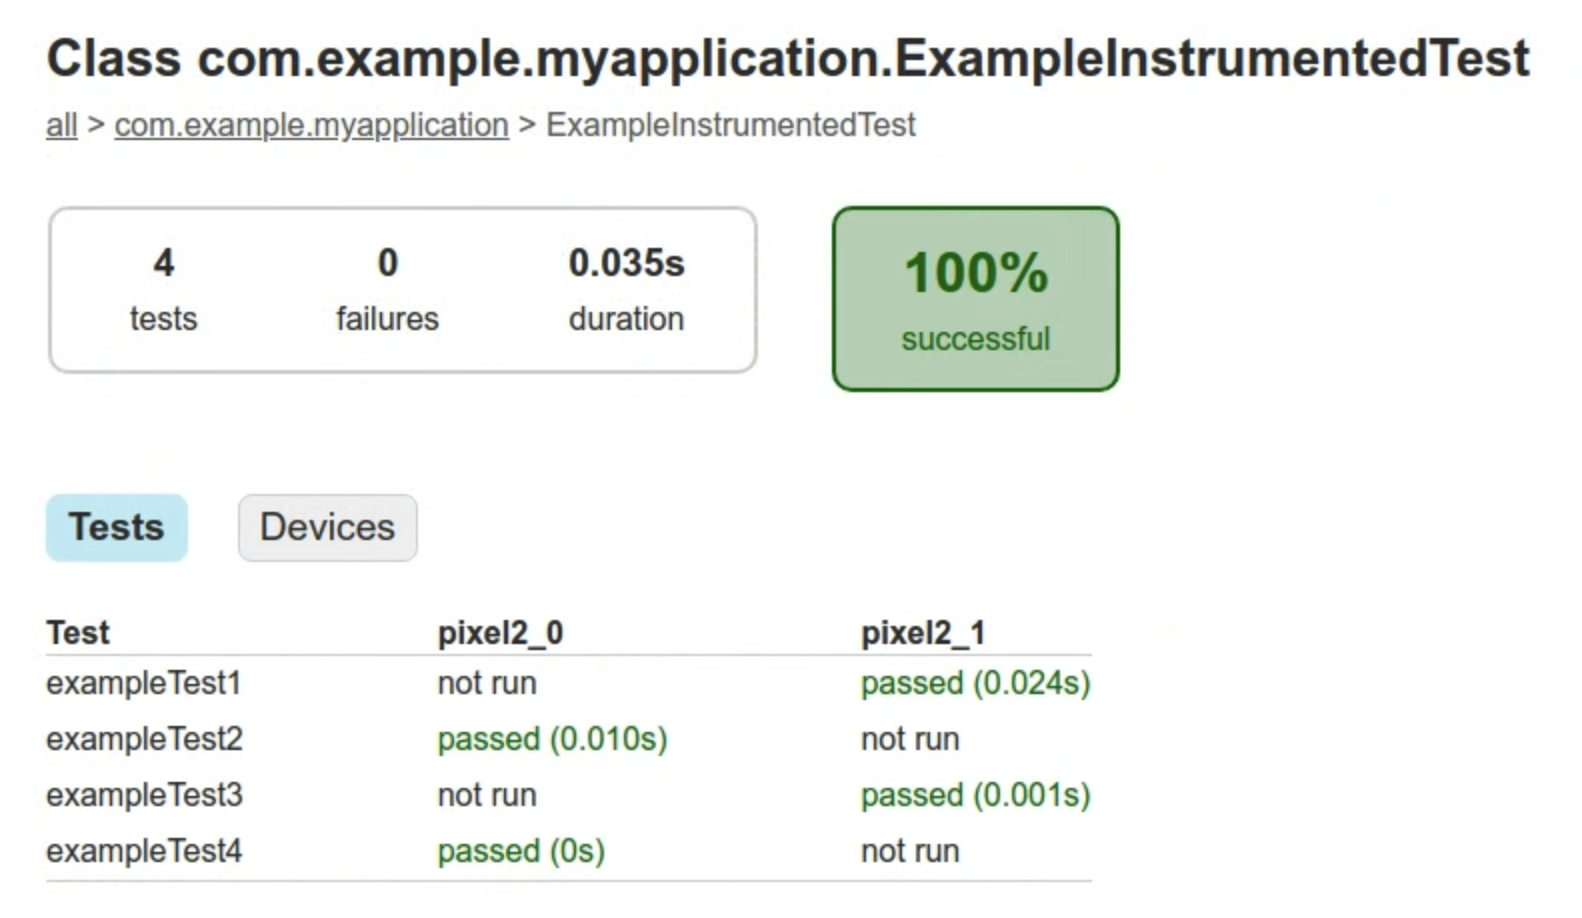
We also implemented several measures to improve release quality, including increasing the number and frequency of end-to-end, automated, and integration tests on macOS, Microsoft Windows, and Linux. Now, more than 1,100 end-to-end tests are ran in postsubmit, up from 500 tests in the past implementation, on all supported operating system platforms . These tests cover various scenarios, including (among other features) different Android Emulator snapshot configurations, diverse graphics card considerations , networking and Bluetooth functionality, and performance benchmarks between Android Emulator system image versions.

This comprehensive testing ensures these critical components function correctly and translates to a more reliable testing environment for developers. As a result, Android app developers can accurately assess their app's behavior in a wider range of scenarios.

Reduced open issues and bugs

It was also important for us to reduce the number of open issues and bugs logged for the Android Emulator by addressing their root cause and ensuring we cover more of the use cases you run into in production. During Project Quartz, we reduced our open issues by 43.5% from 4,605 to 2,605. 17% of these were actively fixed during Quartz and the remaining were closed as either obsoleted or previously fixed (e.g. in an earlier version of the Android Emulator) or duplicates of other issues.

Next Steps

While these improvements are exciting, it's not the end. We will continue to build on the quality improvements from Project Quartz to further enhance the Android Emulator experience for Android app developers.

As always, your feedback has and continues to be invaluable in helping us make the Android Emulator and Android Studio more robust and effective for your development needs. Sharing your metrics and crashdumps is crucial in helping us understand what specifically causes your crashes so we can prioritize fixes.

You can opt-in by going to Settings, then Appearance and Behavior, then System Settings, then Data Sharing, and selecting the checkbox marked ‘Send usage statistics to Google.'

The Android Studio settings menu displays the Data Sharing settings page, where 'Send usage statistics to Google' option is selected.

Be sure to download the latest version of the Android Emulator alongside Android Studio to experience these improvements.

As always, your feedback is important to us – check known issues, report bugs, suggest improvements, and be part of our vibrant community on LinkedIn, Medium, YouTube, or X. Together, we can create incredible Android experiences for users worldwide!

What’s New in Scalable Automated Testing

Posted by Arif Sukoco, Android Studio Engineering Manager (@GoogArif) & Jolanda Verhoef, Developer Relations Engineer (@Lojanda)

dark blue background with three different devices showing the same screen: phone , tablet, and watch

We know it can be challenging to run Android instrumented tests at scale, especially when you have a big test suite that you want to run against a variety of Android device profiles.

At I/O 2021 we first introduced Unified Test Platform or UTP. UTP allows us to build testing features for Android instrumented tests such as running instrumented tests from Android Studio through Gradle, and Gradle Managed Devices (GMD). GMD allows you to define a set of virtual devices in build.gradle, and let Gradle manage them by spinning them up before each instrumented test run, and tearing them down afterwards. In the latest version of Android Gradle Plugin 7.2.0, we are introducing more features on top of GMD to help scale tests across multiple Android virtual devices in parallel.


Sharding

The first feature we are introducing is sharding on top of GMD. Sharding is a common technique used in test runners where the test runner splits up the tests into multiple groups, or shards, and runs them in parallel. With the ability to spin up multiple emulator instances in GMD, sharding is an obvious next step to make GMD a more scalable solution for large test suites.

When you enable sharding for GMD and specify the desired number of shards, it will automatically spin up that number of managed devices for you. For example, the sample below configures a Gradle Managed Devices called pixel2 in your build.gradle:


android {
  testOptions {
    devices {
      pixel2 (com.android.build.api.dsl.ManagedVirtualDevice) {
        device = "Pixel 2"
        apiLevel = 30
        systemImageSource = "google"
        abi = "x86"
      }
    }
  }
}

Let’s say you have 4 instrumented tests in your test suite. You can pass an experimental property to Gradle to specify how many shards you want to divide your tests in. The following command splits the test run into two shards:

class com.example.myapplicationExampleInstrumentedTests

 ./gradlew -Pandroid.experimental.androidTest.numManagedDeviceShards=2 pixel2DebugAndroidTest

Invoking Gradle this way will tell GMD to spin up 2 instances of pixel2, and split the running of your 4 instrumented tests between those 2 emulated devices. In the Gradle output, you will see ​​"Starting 2 tests on pixel2_0", and "Starting 2 tests on pixel2_1".

As seen in this example, sharding through GMD spins up multiple identical virtual devices. If you apply sharding and have more than one device defined in build.gradle, GMD will spin up multiple instances of each virtual device.

The HTML format output of your test run report will be generated in app/build/reports/androidTests/managedDevice/pixel2. This report will contain the combined test results from all the shards.

You can also load the test results from each shard to Android Studio by selecting Run > Import Tests From File from the menu and loading the protobuf output files app/build/outputs/androidTest-results/managedDevice/pixel2/shard_1/test-result.pb and app/build/outputs/androidTest-results/managedDevice/pixel2/shard_2/test-result.pb.

It’s worth remembering that when sharding your tests, there is always a tradeoff between the extra resources and time required to spin up additional emulator instances, and the savings in test running time. As such, it is more useful when you have larger test suites to run.

Also please note that currently GMD doesn’t support running tests for test-only modules yet, and there are known flakiness issues when running on cloud hosted CI servers.


Slimmer Emulator System Images

When running multiple emulator instances at the same time, your limited server’s computing resources could become an issue.

One of the ways to improve this is by slimming down the Android emulator system image to create a new type of device that’s optimized for running automated tests. The Automated Test Device (ATD) system image is designed to consume less CPU and memory by removing components that normally do not affect the running of your app’s instrumented tests, such as the SystemUI, Settings app, bundled apps like Gmail, Google Maps, etc., and some other components. Please read the release notes for more information about the ATD system image.

The ATD system images have hardware rendering disabled by default. This helps with another common source of slow-running test suites. Often, when running instrumented tests on an emulator, access to the host’s GPU for graphics hardware acceleration is not available. In this case, the emulator will choose to use software graphics acceleration, which is much more CPU intensive. Nearly all functionalities still work as expected with hardware rendering off, with the notable exception of screenshots. If you need to take screenshots in your test, we recommend taking a look at the new AndroidX Test Screenshot APIs which will dynamically enable hardware rendering in order to take a screenshot. Please take a look at the examples for how to use these APIs.

To use ATD, first make sure you have downloaded the latest version of the Android emulator from the Canary channel (version 30.9.2 or newer). To download this emulator, go to Appearance & Behavior > System Settings > Updates and set the IDE updates dropdown to “Canary Channel”.

Next, you need to specify an ATD system image in your GMD configuration:


android {
  testOptions {
    devices {
      pixel2 (com.android.build.api.dsl.ManagedVirtualDevice) {
        device = "Pixel 2"
        apiLevel = 30
        systemImageSource = "aosp-atd" // Or "google-atd" if you need
                                       // access to Google APIs
        abi = "x86" // Or "arm64-v8a" if you are on an Apple M1 machine
      }
    }
  }
}

You can now run tests from the Gradle command line just like you would with GMD as before, including with sharding enabled. The only thing you need to add for now is to let Gradle know you are referring to a system image in the Canary channel.


./gradlew -Pandroid.sdk.channel=3
-Pandroid.experimental.androidTest.numManagedDeviceShards=2
pixel2DebugAndroidTest

Test running time improvement using ATD might vary, depending on your machine configuration. In our tests, comparing ATD and non-ATD system images running on a Linux machine with Intel Xeon CPU and 64GB of RAM, we saw 33% shorter test running time when using ATD, while on a 2020 Macbook Pro with Intel i9 processor and 32GB of RAM, we saw 55% improvement.

We’re really excited about these new features, and we hope they can allow you to better scale out your instrumented tests. Please try them out and let us know what you think! Follow us -- the Android Studio development team ‐ on Twitter and on Medium.

Android Wear SDK and Emulator Update

Posted by Hoi Lam, Lead Developer Advocate, Android Wear
Today we launched the latest version of the Android Wear SDK (2.2.0) with several watch face related enhancements. These include the addition of an unread notification indicator for all watch faces, which is planned to be part of the upcoming consumer release of Android Wear. With the Wear SDK 2.2.0, you can customize the notification indicator or display your own. This feature is available to the developer community early, via the SDK and emulator, so you can verify that the indicator fits the design of your watch face. In addition, we are adding enhancements to the ComplicationDrawable class and publishing the final version of the Wear emulator based on Android Oreo.

Introducing the unread notification indicator


Notification is a vital part of the Wear experience. As a result, starting from the next consumer release of Wear (version 2.9.0), a dot-shaped indicator will be displayed by default at the bottom of the watch face if there are new, unread notifications. Watch face developers can preview the indicator with their watch faces by using the latest version of the emulator. Developers can customise the indicator's accent color via WatchFaceStyle.setAccentColor - the default color is white as shown in the example below, but developers can set the color for the ring around the dot to an accent color of their choice, to match the rest of the watch face.
If the new indicator does not fit with the design of your watch face, you can switch it off using WatchFaceStyle.setHideNotificationIndicator and choose another option for displaying the notification, including: 1) displaying the number of unread notifications in the system tray using WatchFaceStyle.setShowUnreadCountIndicator, or 2) getting the number of unread notifications using WatchFaceStyle.getUnreadCount and displaying the number in a way that fits your watch face's unique style.

Enhancement to ComplicationDrawable


We launched the ComplicationDrawable class at last year's Google I/O, and we are continuing to improve it. In this latest SDK release, we added two enhancements:
  • Permission Handling - If the watch face lacks the correct permission to display the content of a complication, the complication type of TYPE_NO_PERMISSION is issued. ComplicationDrawable now handles this automatically and will launch a permission request in onTap. If you previously implemented your own code to start the permission screen, please check that the permission screen is not triggered twice and, if necessary, remove unneeded code.
  • Drawable Callback - If a complication contains an image or an icon, it can take a small amount of time to load after the other initial data arrives. Our previous recommendation therefore was that you redraw the screen every second. But this is unnecessary for watch faces that only update once per minute, for example. As a result, we have added new support for Drawable.Callback to ComplicationDrawable. Developers who update the screen less frequently than once per second should adopt this new callback to redraw the watch face when images have loaded.
For more, please see the Android Wear Release Notes which includes other information regarding the emulator.

More improvements to come


Many of you have noticed a steady release of enhancements to Android Wear over the last few months since the launch of Wear 2.0. We are developing many more for the months ahead and look forward to sharing more when the features are ready.