Tag Archives: Computer Vision

Real-Time 3D Object Detection on Mobile Devices with MediaPipe


Object detection is an extensively studied computer vision problem, but most of the research has focused on 2D object prediction. While 2D prediction only provides 2D bounding boxes, by extending prediction to 3D, one can capture an object’s size, position and orientation in the world, leading to a variety of applications in robotics, self-driving vehicles, image retrieval, and augmented reality. Although 2D object detection is relatively mature and has been widely used in the industry, 3D object detection from 2D imagery is a challenging problem, due to the lack of data and diversity of appearances and shapes of objects within a category.

Today, we are announcing the release of MediaPipe Objectron, a mobile real-time 3D object detection pipeline for everyday objects. This pipeline detects objects in 2D images, and estimates their poses and sizes through a machine learning (ML) model, trained on a newly created 3D dataset. Implemented in MediaPipe, an open-source cross-platform framework for building pipelines to process perceptual data of different modalities, Objectron computes oriented 3D bounding boxes of objects in real-time on mobile devices.
 
3D Object Detection from a single image. MediaPipe Objectron determines the position, orientation and size of everyday objects in real-time on mobile devices.
Obtaining Real-World 3D Training Data
While there are ample amounts of 3D data for street scenes, due to the popularity of research into self-driving cars that rely on 3D capture sensors like LIDAR, datasets with ground truth 3D annotations for more granular everyday objects are extremely limited. To overcome this problem, we developed a novel data pipeline using mobile augmented reality (AR) session data. With the arrival of ARCore and ARKit, hundreds of millions of smartphones now have AR capabilities and the ability to capture additional information during an AR session, including the camera pose, sparse 3D point clouds, estimated lighting, and planar surfaces.

In order to label ground truth data, we built a novel annotation tool for use with AR session data, which allows annotators to quickly label 3D bounding boxes for objects. This tool uses a split-screen view to display 2D video frames on which are overlaid 3D bounding boxes on the left, alongside a view showing 3D point clouds, camera positions and detected planes on the right. Annotators draw 3D bounding boxes in the 3D view, and verify its location by reviewing the projections in 2D video frames. For static objects, we only need to annotate an object in a single frame and propagate its location to all frames using the ground truth camera pose information from the AR session data, which makes the procedure highly efficient.
Real-world data annotation for 3D object detection. Right: 3D bounding boxes are annotated in the 3D world with detected surfaces and point clouds. Left: Projections of annotated 3D bounding boxes are overlaid on top of video frames making it easy to validate the annotation.
AR Synthetic Data Generation
A popular approach is to complement real-world data with synthetic data in order to increase the accuracy of prediction. However, attempts to do so often yield poor, unrealistic data or, in the case of photorealistic rendering, require significant effort and compute. Our novel approach, called AR Synthetic Data Generation, places virtual objects into scenes that have AR session data, which allows us to leverage camera poses, detected planar surfaces, and estimated lighting to generate placements that are physically probable and with lighting that matches the scene. This approach results in high-quality synthetic data with rendered objects that respect the scene geometry and fit seamlessly into real backgrounds. By combining real-world data and AR synthetic data, we are able to increase the accuracy by about 10%.
An example of AR synthetic data generation. The virtual white-brown cereal box is rendered into the real scene, next to the real blue book.
An ML Pipeline for 3D Object Detection
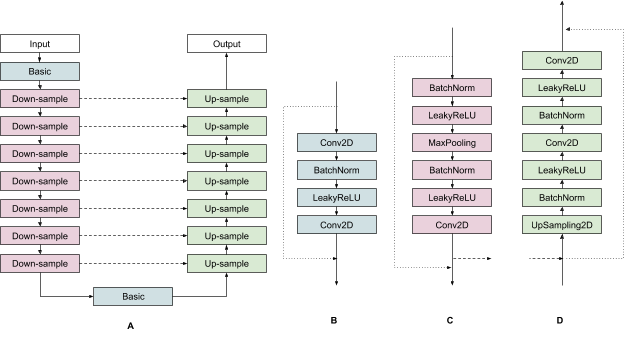
We built a single-stage model to predict the pose and physical size of an object from a single RGB image. The model backbone has an encoder-decoder architecture, built upon MobileNetv2. We employ a multi-task learning approach, jointly predicting an object's shape with detection and regression. The shape task predicts the object's shape signals depending on what ground truth annotation is available, e.g. segmentation. This is optional if there is no shape annotation in training data. For the detection task, we use the annotated bounding boxes and fit a Gaussian to the box, with center at the box centroid, and standard deviations proportional to the box size. The goal for detection is then to predict this distribution with its peak representing the object’s center location. The regression task estimates the 2D projections of the eight bounding box vertices. To obtain the final 3D coordinates for the bounding box, we leverage a well established pose estimation algorithm (EPnP). It can recover the 3D bounding box of an object, without a priori knowledge of the object dimensions. Given the 3D bounding box, we can easily compute pose and size of the object. The diagram below shows our network architecture and post-processing. The model is light enough to run real-time on mobile devices (at 26 FPS on an Adreno 650 mobile GPU).
Network architecture and post-processing for 3D object detection.
Sample results of our network — [left] original 2D image with estimated bounding boxes, [middle] object detection by Gaussian distribution, [right] predicted segmentation mask.
Detection and Tracking in MediaPipe
When the model is applied to every frame captured by the mobile device, it can suffer from jitter due to the ambiguity of the 3D bounding box estimated in each frame. To mitigate this, we adopt the detection+tracking framework recently released in our 2D object detection and tracking solution. This framework mitigates the need to run the network on every frame, allowing the use of heavier and therefore more accurate models, while keeping the pipeline real-time on mobile devices. It also retains object identity across frames and ensures that the prediction is temporally consistent, reducing the jitter.

For further efficiency in our mobile pipeline, we run our model inference only once every few frames. Next, we take the prediction and track it over time using the approach described in our previous blogs for instant motion tracking and Motion Stills. When a new prediction is made, we consolidate the detection result with the tracking result based on the area of overlap.

To encourage researchers and developers to experiment and prototype based on our pipeline, we are releasing our on-device ML pipeline in MediaPipe, including an end-to-end demo mobile application and our trained models for two categories: shoes and chairs. We hope that sharing our solution with the wide research and development community will stimulate new use cases, new applications, and new research efforts. In the future, we plan to scale our model to many more categories, and further improve our on-device performance.
   
Examples of our 3D object detection in the wild.
Acknowledgements
The research described in this post was done by Adel Ahmadyan, Tingbo Hou, Jianing Wei, Matthias Grundmann, Liangkai Zhang, Jiuqiang Tang, Chris McClanahan, Tyler Mullen, Buck Bourdon, Esha Uboweja, Mogan Shieh, Siarhei Kazakou, Ming Guang Yong, Chuo-Ling Chang, and James Bruce. We thank Aliaksandr Shyrokau and the annotation team for their diligence to high quality annotations.

Source: Google AI Blog


Open Images V6 — Now Featuring Localized Narratives


Open Images is the largest annotated image dataset in many regards, for use in training the latest deep convolutional neural networks for computer vision tasks. With the introduction of version 5 last May, the Open Images dataset includes 9M images annotated with 36M image-level labels, 15.8M bounding boxes, 2.8M instance segmentations, and 391k visual relationships. Along with the dataset itself, the associated Open Images Challenges have spurred the latest advances in object detection, instance segmentation, and visual relationship detection.
Annotation modalities in Open Images V5: image-level labels, bounding boxes, instance segmentations, and visual relationships. Image sources: 1969 Camaro RS/SS by D. Miller, the house by anita kluska, Cat Cafe Shinjuku calico by Ari Helminen, and Radiofiera - Villa Cordellina Lombardi, Montecchio Maggiore (VI) - agosto 2010 by Andrea Sartorati. All images used under CC BY 2.0 license.
Today, we are happy to announce the release of Open Images V6, which greatly expands the annotation of the Open Images dataset with a large set of new visual relationships (e.g., “dog catching a flying disk”), human action annotations (e.g., “woman jumping”), and image-level labels (e.g., “paisley”). Notably, this release also adds localized narratives, a completely new form of multimodal annotations that consist of synchronized voice, text, and mouse traces over the objects being described. In Open Images V6, these localized narratives are available for 500k of its images. Additionally, in order to facilitate comparison to previous works, we also release localized narratives annotations for the full 123k images of the COCO dataset.
Sample of localized narratives. Image source: Spring is here:-) by Kasia.
Localized Narratives
One of the motivations behind localized narratives is to study and leverage the connection between vision and language, typically done via image captioning — images paired with human-authored textual descriptions of their content. One of the limitations of image captioning, however, is the lack of visual grounding, that is, localization on the image of the words in the textual description. To mitigate that, some previous works have a-posteriori drawn the bounding boxes for the nouns present in the description. In contrast, in localized narratives, every word in the textual description is grounded.
Different levels of grounding between image content and captioning. Left to Right: Caption to whole image (COCO); nouns to boxes (Flickr30k Entities); each word to a mouse trace segment (localized narratives). Image sources: COCO, Flickr30k Entities, and Sapa, Vietnam by Rama.
Localized narratives are generated by annotators who provide spoken descriptions of an image while they simultaneously move their mouse to hover over the regions they are describing. Voice annotation is at the core of our approach since it directly connects the description with the regions of the image it is referencing. To make the descriptions more accessible, the annotators manually transcribed their description, which was then aligned with the automatic speech transcription result. This recovers the timestamps for the description, ensuring that the three modalities (speech, text, and mouse trace) are correct and synchronized.
Alignment of manual and automatic transcriptions. Icons based on an original design from Freepik.
Speaking and pointing simultaneously are very intuitive, which allowed us to give the annotators very vague instructions about the task. This creates potential avenues of research for studying how people describe images. For example, we observed different styles when indicating the spatial extent of an object — circling, scratching, underlining, etc. — the study of which could bring valuable insights for the design of new user interfaces.
Mouse trace segments corresponding to the words below the images. Image sources: Via Guglielmo Marconi, Positano - Hotel Le Agavi - boat by Elliott Brown, air frame by vivek jena, and CL P1050512 by Virginia State Parks.
To get a sense of the amount of additional data these localized narratives represent, the total length of mouse traces is ~6400 km long, and if read aloud without stopping, all the narratives would take ~1.5 years to listen to!

New Visual Relationships, Human Actions, and Image-Level Annotations
In addition to the localized narratives, in Open Images V6 we increased the types of visual relationship annotations by an order of magnitude (up to 1.4k), adding for example “man riding a skateboard”, “man and woman holding hands”, and “dog catching a flying disk”.
Image sources: IMG_5678.jpg by James Buck, DSC_0494 by Quentin Meulepas, and DSC06464 by sally9258.
People in images have been at the core of computer vision interests since its inception and understanding what those people are doing is of utmost importance for many applications. That is why Open Images V6 also includes 2.5M annotations of humans performing standalone actions, such as “jumping”, “smiling”, or “laying down”.
Image sources: _DSCs1341 (2) by Boo Ph, and Richard Wagner Spiele 2015 by Johannes Gärtner.
Finally, we also added 23.5M new human-verified image-level labels, reaching a total of 59.9M over nearly 20,000 categories.

Conclusion
Open Images V6 is a significant qualitative and quantitative step towards improving the unified annotations for image classification, object detection, visual relationship detection, and instance segmentation, and takes a novel approach in connecting vision and language with localized narratives. We hope that Open Images V6 will further stimulate progress towards genuine scene understanding.

Source: Google AI Blog


AutoFlip: An Open Source Framework for Intelligent Video Reframing

Originally posted on the AI Blog

Videos filmed and edited for television and desktop are typically created and viewed in landscape aspect ratios (16:9 or 4:3). However, with an increasing number of users creating and consuming content on mobile devices, historical aspect ratios don’t always fit the display being used for viewing. Traditional approaches for reframing video to different aspect ratios usually involve static cropping, i.e., specifying a camera viewport, then cropping visual contents that are outside. Unfortunately, these static cropping approaches often lead to unsatisfactory results due to the variety of composition and camera motion styles. More bespoke approaches, however, typically require video curators to manually identify salient contents on each frame, track their transitions from frame-to-frame, and adjust crop regions accordingly throughout the video. This process is often tedious, time-consuming, and error-prone.

To address this problem, we are happy to announce AutoFlip, an open source framework for intelligent video reframing. AutoFlip is built on top of the MediaPipe framework that enables the development of pipelines for processing time-series multimodal data. Taking a video (casually shot or professionally edited) and a target dimension (landscape, square, portrait, etc.) as inputs, AutoFlip analyzes the video content, develops optimal tracking and cropping strategies, and produces an output video with the same duration in the desired aspect ratio.
Left: Original video (16:9). Middle: Reframed using a standard central crop (9:16). Right: Reframed with AutoFlip (9:16). By detecting the subjects of interest, AutoFlip is able to avoid cropping off important visual content.

AutoFlip Overview

AutoFlip provides a fully automatic solution to smart video reframing, making use of state-of-the-art ML-enabled object detection and tracking technologies to intelligently understand video content. AutoFlip detects changes in the composition that signify scene changes in order to isolate scenes for processing. Within each shot, video analysis is used to identify salient content before the scene is reframed by selecting a camera mode and path optimized for the contents.

Shot (Scene) Detection

A scene or shot is a continuous sequence of video without cuts (or jumps). To detect the occurrence of a shot change, AutoFlip computes the color histogram of each frame and compares this with prior frames. If the distribution of frame colors changes at a different rate than a sliding historical window, a shot change is signaled. AutoFlip buffers the video until the scene is complete before making reframing decisions, in order to optimize the reframing for the entire scene.

Video Content Analysis

We utilize deep learning-based object detection models to find interesting, salient content in the frame. This content typically includes people and animals, but other elements may be identified, depending on the application, including text overlays and logos for commercials, or motion and ball detection for sports.

The face and object detection models are integrated into AutoFlip through MediaPipe, which uses TensorFlow Lite on CPU. This structure allows AutoFlip to be extensible, so developers may conveniently add new detection algorithms for different use cases and video content. Each object type is associated with a weight value, which defines its relative importance — the higher the weight, the more influence the feature will have when computing the camera path.


Left: People detection on sports footage. Right: Two face boxes (‘core’ and ‘all’ face landmarks). In narrow portrait crop cases, often only the core landmark box can fit.

Reframing

After identifying the subjects of interest on each frame, logical decisions about how to reframe the content for a new view can be made. AutoFlip automatically chooses an optimal reframing strategy — stationary, panning or tracking — depending on the way objects behave during the scene (e.g., moving around or stationary). In stationary mode, the reframed camera viewport is fixed in a position where important content can be viewed throughout the majority of the scene. This mode can effectively mimic professional cinematography in which a camera is mounted on a stationary tripod or where post-processing stabilization is applied. In other cases, it is best to pan the camera, moving the viewport at a constant velocity. The tracking mode provides continuous and steady tracking of interesting objects as they move around within the frame.

Based on which of these three reframing strategies the algorithm selects, AutoFlip then determines an optimal cropping window for each frame, while best preserving the content of interest. While the bounding boxes track the objects of focus in the scene, they typically exhibit considerable jitter from frame-to-frame and, consequently, are not sufficient to define the cropping window. Instead, we adjust the viewport on each frame through the process of Euclidean-norm optimization, in which we minimize the residuals between a smooth (low-degree polynomial) camera path and the bounding boxes.

Top: Camera paths resulting from following the bounding boxes from frame-to-frame. Bottom: Final smoothed camera paths generated using Euclidean-norm path formation. Left: Scene in which objects are moving around, requiring a tracking camera path. Right: Scene where objects stay close to the same position; a stationary camera covers the content for the full duration of the scene.

AutoFlip’s configuration graph provides settings for either best-effort or required reframing. If it becomes infeasible to cover all the required regions (for example, when they are too spread out on the frame), the pipeline will automatically switch to a less aggressive strategy by applying a letterbox effect, padding the image to fill the frame. For cases where the background is detected as being a solid color, this color is used to create seamless padding; otherwise a blurred version of the original frame is used.

AutoFlip Use Cases

We are excited to release this tool directly to developers and filmmakers, reducing the barriers to their design creativity and reach through the automation of video editing. The ability to adapt any video format to various aspect ratios is becoming increasingly important as the diversity of devices for video content consumption continues to rapidly increase. Whether your use case is portrait to landscape, landscape to portrait, or even small adjustments like 4:3 to 16:9, AutoFlip provides a solution for intelligent, automated and adaptive video reframing.


What’s Next?

Like any machine learning algorithm, AutoFlip can benefit from an improved ability to detect objects relevant to the intent of the video, such as speaker detection for interviews or animated face detection on cartoons. Additionally, a common issue arises when input video has important overlays on the edges of the screen (such as text or logos) as they will often be cropped from the view. By combining text/logo detection and image inpainting technology, we hope that future versions of AutoFlip can reposition foreground objects to better fit the new aspect ratios. Lastly, in situations where padding is required, deep uncrop technology could provide improved ability to expand beyond the original viewable area.

While we work to improve AutoFlip internally at Google, we encourage contributions from developers and filmmakers in the open source communities.

Acknowledgments

We would like to thank our colleagues who contributed to Autoflip, Alexander Panagopoulos, Jenny Jin, Brian Mulford, Yuan Zhang, Alex Chen, Xue Yang, Mickey Wang, Justin Parra, Hartwig Adam, Jingbin Wang, and Weilong Yang; MediaPipe team who helped with open sourcing, Jiuqiang Tang, Tyler Mullen, Mogan Shieh, Ming Guang Yong, and Chuo-Ling Chang.

By Nathan Frey, Senior Software Engineer, Google Research, Los Angeles and Zheng Sun, Senior Software Engineer, Google Research, Mountain View

AutoFlip: An Open Source Framework for Intelligent Video Reframing


Videos filmed and edited for television and desktop are typically created and viewed in landscape aspect ratios (16:9 or 4:3). However, with an increasing number of users creating and consuming content on mobile devices, historical aspect ratios don’t always fit the display being used for viewing. Traditional approaches for reframing video to different aspect ratios usually involve static cropping, i.e., specifying a camera viewport, then cropping visual contents that are outside. Unfortunately, these static cropping approaches often lead to unsatisfactory results due to the variety of composition and camera motion styles. More bespoke approaches, however, typically require video curators to manually identify salient contents on each frame, track their transitions from frame-to-frame, and adjust crop regions accordingly throughout the video. This process is often tedious, time-consuming, and error-prone.

To address this problem, we are happy to announce AutoFlip, an open source framework for intelligent video reframing. AutoFlip is built on top of the MediaPipe framework that enables the development of pipelines for processing time-series multimodal data. Taking a video (casually shot or professionally edited) and a target dimension (landscape, square, portrait, etc.) as inputs, AutoFlip analyzes the video content, develops optimal tracking and cropping strategies, and produces an output video with the same duration in the desired aspect ratio.
Left: Original video (16:9). Middle: Reframed using a standard central crop (9:16). Right: Reframed with AutoFlip (9:16). By detecting the subjects of interest, AutoFlip is able to avoid cropping off important visual content.
AutoFlip Overview
AutoFlip provides a fully automatic solution to smart video reframing, making use of state-of-the-art ML-enabled object detection and tracking technologies to intelligently understand video content. AutoFlip detects changes in the composition that signify scene changes in order to isolate scenes for processing. Within each shot, video analysis is used to identify salient content before the scene is reframed by selecting a camera mode and path optimized for the contents.
Shot (Scene) Detection
A scene or shot is a continuous sequence of video without cuts (or jumps). To detect the occurrence of a shot change, AutoFlip computes the color histogram of each frame and compares this with prior frames. If the distribution of frame colors changes at a different rate than a sliding historical window, a shot change is signaled. AutoFlip buffers the video until the scene is complete before making reframing decisions, in order to optimize the reframing for the entire scene.

Video Content Analysis
We utilize deep learning-based object detection models to find interesting, salient content in the frame. This content typically includes people and animals, but other elements may be identified, depending on the application, including text overlays and logos for commercials, or motion and ball detection for sports.

The face and object detection models are integrated into AutoFlip through MediaPipe, which uses TensorFlow Lite on CPU. This structure allows AutoFlip to be extensible, so developers may conveniently add new detection algorithms for different use cases and video content. Each object type is associated with a weight value, which defines its relative importance — the higher the weight, the more influence the feature will have when computing the camera path.
Left: People detection on sports footage. Right: Two face boxes (‘core’ and ‘all’ face landmarks). In narrow portrait crop cases, often only the core landmark box can fit.
Reframing
After identifying the subjects of interest on each frame, logical decisions about how to reframe the content for a new view can be made. AutoFlip automatically chooses an optimal reframing strategy — stationary, panning or tracking — depending on the way objects behave during the scene (e.g., moving around or stationary). In stationary mode, the reframed camera viewport is fixed in a position where important content can be viewed throughout the majority of the scene. This mode can effectively mimic professional cinematography in which a camera is mounted on a stationary tripod or where post-processing stabilization is applied. In other cases, it is best to pan the camera, moving the viewport at a constant velocity. The tracking mode provides continuous and steady tracking of interesting objects as they move around within the frame.

Based on which of these three reframing strategies the algorithm selects, AutoFlip then determines an optimal cropping window for each frame, while best preserving the content of interest. While the bounding boxes track the objects of focus in the scene, they typically exhibit considerable jitter from frame-to-frame and, consequently, are not sufficient to define the cropping window. Instead, we adjust the viewport on each frame through the process of Euclidean-norm optimization, in which we minimize the residuals between a smooth (low-degree polynomial) camera path and the bounding boxes.
Top: Camera paths resulting from following the bounding boxes from frame-to-frame. Bottom: Final smoothed camera paths generated using Euclidean-norm path formation. Left: Scene in which objects are moving around, requiring a tracking camera path. Right: Scene where objects stay close to the same position; a stationary camera covers the content for the full duration of the scene.
AutoFlip’s configuration graph provides settings for either best-effort or required reframing. If it becomes infeasible to cover all the required regions (for example, when they are too spread out on the frame), the pipeline will automatically switch to a less aggressive strategy by applying a letterbox effect, padding the image to fill the frame. For cases where the background is detected as being a solid color, this color is used to create seamless padding; otherwise a blurred version of the original frame is used.
AutoFlip Use Cases
We are excited to release this tool directly to developers and filmmakers, reducing the barriers to their design creativity and reach through the automation of video editing. The ability to adapt any video format to various aspect ratios is becoming increasingly important as the diversity of devices for video content consumption continues to rapidly increase. Whether your use case is portrait to landscape, landscape to portrait, or even small adjustments like 4:3 to 16:9, AutoFlip provides a solution for intelligent, automated and adaptive video reframing.
What’s Next?
Like any machine learning algorithm, AutoFlip can benefit from an improved ability to detect objects relevant to the intent of the video, such as speaker detection for interviews or animated face detection on cartoons. Additionally, a common issue arises when input video has important overlays on the edges of the screen (such as text or logos) as they will often be cropped from the view. By combining text/logo detection and image inpainting technology, we hope that future versions of AutoFlip can reposition foreground objects to better fit the new aspect ratios. Lastly, in situations where padding is required, deep uncrop technology could provide improved ability to expand beyond the original viewable area.

While we work to improve AutoFlip internally at Google, we encourage contributions from developers and filmmakers in the open source communities.

Acknowledgments
We would like to thank our colleagues who contributed to Autoflip, Alexander Panagopoulos, Jenny Jin, Brian Mulford, Yuan Zhang, Alex Chen, Xue Yang, Mickey Wang, Justin Parra, Hartwig Adam, Jingbin Wang, and Weilong Yang; MediaPipe team who helped with open sourcing, Jiuqiang Tang, Tyler Mullen, Mogan Shieh, Ming Guang Yong, and Chuo-Ling Chang.

Source: Google AI Blog


Learning to See Transparent Objects


Optical 3D range sensors, like RGB-D cameras and LIDAR, have found widespread use in robotics to generate rich and accurate 3D maps of the environment, from self-driving cars to autonomous manipulators. However, despite the ubiquity of these complex robotic systems, transparent objects (like a glass container) can confound even a suite of expensive sensors that are commonly used. This is because optical 3D sensors are driven by algorithms that assume all surfaces are Lambertian, i.e., they reflect light evenly in all directions, resulting in a uniform surface brightness from all viewing angles. However, transparent objects violate this assumption, since their surfaces both refract and reflect light. Hence, most of the depth data from transparent objects are invalid or contain unpredictable noise.
Transparent objects often fail to be detected by optical 3D sensors. Top, Right: For instance, glass bottles do not show up in the 3D depth imagery captured from an Intel® RealSense™ D415 RGB-D camera. Bottom: A 3D visualization via point clouds constructed from the depth image.
Enabling machines to better sense transparent surfaces would not only improve safety, but could also open up a range of new interactions in unstructured applications — from robots handling kitchenware or sorting plastics for recycling, to navigating indoor environments or generating AR visualizations on glass tabletops.

To address this problem, we teamed up with researchers from Synthesis AI and Columbia University to develop ClearGrasp, a machine learning algorithm that is capable of estimating accurate 3D data of transparent objects from RGB-D images. This is made possible by a large-scale synthetic dataset that we are also releasing publicly today. ClearGrasp can work with inputs from any standard RGB-D camera, using deep learning to accurately reconstruct the depth of transparent objects and generalize to completely new objects unseen during training. This in contrast to previous methods, which required prior knowledge of the transparent objects (e.g., their 3D models), often combined with maps of background lighting and camera positions. In this work, we also demonstrate that ClearGrasp can benefit robotic manipulation by incorporating it into our pick and place robot’s control system, where we observe significant improvements in the grasping success rate of transparent plastic objects.
ClearGrasp uses deep learning to recover accurate 3D depth data of transparent surfaces.
A Visual Dataset of Transparent Objects
Massive quantities of data are required to train any effective deep learning model (e.g., ImageNet for vision or Wikipedia for BERT), and ClearGrasp is no exception. Unfortunately, no datasets are available with 3D data of transparent objects. Existing 3D datasets like Matterport3D or ScanNet overlook transparent surfaces, because they require expensive and time-consuming labeling processes.

To overcome this issue, we created our own large-scale dataset of transparent objects that contains more than 50,000 photorealistic renders with corresponding surface normals (representing the surface curvature), segmentation masks, edges, and depth, useful for training a variety of 2D and 3D detection tasks. Each image contains up to five transparent objects, either on a flat ground plane or inside a tote, with various backgrounds and lighting.

Some example data of transparent objects from the ClearGrasp synthetic dataset.
We also include a test set of 286 real-world images with corresponding ground truth depth. The real-world images were taken by a painstaking process of replacing each transparent object in the scene with a painted one in the same pose. The images are captured under a number of different indoor lighting conditions, using various cloth and veneer backgrounds and containing random opaque objects scattered around the scene. They contain both known objects, present in the synthetic training set, and novel objects.
Left: The real-world image capturing setup, Middle: Custom user interface enables precisely replacing each transparent object with a spray-painted duplicate, Right: Example of captured data.
The Challenge
While the distorted view of the background seen through transparent objects confounds typical depth estimation approaches, there are clues that hint at the objects’ shape. Transparent surfaces exhibit specular reflections, which are mirror-like reflections that show up as bright spots in a well-lit environment. Since these visual cues are prominent in RGB images and are influenced primarily by the shape of the objects, convolutional neural networks can use these reflections to infer accurate surface normals, which then can be used for depth estimation.
Specular reflections on transparent objects create distinct features that vary based on the object shape and provide strong visual cues for estimating surface normals.
Most machine learning algorithms try to directly estimate depth from a monocular RGB image. However, monocular depth estimation is an ill-posed task, even for humans. We observed large errors in estimating the depth of flat background surfaces, which compounds the error in depth estimates for the transparent objects resting atop them. Therefore, rather than directly estimating the depth of all geometry, we conjectured that correcting the initial depth estimates from an RGB-D 3D camera is more practical — it would enable us to use the depth from the non-transparent surfaces to inform the depth of transparent surfaces.

The ClearGrasp Algorithm
ClearGrasp uses 3 neural networks: a network to estimate surface normals, one for occlusion boundaries (depth discontinuities), and one that masks transparent objects. The mask is used to remove all pixels belonging to transparent objects, so that the correct depths can be filled in. We then use a global optimization module that starts extending the depth from known surfaces, using the predicted surface normals to guide the shape of the reconstruction, and the predicted occlusion boundaries to maintain the separation between distinct objects.
Overview of our method. The point cloud was generated using the output depth and is colored with its surface normals.
Each of the neural networks was trained on our synthetic dataset and they performed well on real-world transparent objects. However, the surface normal estimations for other surfaces, like walls or fruits, were poor. This is because of the limitations of our synthetic dataset, which contains only transparent objects on a ground plane. To alleviate this issue, we included some real indoor scenes from the Matterport3D and ScanNet datasets in the surface normals training loop. By training on both the in-domain synthetic dataset and out-of-domain real word dataset, the model performed well on all surfaces in our test set.
Surface Normal estimation on real images when trained on a) Matterport3D and ScanNet only (MP+SN), b) our synthetic dataset only, and c) MP+SN as well as our synthetic dataset. Note how the model trained on MP+SN fails to detect the transparent objects. The model trained on only synthetic data picks up the real plastic bottles remarkably well, but fails for other objects and surfaces. When trained on both, our model gets the best of both worlds.
Results
Overall, our quantitative experiments show that ClearGrasp is able to reconstruct depth for transparent objects with much higher fidelity than alternative methods. Despite being trained on only synthetic transparent objects, we find our models are able to adapt well to the real-world domain — achieving very similar quantitative reconstruction performance on known objects across domains. Our models also generalize well to novel objects with complex shapes never seen before.

To check the qualitative performance of ClearGrasp, we construct 3D point clouds from the input and output depth images, as shown below (additional examples available on the project webpage). The resulting estimated 3D surfaces have clean and coherent reconstructed shapes — important for applications, such as 3D mapping and 3D object detection — without the jagged noise seen in monocular depth estimation methods. Our models are robust and perform well in challenging conditions, such as identifying transparent objects situated in a patterned background or differentiating between transparent objects partially occluding one another.
Qualitative results on real images. Top two rows: results on known objects. Bottom two rows: results on novel objects. The point clouds, colored with their surface normals, are generated from the corresponding depth images.
Most importantly, the output depth from ClearGrasp can be directly used as input to state-of-the-art manipulation algorithms that use RGB-D images. By using ClearGrasp’s output depth estimates instead of the raw sensor data, our grasping algorithm on a UR5 robot arm saw significant improvements in the grasping success rates of transparent objects. When using the parallel-jaw gripper, the success rate improved from a baseline of 12% to 74%, and from 64% to 86% with suction.
Manipulation of novel transparent objects using ClearGrasp. Note the challenging conditions: textureless background, complex object shapes and the directional light causing confusing shadows and caustics (the patterns of light that occur when light rays are reflected or refracted from a surface).
Limitations & Future Work
A limitation of our synthetic dataset is that it does not represent accurate caustics, due to the limitations of rendering with traditional path-tracing algorithms. As a result, our models confuse bright caustics coupled with shadows to be independent transparent objects. Despite these drawbacks, our work with ClearGrasp shows that synthetic data remains a viable approach to achieve competent results for learning-based depth reconstruction methods. A promising direction for future work is improving the domain transfer to real-world images by generating renders with physically-correct caustics and surface imperfections such as fingerprints.

With ClearGrasp, we demonstrate that high-quality renders can be used to successfully train models that perform well in the real world. We hope that our dataset will drive further research on data-driven perception algorithms for transparent objects. Download links and more example images can be found on our project website and our GitHub repository.

Acknowledgements
This research was done by Shreeyak Sajjan (Synthesis.ai), Matthew Moore (Synthesis.ai), Mike Pan (Synthesis.ai), Ganesh Nagaraja (Synthesis.ai), Johnny Lee, Andy Zeng, and Shuran Song (Columbia University). We would like to thank Ryan Hickman for managerial support, Ivan Krasin and Stefan Welker for fruitful technical discussions, Cameron (@camfoxmusic) for sharing 3D models of his potion bottles and Sharat Sajjan for helping with web design.

Source: Google AI Blog


Releasing the Drosophila Hemibrain Connectome — The Largest Synapse-Resolution Map of Brain Connectivity


A fundamental way to describe a complex system is to measure its “network” — the way individual parts connect and communicate with each other. For example, biologists study gene networks, social scientists study social networks and even search engines rely, in part, on analyzing the way web pages form a network by linking to one another.

In neuroscience, a long-standing hypothesis is that the connectivity between brain cells plays a major role in the function of the brain. While technical difficulties have historically been a barrier for neuroscientists trying to study brain networks in detail, this is beginning to change. Last year, we announced the first nanometer-resolution automated reconstruction of an entire fruit fly brain, which focused on the individual shape of the cells. However, this accomplishment didn't reveal information about their connectivity.

Today, in collaboration with the FlyEM team at HHMI’s Janelia Research Campus and several other research partners, we are releasing the “hemibrain” connectome, a highly detailed map of neuronal connectivity in the fly brain, along with a suite of tools for visualization and analysis. The hemibrain is derived from a 3D image of roughly half the fly brain, and contains verified connectivity between ~25,000 neurons that form more than twenty-million connections. To date, this is the largest synapse-resolution map of brain connectivity that has ever been produced, in any species. The goal of this project has been to produce a public resource that any scientist can use to advance their own work, similar to the fly genome, which was released twenty years ago and has become a fundamental tool in biology.
Fly brain regions contained within the hemibrain connectome. Also available: interactive version (example region: mushroom body).
Imaging, Reconstructing, and Proofreading the Hemibrain Connectome
Over a decade of research and development from numerous research partners was required to overcome the challenges in producing the hemibrain connectome. At Janelia, new methods were developed to stain the fly brain and then divide the tissue into separate 20-micron thick slabs. Each slab was then imaged at 8x8x8nm3 voxel-resolution using focused ion beam scanning electron microscopes customized for months-long continuous operation. Computational methods were developed to stitch and align the raw data into a coherent 26-trillion pixel 3D volume.

However, without an accurate 3D reconstruction of the neurons in a fly brain, producing a connectome from this type of imaging data is impossible. Forming a collaboration with Janelia in 2014, Google began working on the fly brain data, focused on automating 3D reconstruction to jointly work towards producing a connectome. After several iterations of technological development we devised a method called flood-filling networks (FFNs) and applied it towards reconstructing the entire hemibrain dataset. In the current project, we worked closely with our collaborators to optimize the reconstruction results to be more useful for generating a connectome (i.e., embedded within a proofreading and synaptic detection pipeline), rather than just showing the shape of the neurons.
A flood-filling network segmenting (tracing) part of a neuron in the fly hemibrain data.
FFNs were the first automated segmentation technology to yield reconstructions that were sufficiently accurate to enable the overall hemibrain project to proceed. This is because errors in automated reconstruction require correction by expert human “proofreaders,” and previous approaches were estimated to require tens of millions of hours of human effort. With FFNs, the hemibrain was proofread using hundreds of thousands of human hours: a two order-of-magnitude improvement. This (still substantial) proofreading effort was performed over two years by a team of highly skilled and dedicated annotators, using tools and workflows pioneered at Janelia for this purpose. For example, annotators used VR headsets and custom 3D object-editing tools to examine neuron shapes and fix errors in the automated reconstruction. These revisions were then used to retrain the FFN models, leading to revised and more accurate machine output.

Finally, after proofreading, the reconstruction was combined with automated synaptic detection in order to produce the hemibrain connectome. Janelia scientists manually labeled individual synapses and then trained neural network classifiers to automate the task. Generalization was improved through multiple rounds of labeling, and the results from two different network architectures were merged to produce robust classifications across the hemibrain.

Further details about producing the hemibrain can be found in HHMI’s press release.

What Is Being Released?
The focus of today’s announcement is a set of inter-related datasets and tools that enable any interested person to visually and programmatically study the fly connectome. Specifically, the following resources are available:
  • Terabytes of raw data, proofread 3D reconstruction, and synaptic annotations can be interactively visualized or downloaded in bulk.
  • A web-based tool neuPrint, which can be used to query the connectivity, partners, connection strengths and morphologies of any specified neurons.
  • A downloadable, compact representation of the connectome that is roughly a million-times smaller in bytes than the raw data from which it was derived.
  • Documentation and video tutorials explaining the use of these resources.
  • A pre-print with further details related to the production and analysis of the hemibrain connectome.
Next Steps
Researchers have begun using the hemibrain connectome to develop a more robust understanding of the drosophila nervous system. For example, a major brain circuit of interest is the “central complex” which integrates sensory information and is involved in navigation, motor control, and sleep:
A detailed view of “ring neurons” in the central complex of the fly brain, one of many neural circuits that can be studied using the hemibrain reconstruction and connectome. Interactive version: ring neurons and ellipsoid body.
Another circuit that is being intensely studied is the “mushroom body,” a primary site of learning and memory in the drosophila brain whose detailed structure is contained within the hemibrain connectome (interactive visualization).

Acknowledgements
We would like to acknowledge core contributions from Tim Blakely, Laramie Leavitt, Peter Li, Larry Lindsey, Jeremy Maitin-Shepard (Google), Stuart Berg, Gary Huang, Bill Katz, Chris Ordish, Stephen Plaza, Pat Rivlin, Shin-ya Takemura (Janelia collaborators who worked closely with Google’s team), and other amazing collaborators at Janelia and elsewhere who were involved in the hemibrain project.

Source: Google AI Blog


Using Machine Learning to “Nowcast” Precipitation in High Resolution


The weather can affect a person’s daily routine in both mundane and serious ways, and the precision of forecasting can strongly influence how they deal with it. Weather predictions can inform people about whether they should take a different route to work, if they should reschedule the picnic planned for the weekend, or even if they need to evacuate their homes due to an approaching storm. But making accurate weather predictions can be particularly challenging for localized storms or events that evolve on hourly timescales, such as thunderstorms.

In “Machine Learning for Precipitation Nowcasting from Radar Images,” we are presenting new research into the development of machine learning models for precipitation forecasting that addresses this challenge by making highly localized “physics-free” predictions that apply to the immediate future. A significant advantage of machine learning is that inference is computationally cheap given an already-trained model, allowing forecasts that are nearly instantaneous and in the native high resolution of the input data. This precipitation nowcasting, which focuses on 0-6 hour forecasts, can generate forecasts that have a 1km resolution with a total latency of just 5-10 minutes, including data collection delays, outperforming traditional models, even at these early stages of development.

Moving Beyond Traditional Weather Forecasting
Weather agencies around the world have extensive monitoring facilities. For example, Doppler radar measures precipitation in real-time, weather satellites provide multispectral imaging, ground stations measure wind and precipitation directly, etc. The figure below, which compares false-color composite radar imaging of precipitation over the continental US to cloud cover imaged by geosynchronous satellites, illustrates the need for multi-source weather information. The existence of rain is related to, but not perfectly correlated with, the existence of clouds, so inferring precipitation from satellite images alone is challenging.
Top: Image showing the location of clouds as measured by geosynchronous satellites. Bottom: Radar image showing the location of rain as measured by Doppler radar stations. (Credit: NOAA, NWS, NSSL)
Unfortunately, not all of these measurements are equally present across the globe. For example, radar data comes largely from ground stations and is generally not available over the oceans. Further, coverage varies geographically, and some locations may have poor radar coverage even when they have good satellite coverage.

Even so, there is so much observational data in so many different varieties that forecasting systems struggle to incorporate it all. In the US, remote sensing data collected by the National Oceanic and Atmospheric Administration (NOAA) is now reaching 100 terabytes per day. NOAA uses this data to feed the massive weather forecasting engines that run on supercomputers to provide 1- to 10-day global forecasts. These engines have been developed over the course of the last half century, and are based on numerical methods that directly simulate physical processes, including atmospheric dynamics and numerous effects like thermal radiation, vegetation, lake and ocean effects, and more.

However, the availability of computational resources limits the power of numerical weather prediction in several ways. For example, computational demands limit the spatial resolution to about 5 kilometers, which is not sufficient for resolving weather patterns within urban areas and agricultural land. Numerical methods also take multiple hours to run. If it takes 6 hours to compute a forecast, that allows only 3-4 runs per day and resulting in forecasts based on 6+ hour old data, which limits our knowledge of what is happening right now. By contrast, nowcasting is especially useful for immediate decisions from traffic routing and logistics to evacuation planning.

Radar-to-Radar Forecasting
As a typical example of the type of predictions our system can generate, consider the radar-to-radar forecasting problem: given a sequence of radar images for the past hour, predict what the radar image will be N hours from now, where N typically ranges from 0-6 hours. Since radar data is organized into images, we can pose this prediction as a computer vision problem, inferring the meteorological evolution from the sequence of input images. At these short timescales, the evolution is dominated by two physical processes: advection for the cloud motion, and convection for cloud formation, both of which are significantly affected by local terrain and geography.
Top (left to right): The first three panels show radar images from 60 minutes, 30 minutes, and 0 minutes before now, the point at which a prediction is desired. The right-most panel shows the radar image 60 minutes after now, i.e., the ground truth for a nowcasting prediction. Bottom Left: For comparison, a vector field induced from applying an optical flow (OF) algorithm for modeling advection to the data from the first three panels above. Optical flow is a computer vision method that was developed in the 1940s, and is frequently used to predict short term weather evolution. Bottom Right: An example prediction made by OF. Notice that it tracks the motion of the precipitation in the bottom left corner well, but fails to account for the decaying strength of the storm.
We use a data-driven physics-free approach, meaning that the neural network will learn to approximate the atmospheric physics from the training examples alone, not by incorporating a priori knowledge of how the atmosphere actually works. We treat weather prediction as an image-to-image translation problem, and leverage the current state-of-the-art in image analysis: convolutional neural networks (CNNs).

CNNs are usually composed of a linear sequence of layers, where each layer is a set of operations that transform some input image into a new output image. Often, a layer will change the number of channels and the overall resolution of the image it’s given, in addition to convolving the image with a set of convolutional filters. These filters are themselves small images (for us, they are typically only 3x3, or 5x5). Filters drive much of the power of CNNs, and result in operations like detecting edges, identifying meaningful patterns, etc.

A particularly effective type of CNN is the U-Net. U-Nets have a sequence of layers that are arranged in an encoding phase, in which layers iteratively decrease the resolution of the images passing through them, and then a decoding phase in which the low-dimensional representations of the image created by the encoding phase are expanded back to higher resolutions. The following figure shows all of the layers in our particular U-Net.
(A) The overall structure of our U-NET. Blue boxes correspond to basic CNN layers. Pink boxes correspond to down-sample layers. Green boxes correspond to up-sample layers. Solid lines indicate input connections between layers. Dashed lines indicate long skip connections transversing the encoding and decoding phases of the U-NET. Dotted lines indicate short skip connections for individual layers. (B) The operations within our basic layer. (C) The operations within our down-sample layers. (D) The operations within our up-sample layers.
The input to the U-Net is an image that contains one channel for each multispectral satellite image in the sequence of observations over the last hour. For example, if there were 10 satellite images collected in the last hour, and each of those multispectral images was taken at 10 different wavelengths, then the image input for our model would be an image with 100 channels. For radar-to-radar forecasting, the input is a sequence of 30 radar observations over the past hour, spaced 2 minutes apart, and the output contains the prediction for N hours from now. For our initial work in the US, we trained a network from historical observations over the continental US from the period between 2017 and 2019. The data is split into periods of four weeks, where the first three weeks of each period are used for training and the fourth week is used for evaluation.

Results
We compare our results with three widely used models. First, the High Resolution Rapid Refresh (HRRR) numerical forecast from NOAA. HRRR actually contains predictions for many different weather quantities. We compared our results to their 1-hour total accumulated surface precipitation prediction, as that was their highest quality 1-hour precipitation prediction. Second, an optical flow (OF) algorithm, which attempts to track moving objects through a sequence of images. This latter approach is often applied to weather prediction even though it makes the assumption that overall rain quantities over large areas are constant over the prediction time — an assumption that is clearly violated. Third, the so-called persistence model, is the trivial model in which each location is assumed to be raining in the future at the same rate it is raining now, i.e. the precipitation pattern does not change. That may seem like an overly simplistic model to compare to, but it is common practice given the difficulty of weather prediction.
A visualization of predictions made over the course of roughly one day. Left: The 1-hour HRRR prediction made at the top of each hour, the limit to how often HRRR provides predictions. Center: The ground truth, i.e., what we are trying to predict. Right: The predictions made by our model. Our predictions are every 2 minutes (displayed here every 15 minutes) at roughly 10 times the spatial resolution made by HRRR. Notice that we capture the general motion and general shape of the storm.
We use precision and recall (PR) graphs to compare the models. Since we have direct access to our own classifier, we provide a full PR curve (seen as the blue line in the figure below). However, since we don’t have direct access to the HRRR model, and since neither the persistence model nor OF have the ability to trade-off precision and recall, those models are represented only by individual points. As can be seen, the quality of our neural network forecast outperforms all three of these models (since the blue line is above all of the other model’s results). It is important to note, however, that the HRRR model begins to outperform our current results when the prediction horizon reaches roughly 5 to 6 hours.
Precision and recall (PR) curves comparing our results (solid blue line) with: optical flow (OF), the persistence model, and the HRRR 1-hour prediction. As we do not have direct access to their classifiers, we cannot provide a full PR curve for their results. Left: Predictions for light rain. Right: Predictions for moderate rain.
One of the advantages of the ML method is that predictions are effectively instantaneous, meaning that our forecasts are based on fresh data, while HRRR is hindered by computational latency of 1-3 hours. This leads to better forecasts for computer vision methods for very short term forecasting. In contrast, the numerical model used in HRRR can make better long term predictions, in part because it uses a full 3D physical model — cloud formation is harder to observe from 2D images, and so it is harder for ML methods to learn convective processes. It's possible that combining these two systems, our ML model for rapid forecasts and HRRR for long-term forecasts, could produce better results overall, an idea at the focus of our future work. We're also looking at applying ML directly to 3D observations. Regardless, immediate forecasting is a key tool for real-time planning, facilitating decisions and improving lives.

Acknowledgements
Thanks to Carla Bromberg, Shreya Agrawal, Cenk Gazen, John Burge, Luke Barrington, Aaron Bell, Anand Babu, Stephan Hoyer, Lak Lakshmanan, Brian Williams, Casper Sønderby, Nal Kalchbrenner, Avital Oliver, Tim Salimans, Mostafa Dehghani, Jonathan Heek, Lasse Espeholt, Sella Nevo, Avinatan Hassidim.

Source: Google AI Blog


Introducing the Next Generation of On-Device Vision Models: MobileNetV3 and MobileNetEdgeTPU


On-device machine learning (ML) is an essential component in enabling privacy-preserving, always-available and responsive intelligence. This need to bring on-device machine learning to compute and power-limited devices has spurred the development of algorithmically-efficient neural network models and hardware capable of performing billions of math operations per second, while consuming only a few milliwatts of power. The recently launched Google Pixel 4 exemplifies this trend, and ships with the Pixel Neural Core that contains an instantiation of the Edge TPU architecture, Google’s machine learning accelerator for edge computing devices, and powers Pixel 4 experiences such as face unlock, a faster Google Assistant and unique camera features. Similarly, algorithms, such as MobileNets, have been critical for the success of on-device ML by providing compact and efficient neural network models for mobile vision applications.

Today we are pleased to announce the release of source code and checkpoints for MobileNetV3 and the Pixel 4 Edge TPU-optimized counterpart MobileNetEdgeTPU model. These models are the culmination of the latest advances in hardware-aware AutoML techniques as well as several advances in architecture design. On mobile CPUs, MobileNetV3 is twice as fast as MobileNetV2 with equivalent accuracy, and advances the state-of-the-art for mobile computer vision networks. On the Pixel 4 Edge TPU hardware accelerator, the MobileNetEdgeTPU model pushes the boundary further by improving model accuracy while simultaneously reducing the runtime and power consumption.

Building MobileNetV3
In contrast with the hand-designed previous version of MobileNet, MobileNetV3 relies on AutoML to find the best possible architecture in a search space friendly to mobile computer vision tasks. To most effectively exploit the search space we deploy two techniques in sequence — MnasNet and NetAdapt. First, we search for a coarse architecture using MnasNet, which uses reinforcement learning to select the optimal configuration from a discrete set of choices. Then we fine-tune the architecture using NetAdapt, a complementary technique that trims under-utilized activation channels in small decrements. To provide the best possible performance under different conditions we have produced both large and small models.
Comparison of accuracy vs. latency for mobile models on the ImageNet classification task using the Google Pixel 4 CPU.
MobileNetV3 Search Space
The MobileNetV3 search space builds on multiple recent advances in architecture design that we adapt for the mobile environment. First, we introduce a new activation function called hard-swish (h-swish) which is based on the Swish nonlinearity function. The critical drawback of the Swish function is that it is very inefficient to compute on mobile hardware. So, instead we use an approximation that can be efficiently expressed as a product of two piecewise linear functions.
Next we introduce the mobile-friendly squeeze-and-excitation block, which replaces the classical sigmoid function with a piecewise linear approximation.

Combining h-swish plus mobile-friendly squeeze-and-excitation with a modified version of the inverted bottleneck structure introduced in MobileNetV2 yielded a new building block for MobileNetV3.
MobileNetV3 extends the MobileNetV2 inverted bottleneck structure by adding h-swish and mobile friendly squeeze-and-excitation as searchable options.
These parameters defined the search space used in constructing MobileNetV3:
  • Size of expansion layer
  • Degree of squeeze-excite compression
  • Choice of activation function: h-swish or ReLU
  • Number of layers for each resolution block
We also introduced a new efficient last stage at the end of the network that further reduced latency by 15%.
MobileNetV3 Object Detection and Semantic Segmentation
In addition to classification models, we also introduced MobileNetV3 object detection models, which reduced detection latency by 25% relative to MobileNetV2 at the same accuracy for the COCO dataset.

In order to optimize MobileNetV3 for efficient semantic segmentation, we introduced a low latency segmentation decoder called Lite Reduced Atrous Spatial Pyramid Pooling (LR-SPP). This new decoder contains three branches, one for low resolution semantic features, one for higher resolution details, and one for light-weight attention. The combination of LR-SPP and MobileNetV3 reduces the latency by over 35% on the high resolution Cityscapes Dataset.

MobileNet for Edge TPUs
The Edge TPU in Pixel 4 is similar in architecture to the Edge TPU in the Coral line of products, but customized to meet the requirements of key camera features in Pixel 4. The accelerator-aware AutoML approach substantially reduces the manual process involved in designing and optimizing neural networks for hardware accelerators. Crafting the neural architecture search space is an important part of this approach and centers around the inclusion of neural network operations that are known to improve hardware utilization. While operations such as squeeze-and-excite and swish non-linearity have been shown to be essential in building compact and fast CPU models, these operations tend to perform suboptimally on Edge TPU and hence are excluded from the search space. The minimalistic variants of MobileNetV3 also forgo the use of these operations (i.e., squeeze-and-excite, swish, and 5x5 convolutions) to allow easier portability to a variety of other hardware accelerators such as DSPs and GPUs.

The neural network architecture search, incentivized to jointly optimize the model accuracy and Edge TPU latency, produces the MobileNetEdgeTPU model that achieves lower latency for a fixed accuracy (or higher accuracy for a fixed latency) than existing mobile models such as MobileNetV2 and minimalistic MobileNetV3. Compared with the EfficientNet-EdgeTPU model (optimized for the Edge TPU in Coral), these models are designed to run at a much lower latency on Pixel 4, albeit at the cost of some loss in accuracy.

Although reducing the model’s power consumption was not a part of the search objective, the lower latency of the MobileNetEdgeTPU models also helps reduce the average Edge TPU power use. The MobileNetEdgeTPU model consumes less than 50% the power of the minimalistic MobileNetV3 model at comparable accuracy.
Left: Comparison of the accuracy on the ImageNet classification task between MobileNetEdgeTPU and other image classification networks designed for mobile when running on Pixel4 Edge TPU. MobileNetEdgeTPU achieves higher accuracy and lower latency compared with other models. Right: Average Edge TPU power in Watts for different classification models running at 30 frames per second (fps).
Objection Detection Using MobileNetEdgeTPU
The MobileNetEdgeTPU classification model also serves as an effective feature extractor for object detection tasks. Compared with MobileNetV2 based detection models, MobileNetEdgeTPU models offer a significant improvement in model quality (measured as the mean average precision; mAP) on the COCO14 minival dataset at comparable runtimes on the Edge TPU. The MobileNetEdgeTPU detection model has a latency of 6.6ms and achieves mAP score of 24.3, while MobileNetV2-based detection models achieve an mAP of 22 and takes 6.8ms per inference.

The Need for Hardware-Aware Models
While the results shown above highlight the power, performance, and quality benefits of MobileNetEdgeTPU models, it is important to note that the improvements arise due to the fact that these models have been customized to run on the Edge TPU accelerator.
MobileNetEdgeTPU when running on a mobile CPU delivers inferior performance compared with the models that have been tuned specifically for mobile CPUs (MobileNetV3). MobileNetEdgeTPU models perform a much greater number of operations, and so, it is not surprising that they run slower on mobile CPUs, which exhibit a more linear relationship between a model’s compute requirements and the runtime.
MobileNetV3 is still the best performing network when using mobile CPU as the deployment target.
For Researchers and Developers
The MobileNetV3 and MobileNetEdgeTPU code, as well as both floating point and quantized checkpoints for ImageNet classification, are available at the MobileNet github page. Open source implementation for MobileNetV3 and MobileNetEdgeTPU object detection is available in the Tensorflow Object Detection API. Open source implementation for MobileNetV3 semantic segmentation is available in TensorFlow through DeepLab.

Acknowledgements:
This work is made possible through a collaboration spanning several teams across Google. We’d like to acknowledge contributions from Berkin Akin, Okan Arikan, Gabriel Bender, Bo Chen, Liang-Chieh Chen, Grace Chu, Eddy Hsu, John Joseph, Pieter-jan Kindermans, Quoc Le, Owen Lin, Hanxiao Liu, Yun Long, Ravi Narayanaswami, Ruoming Pang, Mark Sandler, Mingxing Tan, Vijay Vasudevan, Weijun Wang, Dong Hyuk Woo, Dmitry Kalenichenko, Yunyang Xiong, Yukun Zhu and support from Hartwig Adam, Blaise Agüera y Arcas, Chidu Krishnan and Steve Molloy.

Source: Google AI Blog


The Visual Task Adaptation Benchmark


Deep learning has revolutionized computer vision, with state-of-the-art deep networks learning useful representations directly from raw pixels, leading to unprecedented performance on many vision tasks. However, learning these representations from scratch typically requires hundreds of thousands of training examples. This burden can be reduced by using pre-trained representations, which have become widely available through services such as TensorFlow Hub (TF Hub) and PyTorch Hub. But their ubiquity can itself be a hindrance. For example, for the task of extracting features from images, there can be over 100 models from which to choose. It is hard to know which methods provide the best representations, since different sub-fields use different evaluation protocols, which do not always reflect the final performance on new tasks.

The overarching goal of representation research is to learn representations a single time on large amounts of generic data without the need to train them from scratch for each task, thus reducing data requirements across all vision tasks. But in order to reach that goal, the research community must have a uniform benchmark against which existing and future methods can be evaluated.

To address this problem, we are releasing "The Visual Task Adaptation Benchmark" (VTAB, available on GitHub), a diverse, realistic, and challenging representation benchmark based on one principle — a better representation is one that yields better performance on unseen tasks, with limited in-domain data. Inspired by benchmarks that have driven progress in other fields of machine learning (ML), such as ImageNet for natural image classification, GLUE for Natural Language Processing, and Atari for reinforcement learning, VTAB follows similar guidelines: (i) minimal constraints on solutions to encourage creativity; (ii) a focus on practical considerations; and (iii) challenging tasks for evaluation.

The Benchmark
VTAB is an evaluation protocol designed to measure progress towards general and useful visual representations, and consists of a suite of evaluation vision tasks that a learning algorithm must solve. These algorithms may use pre-trained visual representations to assist them and must satisfy only two requirements:
    i) They must not be pre-trained on any of the data (labels or input images) used in the downstream evaluation tasks.
    ii) They must not contain hardcoded, task-specific, logic. Alternatively put, the evaluation tasks must be treated like a test set — unseen.
These constraints ensure that solutions that are successful when applied to VTAB will be able to generalize to future tasks.

The VTAB protocol begins with the application of an algorithm (A) to a number of independent tasks, drawn from a broad distribution of vision problems. The algorithm may be pre-trained on upstream data to yield a model that contains visual representations, but it must also define an adaptation strategy that consumes a small training set for each downstream task and return a model that makes task-specific predictions. The algorithm’s final score is its average test score across tasks.
The VTAB protocol. Algorithm A is applied to many tasks T, drawn from a broad distribution of vision problems PT. In the example, pet classification, remote sensing, and maze localization are shown.
VTAB includes 19 evaluation tasks that span a variety of domains, divided into three groups — natural, specialized, and structured. Natural image tasks include images of the natural world captured through standard cameras, representing generic objects, fine-grained classes, or abstract concepts. Specialized tasks utilize images captured using specialist equipment, such as medical images or remote sensing. The structured tasks often derive from artificial environments that target understanding of specific changes between images, such as predicting the distance to an object in a 3D scene (e.g., DeepMind Lab), counting objects (e.g., CLEVR), or detecting orientation (e.g., dSprites for disentangled representations).

While highly diverse, all of the tasks in VTAB share one common feature — people can solve them relatively easily after training on just a few examples. To assess algorithmic generalization to new tasks with limited data, performance is evaluated using only 1000 examples per task. Evaluation using the full dataset can be performed for comparison with previous publications.

Findings Using VTAB
We performed a large scale study testing a number of popular visual representation learning algorithms against VTAB. The study included generative models (GANs and VAEs), self-supervised models, semi-supervised models and supervised models. All of the algorithms were pre-trained on the ImageNet dataset. We also compared each of these approaches using no pre-trained representations, i.e., training “from-scratch”. The figure below summarizes the main pattern of results.
Performance of different classes of representation learning algorithms across different task groups: natural, specialized and structured. Each bar shows the average performance of all methods in that class across all tasks in the group.
Overall we find that generative models do not perform as well as the other methods, even worse than from-scratch training. However, self-supervised models perform much better, significantly outperforming from-scratch training. Better still is supervised learning using the ImageNet labels. Interestingly, while supervised learning is significantly better on the Natural group of tasks, self-supervised learning is close on the other two groups whose domains are more dissimilar to ImageNet.

The best performing representation learning algorithm, of those we tested, is S4L, which combines both supervised and self-supervised pre-training losses. The figure below contrasts S4L with standard supervised ImageNet pre-training. S4L appears to improve performance particularly on the Structured tasks. However, representation learning yields a much smaller benefit over training from-scratch groups other than the Natural tasks, indicating that there is much progress required to attain a universal visual representation.
Top: Performance of S4L versus from-scratch training. Each bar corresponds to a task. Positive-valued bars indicate tasks where S4L outperforms from-scratch. Negative bars indicate that from-scratch performed better. Bottom: S4L versus Supervised training on ImageNet. Positive bars indicate that S4L performs better. The bar colour indicates the task group: Red=Natural, Green=Specialized, Blue=Structured. We can see that additional self-supervision tends to help on structured tasks beyond just using ImageNet labels.
Summary
The code to run VTAB is available on GitHub, including the 19 evaluation datasets and exact data splits. Having a publicly available set of benchmarks ensures the reproducibility of results. Progress is tracked with the public leaderboard, and the models evaluated are uploaded to TF Hub for public use and reproduction. A shell script is provided to perform adaptation and evaluation on all the tasks, with a standardized evaluation protocol making VTAB readily accessible across the industry. Since VTAB can be executed on both TPU and GPU, it is highly efficient. One can obtain comparable results with a single NVIDIA Tesla P100 accelerator in a few hours.

The Visual Task Adaptation Benchmark has helped us better understand which visual representations generalize to the broad spectrum of vision tasks, and provides direction for future research. We hope these resources are useful in driving progress toward general and practical visual representations, and as a result, affords deep learning to the long tail of vision problems with limited labelled data.

Acknowledgements
The core team behind this work includes Joan Puigcerver, Alexander Kolesnikov, Pierre Ruyssen, Carlos Riquelme, Mario Lucic, Josip Djolonga, Andre Susano Pinto, Maxim Neumann, Alexey Dosovitskiy, Lucas Beyer, Olivier Bachem, Michael Tschannen, Marcin Michalski, Olivier Bousquet, and Sylvain Gelly.

Source: Google AI Blog


Learning to Assemble and to Generalize from Self-Supervised Disassembly


Our physical world is full of different shapes, and learning how they are all interconnected is a natural part of interacting with our surroundings — for example, we understand that coat hangers hook onto clothing racks, power plugs insert into wall outlets, and USB cables fit into USB sockets. This general concept of “how things fit together'' based on their shapes is something that people acquire over time and experience, and it helps to increase the efficiency with which we perform tasks, like assembling DIY furniture kits or packing gifts into a box. If robots could learn “how things fit together,” then perhaps they could become more adaptable to new manipulation tasks involving objects they have never seen before, like reconnecting severed pipes, or building makeshift shelters by piecing together debris during disaster response scenarios.

To explore this idea, we worked with researchers from Stanford and Columbia Universities to develop Form2Fit, a robotic manipulation algorithm that uses deep neural networks to learn to visually recognize how objects correspond (or “fit”) to each other. To test this algorithm, we tasked a real robot to perform kit assembly, where it needed to accurately assemble objects into a blister pack or corrugated display to form a single unit. Previous systems built for this task required extensive manual tuning to assemble a single kit unit at a time. However, we demonstrate that by learning the general concept of “how things fit together,” Form2Fit enables our robot to assemble various types of kits with a 94% success rate. Furthermore, Form2Fit is one of the first systems capable of generalizing to new objects and kitting tasks not seen during training.
Form2Fit learns to assemble a wide variety of kits by finding geometric correspondences between object surfaces and their target placement locations. By leveraging geometric information learned from multiple kits during training, the system generalizes to new objects and kits.
While often overlooked, shape analysis plays an important role in manipulation, especially for tasks like kit assembly. In fact, the shape of an object often matches the shape of its corresponding space in the packaging, and understanding this relationship is what allows people to do this task with minimal guesswork. At its core, Form2Fit aims to learn this relationship by training over numerous pairs of objects and their corresponding placing locations across multiple different kitting tasks – with the goal to acquire a broader understanding of how shapes and surfaces fit together. Form2Fit improves itself over time with minimal human supervision, gathering its own training data by repeatedly disassembling completed kits through trial and error, then time-reversing the disassembly sequences to get assembly trajectories. After training overnight for 12 hours, our robot learns effective pick and place policies for a variety of kits, achieving 94% assembly success rates with objects and kits in varying configurations, and over 86% assembly success rates when handling completely new objects and kits.

Data-Driven Shape Descriptors For Generalizable Assembly
The core component of Form2Fit is a two-stream matching network that learns to infer orientation-sensitive geometric pixel-wise descriptors for objects and their target placement locations from visual data. These descriptors can be understood as compressed 3D point representations that encode object geometry, textures, and contextual task-level knowledge. Form2Fit uses these descriptors to establish correspondences between objects and their target locations (i.e., where they should be placed). Since these descriptors are orientation-sensitive, they allow Form2Fit to infer how the picked object should be rotated before it is placed in its target location.

Form2Fit uses two additional networks to generate valid pick and place candidates. A suction network gets fed a 3D image of the objects and generates pixel-wise predictions of suction success. The suction probability map is visualized as a heatmap, where hotter pixels indicate better locations to grasp the object at the 3D location of the corresponding pixel. In parallel, a place network gets fed a 3D image of the target kit and outputs pixel-wise predictions of placement success. These, too, are visualized as a heatmap, where higher confidence values serve as better locations for the robot arm to approach from a top-down angle to place the object. Finally, the planner integrates the output of all three modules to produce the final pick location, place location and rotation angle.
Overview of Form2Fit. The suction and place networks infer candidate picking and placing locations in the scene respectively. The matching network generates pixel-wise orientation-sensitive descriptors to match picking locations to their corresponding placing locations. The planner then integrates it all to control the robot to execute the next best pick and place action.
Learning Assembly from Disassembly
Neural networks require large amounts of training data, which can be difficult to collect for tasks like assembly. Precisely inserting objects into tight spaces with the correct orientation (e.g., in kits) is challenging to learn through trial and error, because the chances of success from random exploration can be slim. In contrast, disassembling completed units is often easier to learn through trial and error, since there are fewer incorrect ways to remove an object than there are to correctly insert it. We leveraged this difference in order to amass training data for Form2Fit.
An example of self-supervision through time-reversal: rewinding a disassembly sequence of a deodorant kit over time generates a valid assembly sequence.
Our key observation is that in many cases of kit assembly, a disassembly sequence – when reversed over time – becomes a valid assembly sequence. This concept, called time-reversed disassembly, enables Form2Fit to train entirely through self-supervision by randomly picking with trial and error to disassemble a fully-assembled kit, then reversing that disassembly sequence to learn how the kit should be put together.

Generalization Results
The results of our experiments show great potential for learning generalizable policies for assembly. For instance, when a policy is trained to assemble a kit in only one specific position and orientation, it can still robustly assemble random rotations and translations of the kit 90% of the time.
Form2Fit policies are robust to a wide range of rotations and translations of the kits.
We also find that Form2Fit is capable of tackling novel configurations it has not been exposed to during training. For example, when training a policy on two single-object kits (floss and tape), we find that it can successfully assemble new combinations and mixtures of those kits, even though it has never seen such configurations before.
Form2Fit policies can generalize to novel kit configurations such as multiple versions of the same kit and mixtures of different kits.
Furthermore, when given completely novel kits on which it has not been trained, Form2Fit can generalize using its learned shape priors to assemble those kits with over 86% assembly accuracy.
Form2Fit policies can generalize to never-before-seen single and multi-object kits.
What Have the Descriptors Learned?
To explore what the descriptors of the matching network from Form2Fit have learned to encode, we visualize the pixel-wise descriptors of various objects in RGB colorspace through use of an embedding technique called t-SNE.
The t-SNE embedding of the learned object descriptors. Similarly oriented objects of the same category display identical colors (e.g. A, B or F, G) while different objects (e.g. C, H) and same objects but different orientation (e.g. A, C, D or H, F) exhibit different colors.
We observe that the descriptors have learned to encode (a) rotation — objects oriented differently have different descriptors (A, C, D, E) and (H, F); (b) spatial correspondence — same points on the same oriented objects share similar descriptors (A, B) and (F, G); and (c) object identity — zoo animals and fruits exhibit unique descriptors (columns 3 and 4).

Limitations & Future Work
While Form2Fit’s results are promising, its limitations suggest directions for future work. In our experiments, we assume a 2D planar workspace to constrain the kit assembly task so that it can be solved by sequencing top-down picking and placing actions. This may not work for all cases of assembly – for example, when a peg needs to be precisely inserted at a 45 degree angle. It would be interesting to expand Form2Fit to more complex action representations for 3D assembly.

You can learn more about this work and download the code from our GitHub repository.


Acknowledgments
This research was done by Kevin Zakka, Andy Zeng, Johnny Lee, and Shuran Song (faculty at Columbia University), with special thanks to Nick Hynes, Alex Nichol, and Ivan Krasin for fruitful technical discussions; Adrian Wong, Brandon Hurd, Julian Salazar, and Sean Snyder for hardware support; Ryan Hickman for valuable managerial support; and Chad Richards for helpful feedback on writing.

Source: Google AI Blog