Today marks the release of the first version of Android Studio Arctic Fox (2020.3.1) on the canary channel, together with Android Gradle plugin (AGP) version 7.0.0-alpha01. With this release, we are adjusting the version numbering of Android Studio and our Gradle plugin. This change decouples the Gradle plugin from the Android Studio versioning scheme and brings more clarity to which year and IntelliJ version Android Studio aligns with for each release.
New versioning scheme - Android Studio
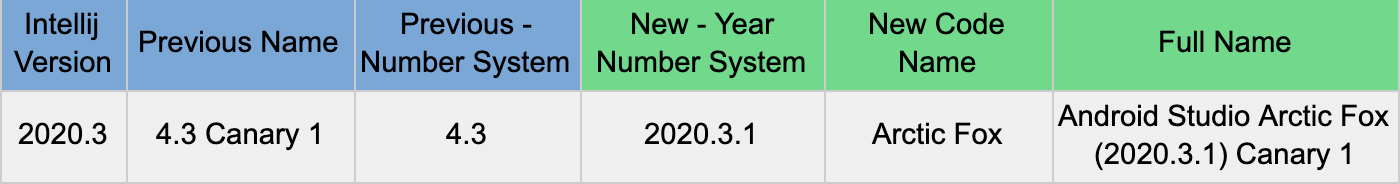
With Android Studio Arctic Fox (2020.3.1) we are moving to a year-based system that is more closely aligned with IntelliJ IDEA, the IDE upon which Android Studio is built. We are changing the version numbering scheme to encode a number of important attributes: the year, the version of IntelliJ it is based on, plus feature and patch level. WIth this name change you can quickly figure out which version of the IntelliJ platform you are using in Android Studio. In addition, each major version will have a canonical codename, starting with Arctic Fox, and then proceeding alphabetically to help make it easy to see which version is newer.
We recommend that you use the latest version of Android Studio so that you have access to the latest features and quality improvements. To make it easier to stay up to date, we made the version change to clearly de-couple Android Studio from your Android Gradle Plugin version. An important detail to keep in mind is that there is no impact to the way the build system compiles and packages your app when you update the IDE. In contrast, app build process changes and APK/Bundles are dictated by your project AGP version. Therefore, it is safe to update your Android Studio version, even late in your development cycle, because your project AGP version can be updated in a different cadence than your Android Studio version. Lastly, with the new version system it is even easier than before for you or your team to run both the stable and preview versions of Android Studio at the same time on your app project as long as you keep the AGP version on a stable release.
In the previous numbering system, this release would have been Android Studio 4.3. With the new numbering system, it is now Android Studio Arctic Fox (2020.3.1) Canary 1 or just, Arctic Fox.
Going forward, here is how the Android Studio version number scheme will work:
<Year of IntelliJ Version>.<IntelliJ major version>.<Studio major version>
The first two number groups represent the version of the final IntellIj platform that a particular Android Studio release is based on (earlier canaries may still be on the earlier version). For this release, this is 2020.3.
The third number group represents the Studio major version, starting at 1 and incrementing by one for every major release.
To make it easier to refer to each version, we are also giving major releases a code name, incrementing from A to Z based on animal names. This initial release name is Arctic Fox.
New versioning scheme - Android Gradle plugin
With AGP 7.0.0 we are adopting the principles of semantic versioning, and aligning with the Gradle version that AGP requires. Compatibility between Android Studio and Android Gradle plugin remains unchanged. Projects that use stable versions of AGP can be opened with newer versions of Android Studio.
We will publish another post soon with more details about our AGP versioning philosophy and what is new in AGP 7.0.
What is new in Android Studio Arctic Fox
We are in early days in the feature development phase for Arctic Fox, but we have invested much of our time in addressing over 200 quality improvements and bugs across a wide range of areas in the IDE from the code editor, app inspection tools, layout editor to the embedded emulator. Check out the release notes for the specific bug fixes.
For those trying out Jetpack Compose, we have a host of new updates, like deploy @Preview composables to device/emulator:
Deploy preview composable
Also try out the new Layout Validation Tool in Arctic Fox to see how your layout responds to various screens sizes, font sizes, and Android Color Correction/Color Blind Modes. You can access this via the Layout Validation tool window when you are using the Layout Editor.
Layout Validation
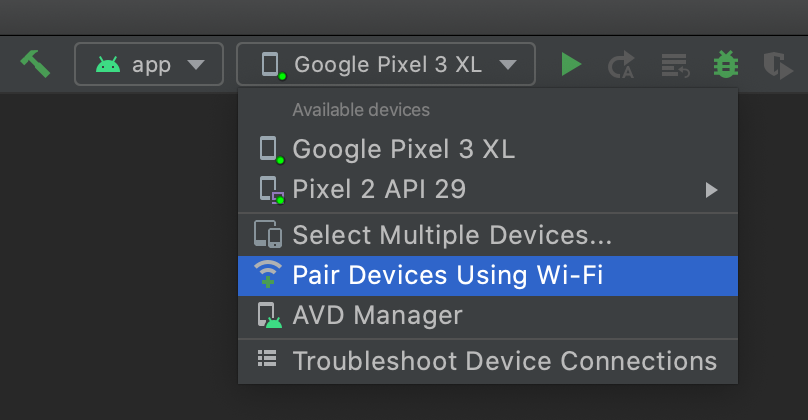
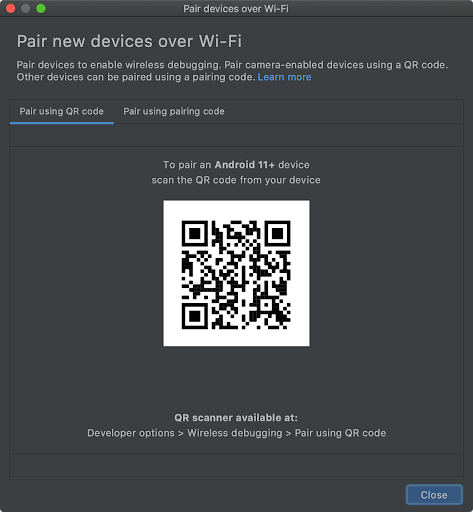
Lastly, for those running MacOS (other platforms are coming soon) with the latest Android Platform tools and an Android 11 device, you can try out the IDE integration for the Wireless ADB feature by going to the Run device selection dialogue → Pair Devices Using Wi-Fi.
Menu to access Wireless ADB feature
Wireless ADB Setup Window
What’s Next
If you want to learn more about other detailed changes coming with this release for both Android Studio and the Android Gradle plugin, make sure to take a look at the release notes.
This blog post is part of a weekly series for #11WeeksOfAndroid. For each of the #11WeeksOfAndroid, we’re diving into a key area so you don’t miss anything. This week, we spotlighted Android Developer Tools; here’s a look at what you should know.
The big news
During the 11 weeks of Android, we launched a range of developer tool updates in Android Studio. As of today, you can find version 4.0 of Android Studio on the stable release channel, version 4.1 on the beta channel, and the very latest features of version 4.2 on the canary channel. The focus across each of these versions is a balance of app productivity and delivery of a high quality product that you can rely on for app development. For each day of this past week we highlighted improvements and tips in the key points of your development flow from app design, coding, deployment, build, app testing with the emulator, to app performance profiling. This blog highlights the content that we released during the Android Developer Tools week of 11 Weeks of Android.
What to watch and read
To see an overview of what is new in Android Developer Tools across the recent releases of Android Studio, check out this video from the #Android11 Beta launch which includes an exciting and in-depth demo.
What’s New in Android Development Tools
Design
At the beginning of the week we had a day of content focused on app design tools for developers. To start, watch this overview video of the latest updates in design tools:
What’s new in Design Tools
We also posted two in-depth blog posts for the design tools day:
Introducing the Motion Editor - provides a quick tour of the new Motion Editor and how to use the latest features to create animations for your app.
To debug your layouts, watch our video on the updates to the layout inspector:
Debugging UI issues with Layout Inspector
And lastly for design tools, we released a video about the latest developments for Jetpack Compose Design tools:
What's new in Compose Design Tools
Coding & Deployment
During the week, we posted tips and tricks to improve your coding experience and app deployment flow in Android Studio. Check out the following social media channels to review the latest postings:
@androidstudio - the Twitter channel for the official IDE for Android app development.
A next-gen code-shrinker needs smart editor features for your code shrinker rules. Studio 4.0 brings you syntax highlighting, code completion, and error checking when writing rules for R8! pic.twitter.com/5lSANdYm5F
@androiddev - delivers news and announcements for developers from the Android team at Google
? Crash reports made easy with Android Gradle plugin
Make your Android Vitals crash reports for production native code more actionable. The trick: packaging native debug symbols in your app bundle with a flip of a flag. #11WeeksOfAndroid
In the middle of the week, we released four blogs posts around the build system in Android developer tools, which included:
New APIs in the Android Gradle Plugin - details the new Domain Specific Language (DSL) interface and documents the new direction for extending the built-in build APIs.
Configuration Caching deep dive - a technical explanation on this new preview feature from Gradle and how to try it out in your project to speed up your builds.
Shrinking Your App with R8 - provides an overview of the features available in R8, the reduction in code size you might expect, and show how to enable these features in R8.
Android Emulator
On top of sharing a series of best practices and tips on social media about using the Android Emulator during the week, you can also a full summary in the following in-depth article:
Developing for Android 11 with the Android Emulator - outlines new feature areas like 5G connectivity and foldable device support, and other advantages for using the Android Emulator as a part of your daily development workflow.
Performance Profilers
We know improving app performance is critical for a great user experience. Therefore, we ended the week with a day on performance profilers content. To start, we posted a video about System Trace and how you can use it to troubleshoot app performance issues:
Troubleshooting app performance issues with System Trace in Android Studio
Plus, we published a blog post on C++ memory profiling:
If you’re looking for an easy way to pick up the highlights of this week, check out the Developer Tools pathway. A pathway is an ordered tutorial that allows users to complete a pre-defined module that culminates in a quiz. It includes videos and blog posts. A virtual badge is awarded to each user who passes the quiz. Test your knowledge of key takeaways about Developer Tools to earn a limited edition badge.
Key takeaways
Thank you for tuning in and learning about the latest in Android Development tools. Thanks to all of you who chatted with us during the Reddit AMA this week. Throughout this past week, we showcased features that can be found either in the latest stable release or the canary release channel of Android Studio. If you want to try out what you learned this week, download Android Studio today.
Below, you will find a quick listing of where you will find each of the major features. Note, that features in non-stable versions may not land in a particular version until they have reached our quality bar:
Features found in Android Studio 4.0 (Stable Channel)
Motion Editor
Layout Inspector
Layout Validation
Custom View Preview
CPU Profiler Update
R8 Rules Editing
Build Analyzer
Dynamic Feature Dependency
Clangd support
Intellij 2019.3
Features found in Android Studio 4.1 (Beta Channel)
Database Inspector
Dependency Injection Tools
Faster Apply Changes
Gradle Configuration Caching (Preview)
Custom View Preview
Android Emulator in IDE
Instrumentation Testing
Profiler UI Updates
Native Memory Profiling
System Trace 2.0
New Gradle API
MLKit & TFLite Model Import
Intellij 2020.1
Features found in Android Studio 4.2 + (Canary Channel)
Compose Interactive Preview
Compose Animation Visualization
Compose Deploy to Device
Sample Data API for Compose
Compose Editing Support
Test Failure Retention
Android Emulator- 5G Connectivity and Foldable Support
Intellij 2020.2 - coming soon
Resources
You can find the entire playlist of #11WeeksOfAndroid video content here, and learn more about each week here. We’ll continue to spotlight new areas each week, so keep an eye out and follow us on Twitter and YouTube. Thanks so much for letting us be a part of this experience with you!
Have you ever wished that Android Studio was faster, more performant, and more memory efficient? If so, then download Android Studio 3.5 today. This stable version of Android Studio is a different kind of release where the Android Studio team took a step back from large feature work for eight months and instead focused on product quality to further accelerate your day-to-day app development. We called this initiative Project Marble, and it focused on making the fundamental features and flows of Android Studio & Emulator rock-solid by looking at three core areas: system health, feature polish, and bugs. Working on Project Marble was is in direct response to feedback from you and we continue to welcome any further feedback you have.
To improve system health in Android Studio, we first created a new set of infrastructure and internal dashboards to better detect performance problems. We did this to establish a safety net to catch issues that are typically difficult to catch with regular unit testing. Then, the team addressed a range of issues from fixing over 600 bugs, 50 memory leaks, 20 IDE hangs, and improving XML & Kotlin typing latency. Additionally, for the Android Emulator, we decreased the CPU and memory impact on your development machine. Project Mable was a focused period to work on the IDE and Android Emulator system health but it also uncovered a set of quality areas we will continue to work on going forward.
On top of memory and performance, we spent time polishing and fixing core user facing feature areas. For example, we took a look at the app deployment flow to a device, and completely re-architectured and replaced Instant Run with Apply Changes so that it’s more reliable and trusted. With Apply Changes, we no longer modify an APK during your build but instead, we use runtime instrumentation to redefine classes on the fly. If you want to quickly edit code and see code changes, you should try Android Studio 3.5 today.
Lastly, over the course of Project Marble we fixed bugs which landed in Android Studio in 3.5. We are thankful to those who filed bug reports and engaged with us on social media. We are especially thankful for the over 40 external contributorsin the Android community that diligently worked with us in filing and resolving critical quality issues in Android Studio 3.5. Project Marble is not the end of quality work for the Android Studio team, but this latest stable release is a major milestone of our on-going quality investment into the IDE. With the quality work and new infrastructure put in place during Project Marble, we hope that you are even more productive in developing Android apps when you download and use Android Studio 3.5.
There are many quality changes we made to Android Studio 3.5. To see the full list of changes, see the Android Studio 3.5 beta release blog and release notes. But you can dive into some of the highlights of the changes below:
System Health
System health improvements during Project Marble was a combination of memory performance, typing & user interfaces freezes, build speed, CPU usage, and I/O performance. For each of these areas we created new ways to detect issues during development and a better process to analyze your feedback both from opt-in analytics and bugs that you file.
Our system health work has many under the hood improvements but a few notable changes include:
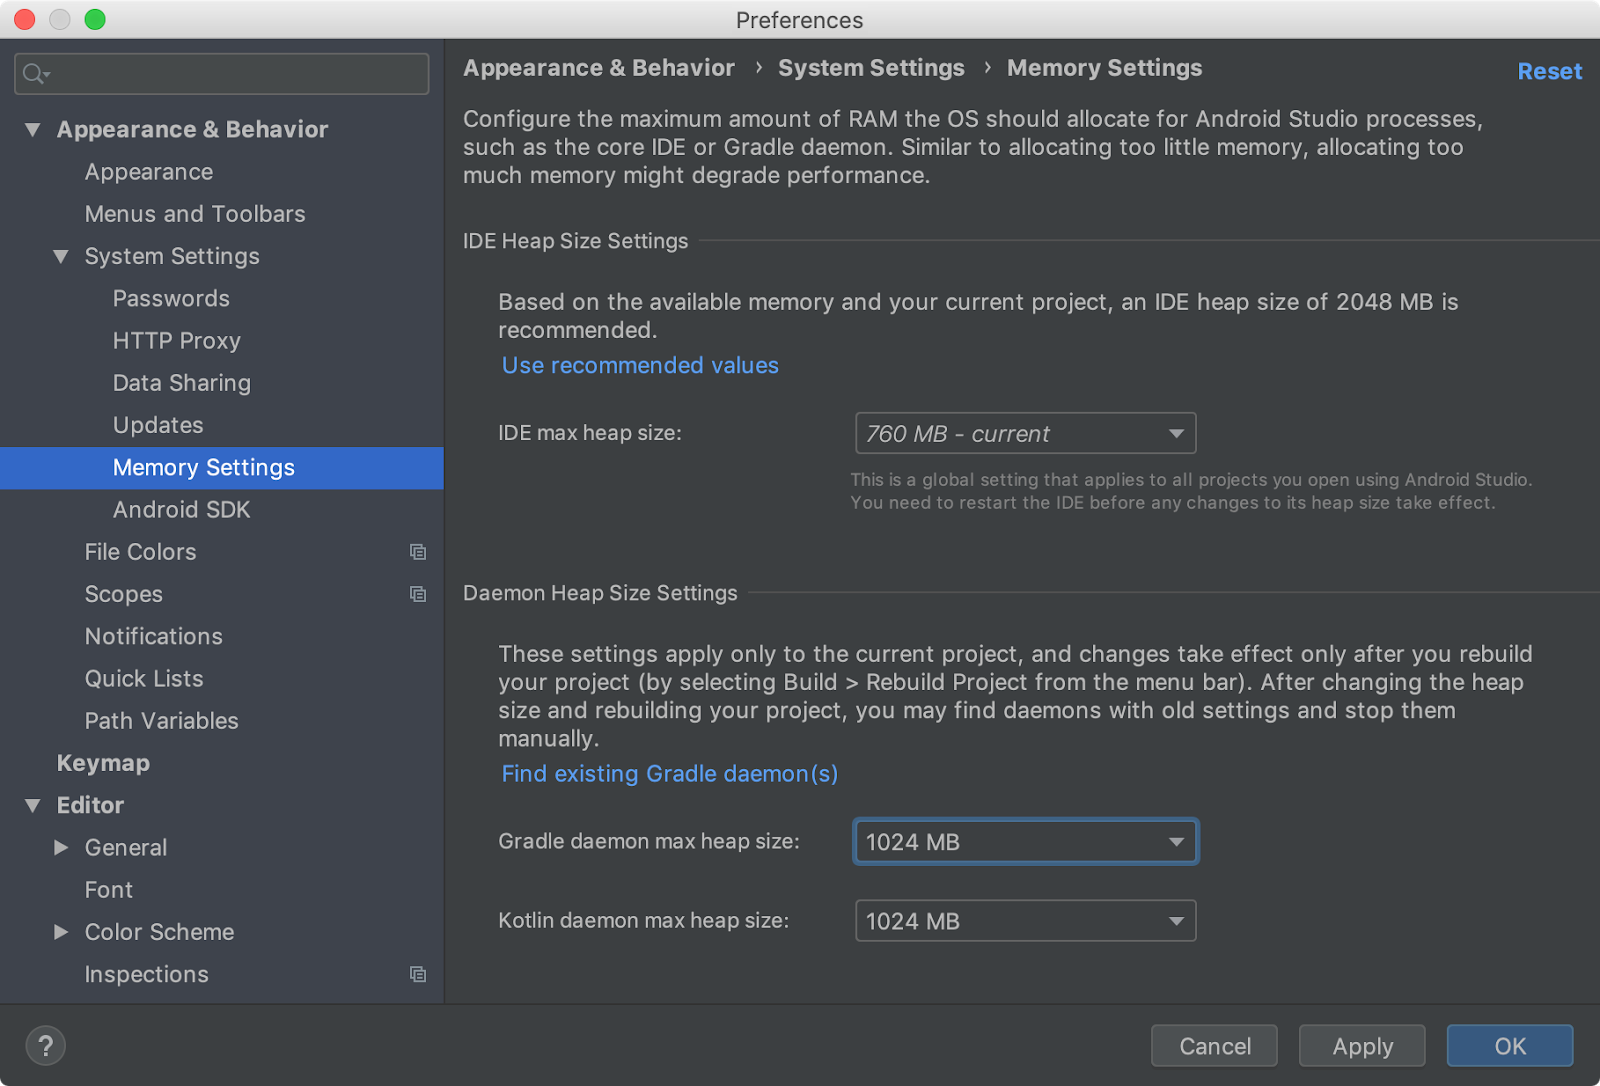
Auto-recommend Memory Settings
With Android Studio 3.5, the IDE will recognize when an app project needs more RAM on a machine with higher RAM capacity and will notify you to increase the memory heap size or you can adjust the settings yourself under Appearance & Behavior → Memory Settings.
Memory Settings
User Interface Freezes
During the Project Marble development timeframe, we found in our opt-in product analytics that XML code editing was notably slower in the IDE. With this data point, we optimized XML typing, and have measurably better performance in Android Studio 3.5. You can see below that editing data binding expressions in XML is faster due to typing latency improvements.
Code Editing Before - Android Studio 3.4
Code Editing After - Android Studio 3.5
Build Speed
For Android Studio 3.5 we made many speed improvements but a significant change is the addition of incremental build support to the top annotation processors including Glide, AndroidX data binding, Dagger, Realm, and Kotlin (KAPT). Incremental support can make a notable impact on build speed. Learn more here.
Disk I/O File Access Speed
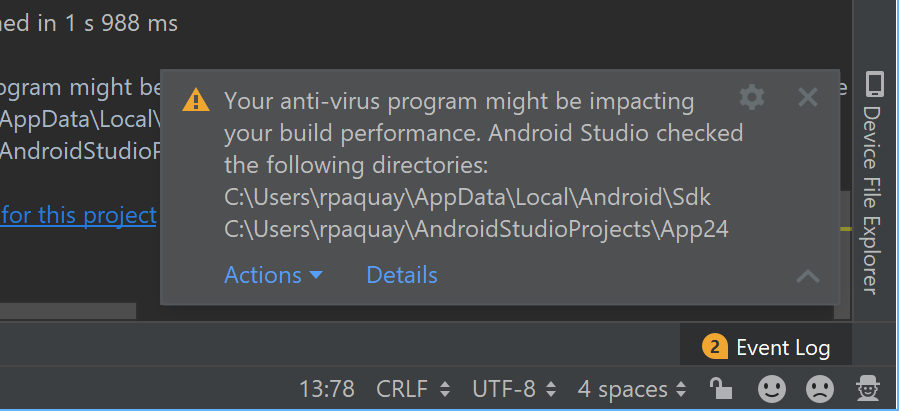
For users on Microsoft® Windows®, we found that disk I/O access times were notable higher on average than other platforms. Digging into the data, we found the default configuration of anti-virus scanners did not optimally exclude build output folders. In Android Studio 3.5, we detect this situation and help guide you through the optimal setup.
System Health Notification - Anti-virus Check
Feature Polish
In addition to improving system health we relooked at a few critical users flows to address bugs and user friction. The areas we looked at ranged from data binding, layout editor, ChromeOS support to project upgrades. One notable area of improvement to highlight is the app deployment flow:
Apply Changes
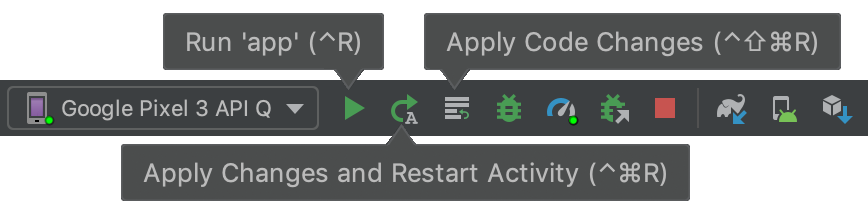
During the Project Marble time period, we removed Instant Run and re-architectured and implemented from the ground-up a more practical approach in Android Studio 3.5 called Apply Changes. Unlike Instant Run, Apply Changes does not modify your APK which means it is realbile and has a predictable behavior. To support the changes, we re-architected the entire deployment pipeline to improve deployment speed, and also tweaked the run and deployment toolbar buttons for a more streamlined experience.
Apply Changes Buttons
App Deployment User Flow
To recap, Android Studio 3.5 has hundreds of bug fixes and notable changes in these core areas:
System Health
Memory Settings
Memory Usage Report
Reduce Exceptions
User Interface Freezes
Build Speed
IDE Speed
Lint Code Analysis
I/O File Access
Emulator CPU Usage
Feature Polish
Apply Changes
Gradle Sync
Project Upgrades
Layout Editor
Data Binding
App Deployment
C++ Improvements
Intellij 2019.1 Platform Update
Conditional Delivery for Dynamic Feature Support
Emulator Foldables & Google Pixel Device Support
Chrome OS Support
Check our the Android Studio release notes page for more details and read about deep dives into several areas of Project Marble in the following Medium blog posts & Google I/O talk:
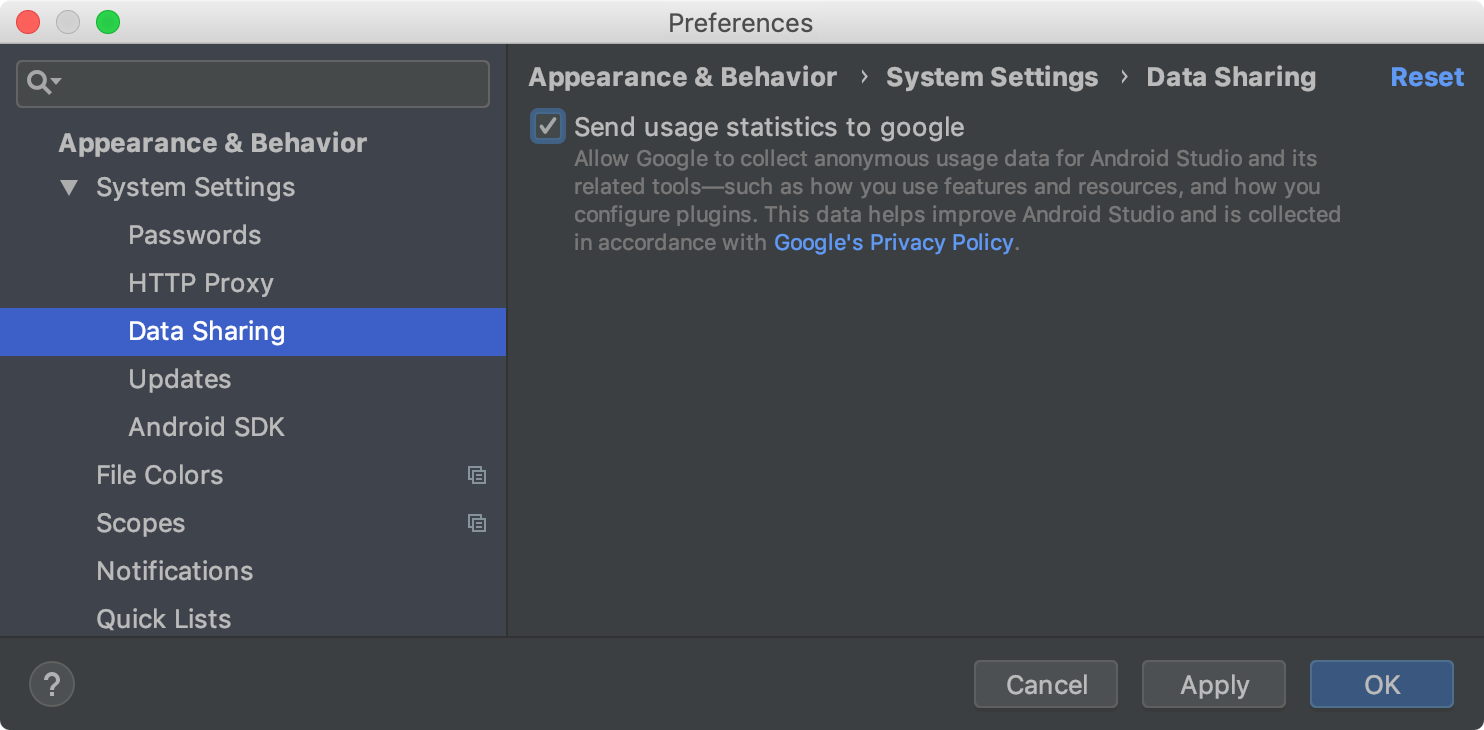
The specific areas and the approach we took to optimize Android Studio for Project Marble were all based on your feedback and metrics data. The aggregate metrics you can opt-in to inside of Android Studio allow us to figure out if there are broader problems in the product for all users, and the data also allows the team to prioritize feature work appropriately. There are are a couple pathways to help us build better insights. At a baseline, you can opt-in to metrics, by going to Preferences /Settings → Appearance & Behavior → Data Sharing.
IDE Data Sharing
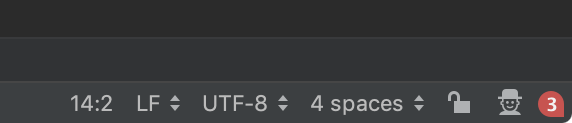
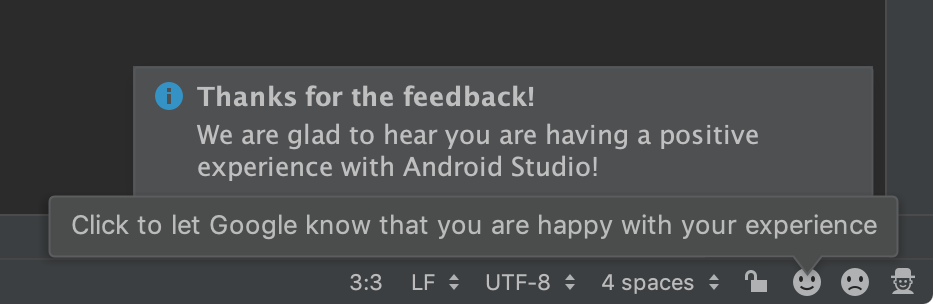
Additionally, throughout the year, you might see user sentiment emojis in the bottom corner of the IDE. Those icons are a lightweight way to inform the Android Studio team on how things are going and to give us in-context feedback, and the fastest way to log a bug and send to the team.
IDE User Feedback
Getting Started
Download
Download Android Studio 3.5 from the download page. If you are using a previous release of Android Studio, you can simply update to the latest version of Android Studio.
To use the mentioned Android Emulator features make sure you are running at least Android Emulator v29.1.9 downloaded via the Android Studio SDK Manager.
As mentioned above, we appreciate any feedback on things you like, and issues or features you would like to see. If you find a bug or issue, feel free to file an issue. Follow us -- the Android Studio development team ‐ on Twitter and on Medium.
Android Studio 3.5 Beta is ready to download today. Last year, at Google I/O, we heard from many of you that you wanted us to focus even more on quality and stability over features. Consequently, we kicked off Project Marble, focused on making the fundamental features and flows of the Integrated Development Environment (IDE) rock-solid. Android Studio 3.5 is the culmination of this effort. The results of Project Marble are focused on three core areas: system health, feature polish, and bugs. We are seeking your final round of feedback to make sure we didn't miss a key area that matters to you, so download Android Studio 3.5 on the beta channel today to let us know what you think.
Many times it can be difficult to see the range of changes that go into a quality release. Therefore, this post and our Google I/O talk on What’s New in Android Development Tools walk through a variety of changes in each of the major focus areas of Project Marble within Android Studio 3.5. We are certainly not done improving quality with Android Studio, but with the work and new infrastructure put into Project Marble for long term quality tracking we hope that you are even more productive in developing Android apps.
What's New in Android Development Tools (Google I/O'19)
System Health - Memory
One of the major points of feedback on Android Studio is how slow the IDE runs over time. Many times the reason behind this experience is due to unexpectedly reaching memory pressure or IDE memory leaks. We dug into this area, and as part of Project Marble, we have addressed over 33 impactful memory leaks. To identify leaks, we now measure out-of-memory exceptions on an internal dashboard on an on-going basis for those who opt-in to share data with us which enables us to focus and fix the most impactful issues. Starting with Android Studio 3.5, when the IDE runs out of memory, we capture some high level statistics about the size of the memory heap and dominant objects in the heap. With this data the IDE can do two things: suggest better memory settings and offer to do a deeper memory analysis.
Auto-recommend Memory Settings - By default, Android Studio has a maximum memory heap size of 1.2 GB. For those of you with large projects this amount may not be enough. Even if you have a machine with a large amount of RAM, the IDE will not exceed this value. With Android Studio 3.5, the IDE will recognize when an app project needs more RAM on a machine with higher RAM capacity and will notify you to increase the memory heap size in a notification. Alternatively, you can make adjusts in the new settings panel under Appearance & Behavior → Memory Settings.
Memory Settings
Easier to report memory problems with Memory Heap Analysis - It can sometimes be hard to capture and reproduce memory problems to report them to the Android Studio team. To solve this, Android Studio 3.5 allows you to trigger a memory heap dump (Help → Analyze Memory Use) that the IDE locally sanitizes for personal data, analyzes, and creates a report. You can opt to share this memory usage report with the Android Studio team to troubleshoot performance problems.
Memory Usage Report
System Health - Exceptions
We have revamped our exception process backend pipeline. Now with the opt-in data we have earlier signals of common exceptions in aggregate which lets us prioritize and fix issues earlier in the canary release process than before. Moreover, we reduced the amount of times we prompt you for exceptions, since the analytics and opt-in crash reports are now more actionable for our team. The net result is that you should see the blinky red exception report icon in the lower status bar of the IDE less frequently.
Android Studio Exception Bubble
System Health - User Interface Freezes
User Interface (UI) freezes are another common issue we heard from you. In Android Studio 3.5, we extended the infrastructure of the underlying Intellij platform, and now measure UI thread stops that last longer than a few moments. Over time, we will have a bigger picture of the top hit spots to focus our efforts on. For example, during the Project Marble development, we found in our data that XML code editing was notably slower in the IDE. With this data point, we optimized XML typing, and have measurably better performance in Android Studio 3.5. You can see below that editing data binding expressions in XML is faster due to typing latency improvements.
Code Editing Before - Android Studio 3.4 (left) and Code Editing After - Android Studio 3.5 (right)
System Health - Build Speed
We continued our investment in build speed. For those developers with larger projects, it is the number one concern. As we uncovered in our recent Medium blog post on build speed, many elements can affect build performance, sometimes slowing it down more than we can improve. However, during Project Marble, we made speed improvements by adding incremental build support to the top annotation processors including Glide, AndroidX data binding, Dagger, Realm, and Kotlin (KAPT). Incremental support can make a notable impact on build speed. For example, in our preliminary analysis, adding incremental support just for Kotlin has improved submodule non-ABI code changes for the Google I/O schedule app from 9.1 seconds to 3.6 seconds – a 60% improvement. Read more about the performance changes to the build system here.
System Health - IDE Speed
In the past, a pro-tip some developers used to do is to turn off Android Studio plugins such as Android NDK support to improve performance. While there is nothing wrong with disabling plugins to remove extra menus or options that you don't need, we removed some unnecessary performance hotspots for the Android NDK support that impacted overall IDE speed.
System Health - Lint Code Analysis
Android Lint is a code analysis framework in Android Studio that helps identify common programming mistakes. However, we learned from several user reports that Lint could be too slow—especially when running in batch analysis mode on large projects. After some digging, we found and fixed several large memory leaks, leading to a roughly 2x speedup in Lint performance. We also published a profiling tool that can help identify bottlenecks in individual Lint checks. Read more about the analysis and tool here.
System Health - I/O File Access for Windows
Many users of Android Studio use Microsoft Windows. Over time, we received a range of reports from users on this platform that build times and installation speeds were increasingly getting slower. After investigating the problem during Project Marble, we realized that recent anti-virus programs included Android Studio build and installation directories as active scan targets. Since these folders have many small files created and removed over time, the I/O and CPU are partially taxed and consequently impacts the overall build/sync performance of Android Studio.
Google Internal Data, 2.2GHz quad-core Intel Core i7, April 2019
System Health Check - Starting with Android Studio 3.5, the IDE will check various directories that could be impacted by this slowdown, including the project build directory, and compare them against the list of excluded antivirus directories. If Android Studio finds an inconsistency, you will see a pop-up notification and link to help guide you through the optimal setup. Learn more here .
System Health Notification - Anti-virus Check
System Health - Emulator CPU Usage
Many app developers enjoy the fast and responsive emulator which has had dramatic performance improvements in the last few years. However, we heard from you that the Android Emulator seems to take an inordinate amount of CPU cycles and triggers the cooling fans on laptops even when the emulator is idle in the background. After investigation and measurement, we found that Google Play Services and related services were aggressively running in the background because by default the emulator was set to AC charging instead of battery discharging. We switched the default to battery discharging, and background CPU usage declined by more than 3x. This change is just of the many optimizations we made to the Android Emulator during Project Marble. Learn more about the Android Emulator and Project Marble here.
Google Internal Data on Apple MacBook Pro (15” 2016), Emulator: Pixel 3 API 28
Feature Polish - Apply Changes
Being able to quickly edit and see code changes you have made without restarting your app is great for app development. Two years ago, the Instant Run feature was our attempt to enable this flow, but it ultimately fell short of expectations. During the Project Marble time period, we re-architectured and implemented from the ground-up a more practical approach in Android Studio 3.5 called Apply Changes. Apply Changes uses platform-specific APIs from Android Oreo and higher to ensure reliable and consistent behavior; unlike Instant Run, Apply Changes does not modify your APK. To support the changes, we re-architected the entire deployment pipeline to improve deployment speed, and also tweaked the run and deployment toolbar buttons for a more streamlined experience. Learn more about the architecture behind Apply Changes here.
Apply Changes Buttons
Feature Polish - Gradle Sync
A recent and annoying pain point in Android Studio is to have your project unexpectedly trigger red symbols across your app code, especially when re-opening your project. The Gradle build system retains a cache of all the dependencies in your home directory that allows the IDE to quickly sync without re-downloading new artifacts. The root cause for many of the recent incidents of red symbols appearing is that in a recent Gradle change, these caches were periodically deleted to save hard drive space. The IDE was unaware of the discrepancy and consequently generated red symbols for missing dependencies. Starting with Android Studio 3.5, we now have the conditional logic to check for this state. We certainly have more we can do in this area, but this is just one example of the types of issues we addressed for project sync during Project Marble.
Feature Polish - Project Upgrades
Ideally, the Android Studio team would like you to be on the latest version of the IDE since this is where the team does active feature development, bug fixing and performance improvements. We know that upgrading your Android Studio is not a seamless process as it should be with many issues revolving around fixing gradle plugin errors. With Android Studio 3.5, we have updated the user experience on output windows, pop-ups and dialog boxes to help clarify when you actually need to upgrade, plus we made more sync & build upgrade errors more actionable.
From a recent developer survey, we heard that many developers upgrade the Android Studio IDE and the Gradle plugin at the same time. As of the last several releases, the IDE and your gradle plugin can actually be updated independently. This means if you want the latest build system speed and correctness improvements, you can upgrade your Gradle plugin, but you can also wait until you're ready. Whether or not you upgrade you Gradle plugin at the same time as the IDE, we encourage you to be on the latest release of Android Studio 3.5 to start using all the enhancements from Project Marble.
Feature Polish - Layout Editor
Based on user research on the layout editor and input from you, we know that there are several performance and error-prone usability issues that make editing XML the only path forward, especially when working with ConstraintLayout. To address the general usability of the layout editor, we refined a wide range of interactions from constraint selection and deletion, to better device preview resizing. While XML code editing is still a click away, we hope you can see that these interaction refinements can be a big productivity boost when creating and editing layouts in Android Studio. Learn more about the full range of layout editor changes here.
Layout Editor Before - Android Studio 3.4 (left) and Layout Editor After - Android Studio 3.5 (right)
Feature Polish - Data Binding
During Project Marble, we also took a look at long standing issues with data binding. From a performance perspective, we found that creating data binding expressions in XML files would lead to severe hangs in the code editor. After fixing this issue we also improved code completion, navigation, and refactoring.
Feature Polish - App Deployment Flow
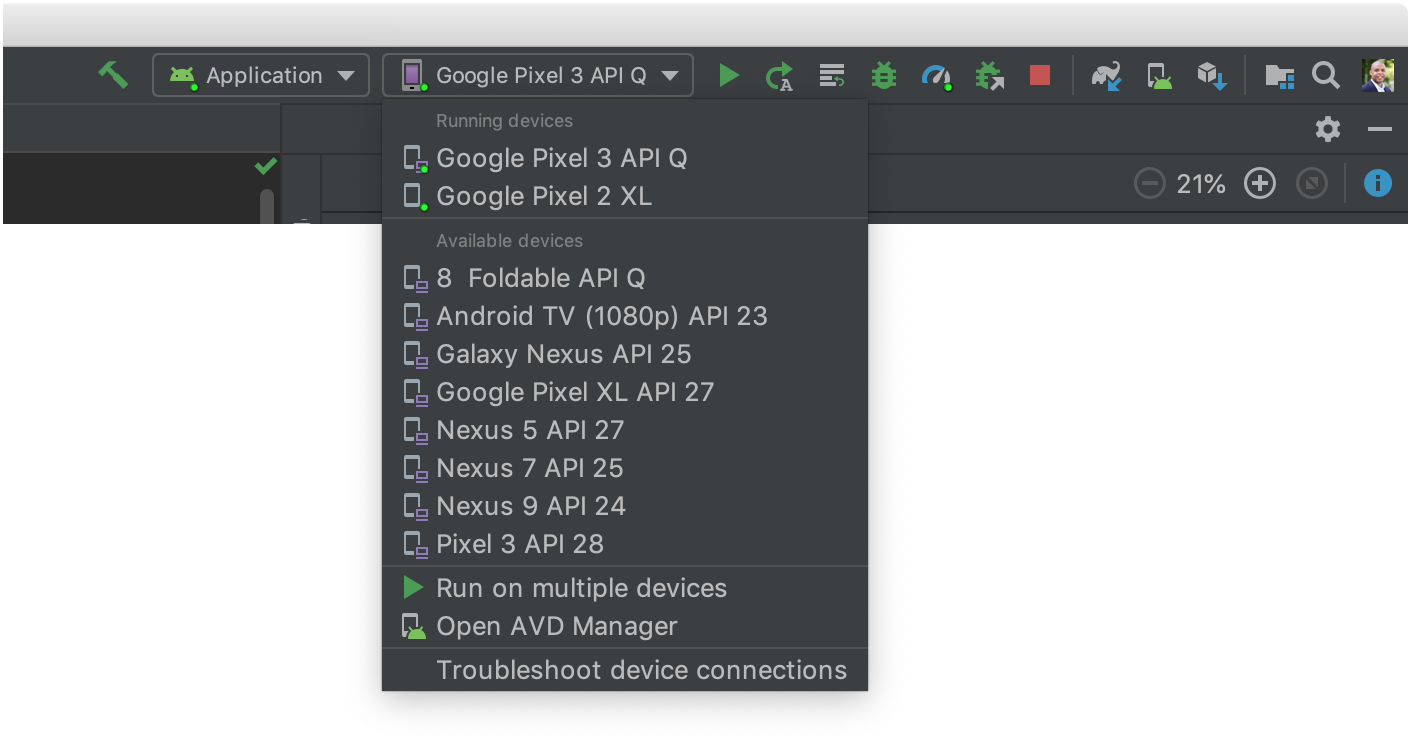
We streamlined the deployment flow during Project Marble, by adding a new dropdown to easily see and change the device you intend to deploy to and a new menu item to deploy to multiple devices.
App Deployment User Flow
Feature Polish - C++ Improvements
C++ project support was also a focus area during Project Marble. CMake builds are now up to 25% faster for large projects because the IDE now invokes parallel Ninja targets. Additionally, you will find an improved single build variant user interface panel that allows you to specify ABI targets separately.. And lastly, Android Studio 3.5 allows you to use multiple versions of the Android NDK side-by-side in your build.gradle file. This should allow you to have more reproducible builds and mitigate incompatibilities between NDK versions and the Android gradle plugin.
Single Variant Selection by ABI
Feature Polish - Intellij Platform Update
This release of the Android Studio includes the features and quality enhancements of the 2019.1 Intellij platform release. The 2019.1 Intellij updates has a range of improvements from custom themes to better version control system integration.
Feature Polish - Conditional Delivery for Dynamic Feature Support
Android Studio 3.5 enhances app bundle feature support with the addition of conditional delivery features for your app bundle. Conditional delivery allows you to set certain device configuration requirements for dynamic feature modules to be downloaded automatically during app install. You can set conditional delivery based on hardware features such as OpenGL versions, support for Augmented Reality, or you set conditions based on API level and user country.
Module Selection for Conditional Delivery
Feature Polish - Emulator Foldables & Pixel Device Support
This release of the IDE includes the Android Emulator skins for Pixel 3a and Pixel 3a XL. Additionally, the Android Studio supports the creation of foldable Android Virtual Devices.
Android Emulator - Foldable Support
Feature Polish - Chrome OS Support
Android Studio 3.5 is now officially supported on Chrome OS 75 and higher on high-end x86 based Chromebooks. During Project Marble we refined a few usability issues, and now have an installer for Android Studio and support app deployment to external USB connected Android devices. Learn more how to setup the IDE on Chrome OS here.
Android Studio on Chrome OS
To recap, Android Studio 3.5 has hundreds of bug fixes and notable changes in these core areas:
System Health
Memory Settings
Memory Usage Report
Reduce Exceptions
User Interface Freezes
Build Speed
IDE Speed
Lint Code Analysis
I/O File Access
Emulator CPU Usage
Feature Polish
Apply Changes
Gradle Sync
Project Upgrades
Layout Editor
Data Binding
App Deployment
C++ Improvements
Intellij 2019.1 Platform Update
Conditional Delivery for Dynamic Feature Support
Emulator Foldables & Pixel Device Support
Chrome OS Support
Check our the Android Studio preview release notes page for more details and read about deep dives into several areas of Project Marble in the following Medium blog posts:
The specific areas and the approach we took to optimize Android Studio for Project Marble were all based on your feedback and metrics data. The aggregate metrics you can opt-in to inside of Android Studio allow us to figure out if there are broader problems in the product for all users, and the data also allows the team to prioritize feature work appropriately. There are are a couple pathways to help us build better insights. At a baseline, you can opt-in to metrics, by going to Preferences /Settings → Appearance & Behavior → Data Sharing.
IDE Data Sharing
Additionally, throughout the year, you might see user sentiment emojis in the bottom corner of the IDE. Those icons are a lightweight way to inform the Android Studio team on how things are going and to give us in-context feedback, and the fastest way to log a bug and send to the team.
IDE User Feedback
Getting Started
Download
Download the beta version of Android Studio 3.5 from the download page. If you are using a previous release of Android Studio, you can simply update to the latest version of Android Studio. If you want to maintain a stable version of Android Studio, you can run the stable release version and beta release versions of Android Studio at the same time. Learn more.
To use the mentioned Android Emulator features make sure you are running at least Android Emulator v29.0.6 downloaded via the Android Studio SDK Manager.
As mentioned above, we appreciate any feedback on things you like, and issues or features you would like to see. If you find a bug or issue, feel free to file an issue. Follow us -- the Android Studio development team ‐ on Twitter and on Medium.
After nearly six months of development, Android Studio 3.4 is ready to download today on the stable release channel. This is a milestone release of the Project Marble effort from the Android Studio team. Project Marble is our focus on making the fundamental features and flows of the Integrated Development Environment (IDE) rock-solid. On top of many performance improvements and bug fixes we made in Android Studio 3.4, we are excited to release a small but focused set of new features that address core developer workflows for app building & resource management.
Part of the effort of Project Marble is to address user facing issues in core features in the IDE. At the top of the list of issues for Android Studio 3.4 is an updated Project Structure Dialog (PSD) which is a revamped user interface to manage dependencies in your app project Gradle build files. In another build-related change, R8 replaces Proguard as the default code shrinker and obfuscator. To aid app design, we incorporated your feedback to create a new app resource management tool to bulk import, preview, and manage resources for your project. Lastly, we are shipping an updated Android Emulator that takes less system resources, and also supports the Android Q Beta. Overall, these features are designed to make you more productive in your day-to-day app development workflow.
Alongside the stable release of Android Studio 3.4, we recently published in-depth blogs on how we are investigating & fixing a range of issues under the auspices of Project Marble. You should check them out as you download the latest update to Android Studio:
The development work for Project Marble is still on-going, but Android Studio 3.4 incorporates productivity features and over 300 bug & stability enhancements that you do not want to miss. Watch and read below for some of the notable changes and enhancements that you will find in Android Studio 3.4.
Develop
Resource Manager - We have heard from you that asset management and navigation can be clunky and tedious in Android Studio, especially as your app grows in complexity. The resource manager is a new tool to visualize the drawables, colors, and layouts across your app project in a consolidated view. In addition to visualization, the panel supports drag & drop bulk asset import, and, by popular request, bulk SVG to VectorDrawable conversion. These accelerators will hopefully help manage assets you get from a design team, or simply help you have a more organized view of project assets. Learn more.
Resource Manager
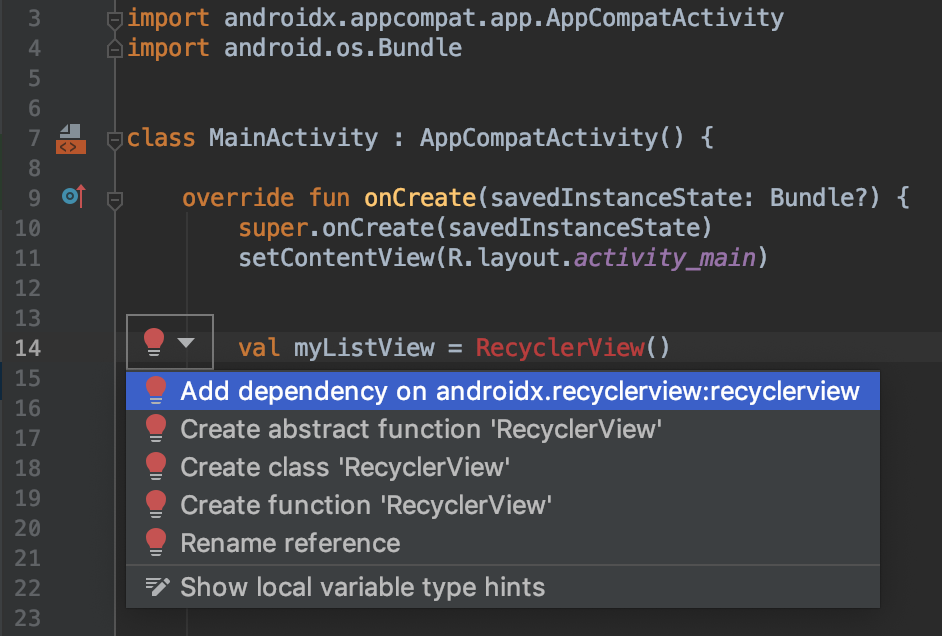
Import Intentions - As you work with new Jetpack and Firebase libraries, Android Studio 3.4 will recognize common classes in these libraries and suggest, via code intentions, adding the required import statement and library dependency to your Gradle project files. This optimization can be a time saver since it keeps you in the context of your code. Moreover, since Jetpack libraries are modularized, Android Studio can find the exact library or minimum set of libraries required to use a new Jetpack class.
Jetpack Import Intentions
Layout Editor Properties Panel - To improve product refinement and polish we refreshed the Layout Editor Properties panel. Now we just have one single pane, with collapsible sections for properties. Additionally, errors and warnings have their own highlight color, we have a resource binding control for each property, and we have an updated color picker.
Layout Editor Properties Panel
IntelliJ Platform Update - Android Studio 3.4 includes Intellij 2018.3.4. This update has a wide range of improvements from support for multi-line TODOs to an updated search everywhere feature. Learn more.
Build
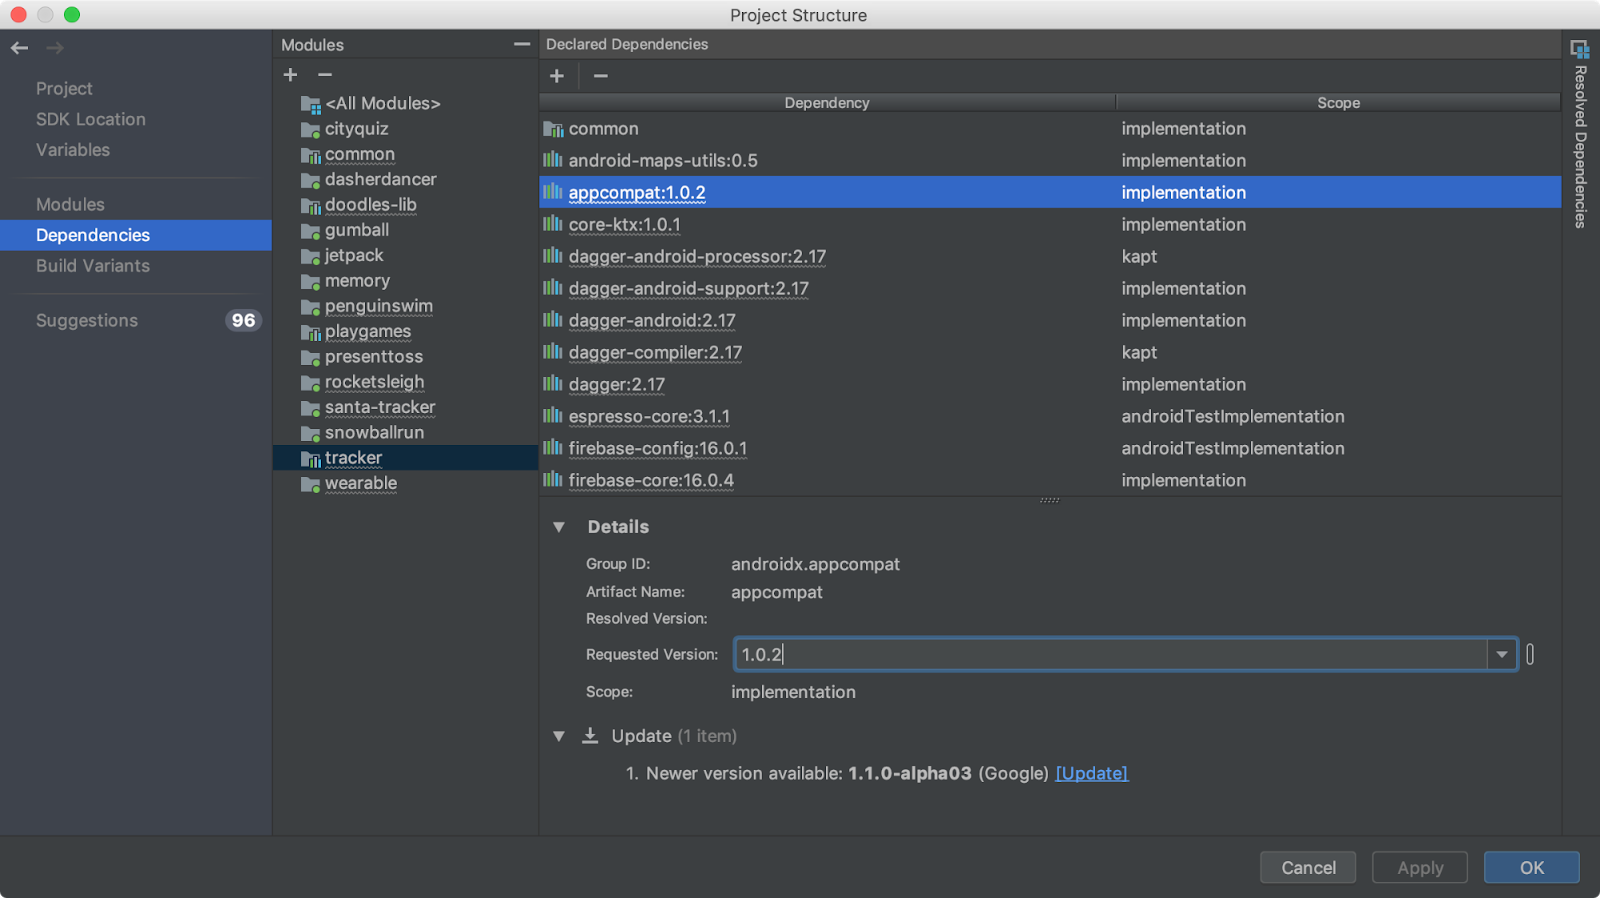
Project Structure Dialog - A long standing request from many developers is to have a user interface front end to manage Gradle project files. We have more plans for this area, but Android Studio 3.4 includes the next phase of improvement in the Product Structure Dialog (PSD). The new PSD allows you to see and add dependencies to your project at a module level. Additionally, the new PSD displays build variables, suggestions to improve your build file configuration, and more! Although the latest Gradle plugin v3.4 also has improvements, you do not have to upgrade your Gradle plugin version number to take advantage of the new PSD. Learn more.
Project Structure Dialogue
R8 by Default -Almost two years ago we previewed R8 as the replacement for Proguard. R8 code shrinking helps reduce the size of your APK by getting rid of unused code and resources as well as making your actual code take less space. Additionally, in comparison to Proguard, R8 combines shrinking, desugaring and dexing operations into one step, which ends up to be a more efficient approach for Android apps. After additional validation and testing last year, R8 is now the default code shinker for new projects created with Android Studio 3.4 and for projects using Android Gradle plugin 3.4 and higher. Learn more.
Test
Android Emulator Skin updates & Android Q Beta Emulator System Image - Inside of Android Studio 3.4 we released the latest Google Pixel 3 & Google Pixel 3 XL device skins. Also with this release, you can also download Android Q Beta emulator system images for app testing on Android Q. Please note that we do recommend running the canary version of Android Studio and the emulator to get the latest compatibility changes during the Android Q Beta program.
Android Emulator - Pixel 3 XL Emulator Skin
To recap, Android Studio 3.4 includes these new enhancements & features:
Download the latest version of Android Studio 3.4 from the download page. If you are using a previous release of Android Studio, you can simply update to the latest version of Android Studio. If you want to maintain a stable version of Android Studio, you can run the stable release version and canary release versions of Android Studio at the same time. Learn more.
To use the mentioned Android Emulator features make sure you are running at least Android Emulator v28.0.22 downloaded via the Android Studio SDK Manager.
We appreciate any feedback on things you like, and issues or features you would like to see. If you find a bug or issue, feel free to file an issue. Follow us -- the Android Studio development team ‐ on Twitter and on Medium.
We are excited to kick off the new year with a stable release of Android Studio 3.3 focused on refinement and quality. You can download it today from developer.android.com/studio. Based on the feedback from many of you, we have taken a step back from large features to focus on our quality fundamentals. The goal is to ensure Android Studio continues to help you stay productive in making great apps for Android. Since the last stable release, Android Studio 3.3 addresses over 200 user- reported bugs. This release also includes official support for Navigation Editor, improved incremental Java compilation when using annotation processors, C++ code lint inspections, an updated new project wizard, and usability fixes for each of the performance profilers. In addition, saving snapshots on exit for the Android emulator is 8x faster.
Android Studio 3.3 kicks off the broader quality focus area for the year, which we call Project Marble. Announced at the Android Developer Summit in November 2018, Project Marble is the Android Studio team's focus on making the fundamental features and flows of the Integrated Development Environment (IDE) rock-solid, along with refining and polishing the user-facing features that matter to you in your day-to-day app development workflows. In Project Marble, we are specifically looking at reducing the number of crashes, hangs, memory leaks, and user-impacting bugs. We are also investing in our measurement infrastructure to prevent these issues from occurring. Stay tuned for more updates and details as we progress on this initiative.
This release of Android Studio is a solid milestone for the product. If you want the latest in feature refinement and quality, then download Android Studio 3.3 today on the stable release channel. Watch and read below for some of the notable changes and enhancements that you will find in Android Studio 3.3.
Develop
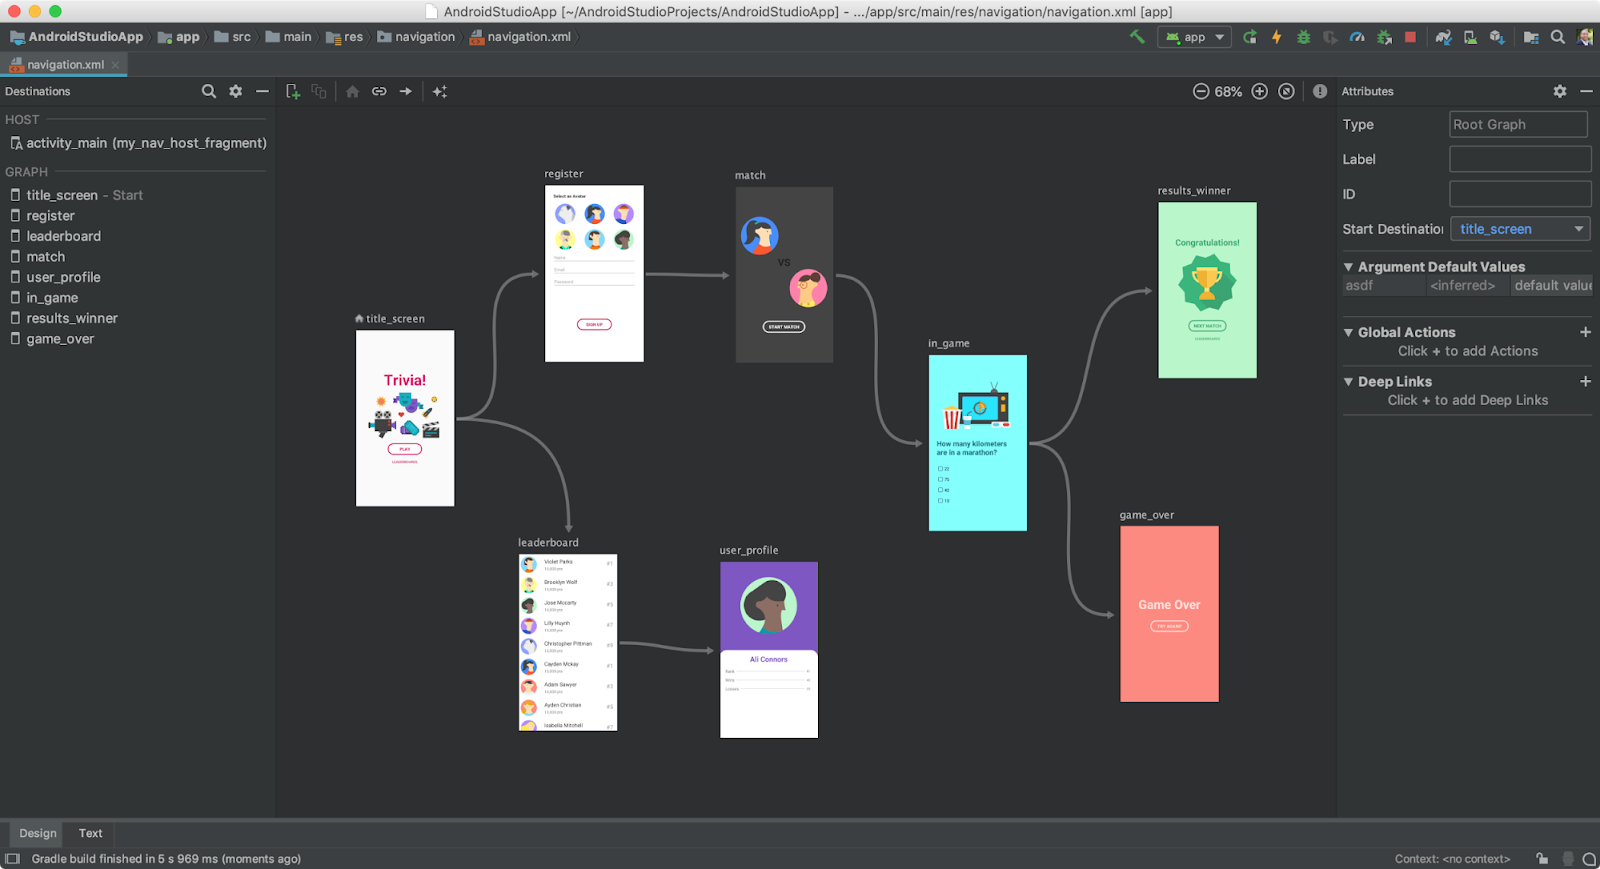
Navigation Editor - The navigation editor is a visual editor which allows you to construct XML resources that support using the new Jetpack Navigation Component. With the Navigation Editor and the Navigation Component, you can build predictable interactions between the screens and content areas of your app. This editor was previewed in an earlier Android Studio release, but based on your feedback we held this feature to improve the quality of the feature. Thank you to the developers who gave us feedback. Learn more.
Navigation Editor
IntelliJ Platform Update - Android Studio 3.3 includes Intellij 2018.2.2. This is a significant platform release from Jetbrains, with new previews for the code editor, updated icons, MacBook Touch Bar support, plus enhanced version control integrations. Learn more.
Kotlin Update - This release of Android Studio bundles Kotlin 1.3.11, with support for Kotlin coroutines and contracts plus IDE support for the recommend Kotlin coding style. Learn more.
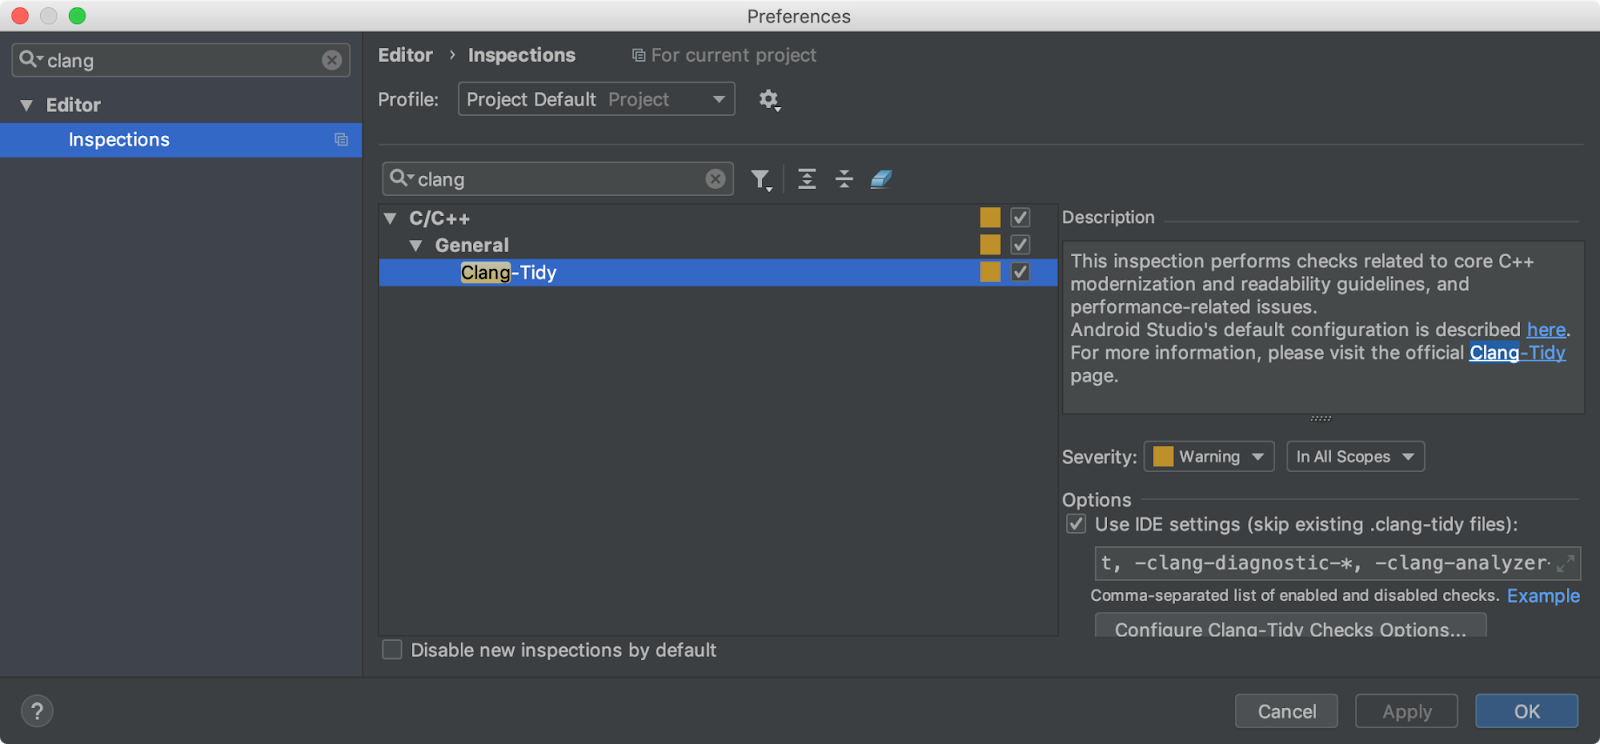
Clang-Tidy Support for C++ - Android Studio now has support for Clang-Tidy for C++ static code analysis. Similar to the current lint support for Java and Kotlin in Android Studio, Clang-Tidy helps those who have C++ in their Android app identify common coding errors and bugs. Enable the inspection by going to Settings → Editor → Inspections (Preference → Editor → Inspections for MacOS) . Lean more.
Clang-Tidy Code Inspection Settings
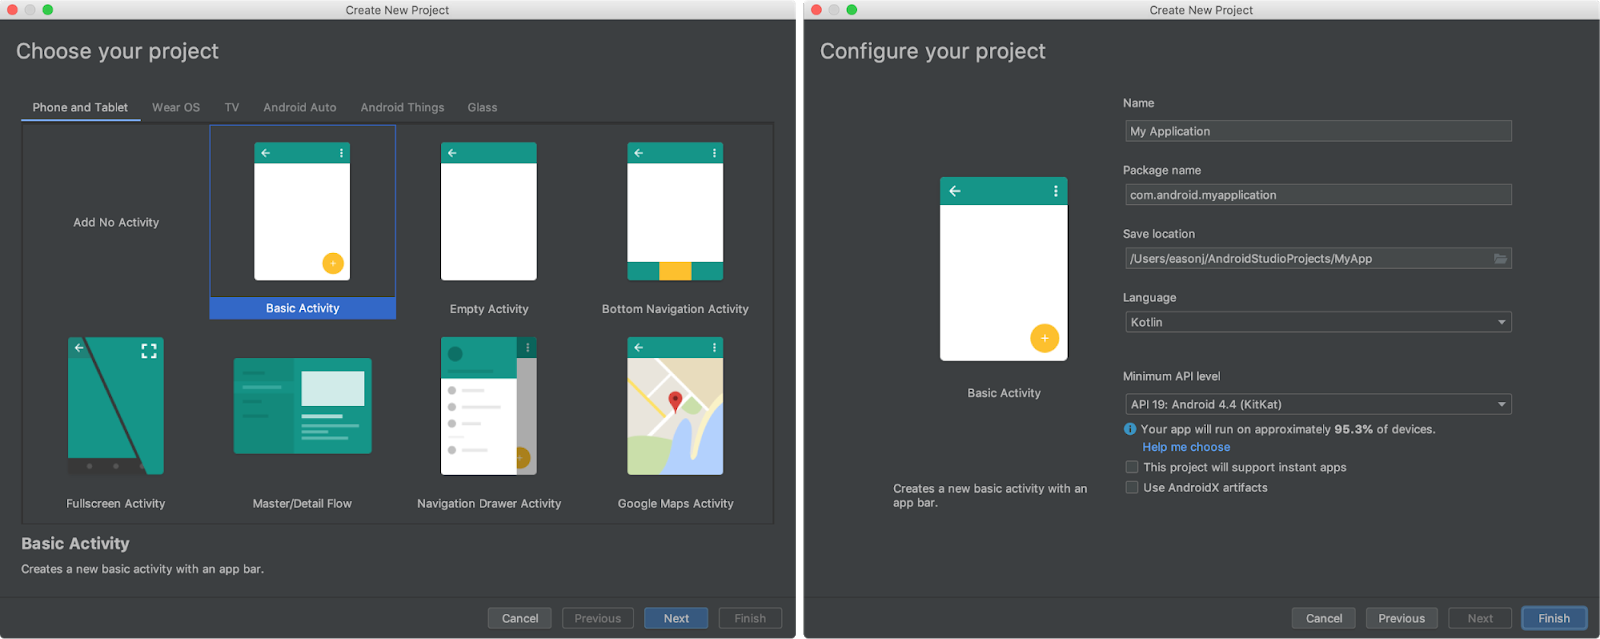
New Project Wizard update - To support the range of device types, programming languages, and new frameworks, we have updated the New Project Wizard for Android Studio. You can access the same project templates in a more streamlined user experience.
New Project Wizard
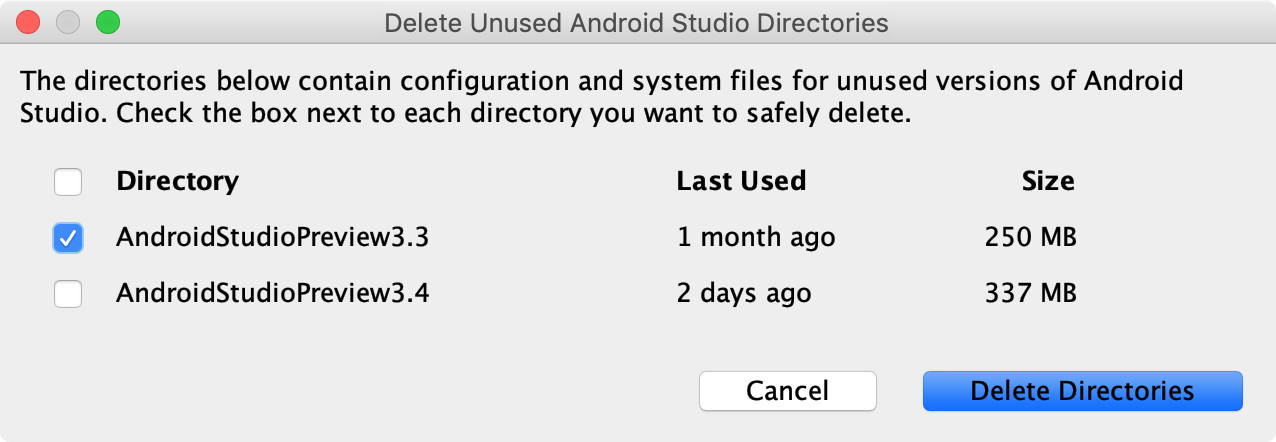
Delete Unused IDE Directories - To help you upgrade to the newest version of Android Studio, we have added a new feature to help clean up unused settings & cache directories. Past versions of Android Studio left these old directories that were hard to find and remove on your hard drive. When you first run Android Studio 3.3 and higher, the new dialog suggests directories that you can safely remove from past installations of Android Studio.
Delete Unused Directories Dialogue
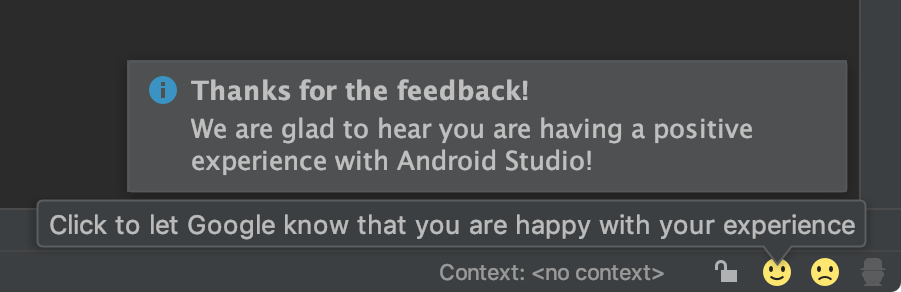
IDE User Feedback - To help us to create a better product, we have started to include in-product sentiment buttons for quick feedback. For those who opt-in to sharing usage data, feel free to click on the icon that suits your sentiment while using Android Studio. To opt-in to give in-product feedback go to Settings → Appearance & Behavior → System Settings → Data Sharing ( Preferences → Appearance & Behavior → System Settings → Data Sharing for MacOS).
IDE User Feedback
Build
Improved incremental Java compilation when using annotation processor - This update decreases build time by improving support for incremental Java compilation when using annotation processors. The optimization requires Android Gradle plugin 3.3.0 or higher. Learn more.
Lazy task configuration -The plugin uses Gradle's new task creation API to avoid initializing and configuring tasks that are not required to complete the current build (or tasks not on the execution task graph). For example, if you have multiple build variants, such as "release" and "debug" build variants, and you're building the "debug" version of your app, the plugin avoids initializing and configuring tasks for the "release" version of your app. Learn more.
Single-variant project sync - Along with build speed, project sync speed can be a development bottleneck to for those who have large app projects with multiple build variants. In this version of the IDE, you can you can limit syncing to only the active build variant. In order for this optimization to work, your project needs to use Android Gradle plugin 3.3.0 or higher. You can enable this option under the Experimental preferences in Android Studio 3.3.
Single-Variant Project Sync
Android App Bundles now support Instant Apps - You can now build and deploy Google Play Instant experiences from a single Android Studio project, and include them in a single Android App Bundle. Launched last year, the Android App Bundle is the new standard Android app publishing format that you can build with Android Studio. This update streamlines and unifies the build artifacts that you upload to Google Play. Learn more.
Test
Multiple Emulator AVD instances - Android Emulator 28.0 now supports the ability to launch multiple instances of the same Android Virtual Device (AVD). Each instance of the AVD uses a minimal set of system resources. For those developers with continuous integration (CI) testing environments, this can be a convenient way to run tests in parallel off one AVD configuration. On the command line run the following commands:
Android 9 Pie Emulator System Images & Wi-Fi P2P - Alongside Android Studio 3.3, you can also download Android 9 system images for your emulator for your app testing. The Google Play emulator system images not only passe the official Android Compatibility Test Suite (CTS), they also include support for Peer-to-Peer Wi-Fi direct connections between two emulators. To start using this feature, launch the emulator (v28.0.22 or higher) via the command line and ensure the two emulators share the same Wi-Fi server and client port command line arguments.
Emulator Snapshot Save Speed - We have heard from you that you enjoy using snapshots and quickboot, but felt the time taken to close the emulator and Quickboot save a snapshot was slow. To solve this, we optimized the way snapshots are saved and managed, using a mapped file to save guest RAM. From aggregate metrics, we found that this optimization led to driving down the average quickboot save time from the last stable version to now from 27 seconds down to 3 seconds — a 8x improvement. Learn more about this enhancement and other recent improvements to the emulator here.
Optimize
Profiler performance improvements - Based on your feedback, we have dramatically improved Android Studio performance while using the profilers in this release. We've seen improvements on average of 2x in frame rates in our local tests. Please continue to provide feedback, especially if you continue to see performance issues.
Memory Profiler allocation tracking options -In previous releases, we have heard from you that, in some cases, your app performs significantly worse while profiling with the default settings. To address this, we have changed the default Memory Profiler capture mode on Android 8.0 Oreo (API level 26) and higher devices to sample for allocations periodically. You can adjust this setting in the Allocation Tracking dropdown menu. By default, we also now temporarily turn off allocation tracking during CPU recordings to minimize the impact on recording results. Learn more.
Memory Profiler: Allocation Tracking Options
Network Profiler formatted text -The Network profiler in Android Studio 3.3 now formats common text types found in network payloads by default, including HTML, XML and JSON. You can toggle between formatted and raw text by navigating to either the Response or Request tab, and click on the View Parsed / View Source link. Learn more.
Network Profiler: Formatted Text
CPU Profiler frame rendering data -The CPU Profiler now shows you the render time for each frame on the main UI thread and Render Thread when you record with Trace System Calls. If you are trying to investigate and understand the bottlenecks or the source of UI jank in your app, this data can come in handy to see where you can improve your app performance. Learn more.
CPU Profiler: Frame Rendering Data
To recap, Android Studio 3.3 includes these new enhancements & features:
Develop
Navigation Editor
IntelliJ 2018.2.2 Platform Update
Kotlin 1.3.11 Update
Clang-Tidy Support for C++
New Project Wizard update
Delete Unused IDE Directories
IDE User Feedback
Build
Improved incremental Java compilation when using annotation processors
Download the latest version of Android Studio 3.3 from the download page. If you are using a previous release of Android Studio, you can simply update to the latest version of Android Studio as well. If you want to maintain a stable version of Android Studio, you can run the stable release version and canary release versions of Android Studio at the same time. Learn more.
To use the mentioned Android Emulator features make sure you are running at least Android Emulator v28.0.22 downloaded via the Android Studio SDK Manager.
We appreciate any feedback on things you like, and issues or features you would like to see. If you find a bug or issue, feel free to file an issue. Follow us -- the Android Studio development team ‐ on Twitter and on Medium.