Today, we are thrilled to announce the stable release of Android Studio Flamingo🦩: The official IDE for building Android apps!
UI Tools
Jetpack Compose and Material 3 templates – Jetpack Compose is now recommended for new projects so the templates use Jetpack Compose and Material 3 by default.
Live Edit (Compose) experimental – Iteratively build an app using Compose by pushing code changes directly to an attached device or emulator. Push changes on file save or automatically and watch your UI update in real time. Live Edit is experimental and can be enabled in the Editor Settings. There are known limitations. Please send us your feedback so that we can continue to improve it. Learn more.
 |
| Live edit |
Themed app icon Preview support – You can now use the System UI Mode selector on the toolbar to switch wallpapers and see how your themed app icons react to the chosen wallpaper. (Note: required in apps targeting API level 33 and higher.)
 |
| Previewing Themed app icons across different wallpapers |
Enable dynamic color in your app and use the new wallpaper attribute in an @Preview composable to switch wallpapers and see how your UI reacts to different wallpapers. (Note: you must use Compose 1.4.0 or higher.)
 |
| Compose Preview: dynamic color wallpaper |
Build
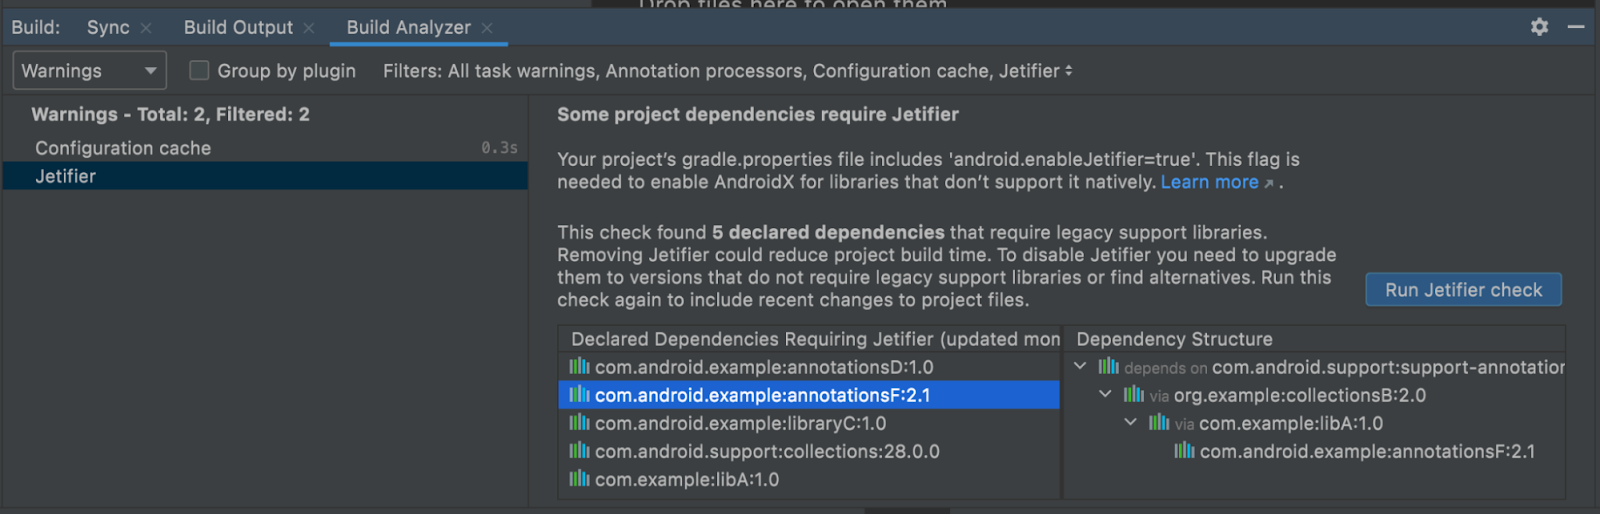
Build Analyzer task categorization – Build Analyzer now groups tasks by categories such as Manifest, Android Resources, Kotlin, Dexing and more. Categories are sorted by duration and can be expanded to display a list of the corresponding tasks for further analysis. This makes it easy to know which categories have the most impact on build time.
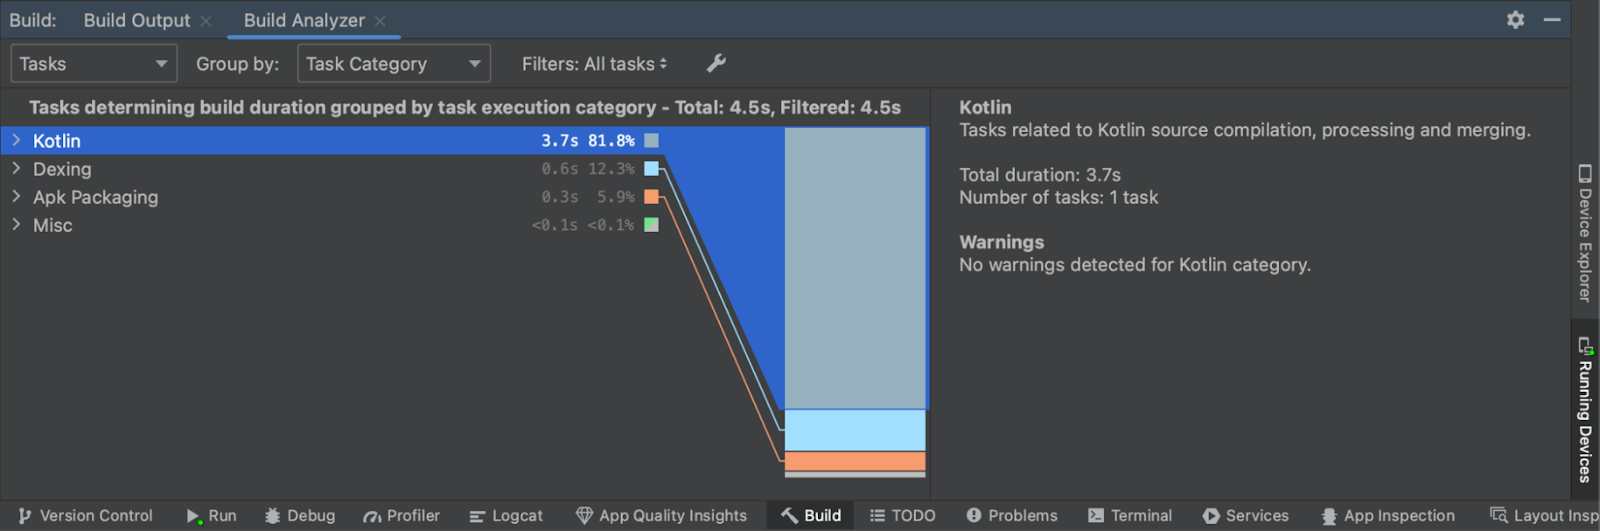 |
| Build Analyzer Task Categorization |
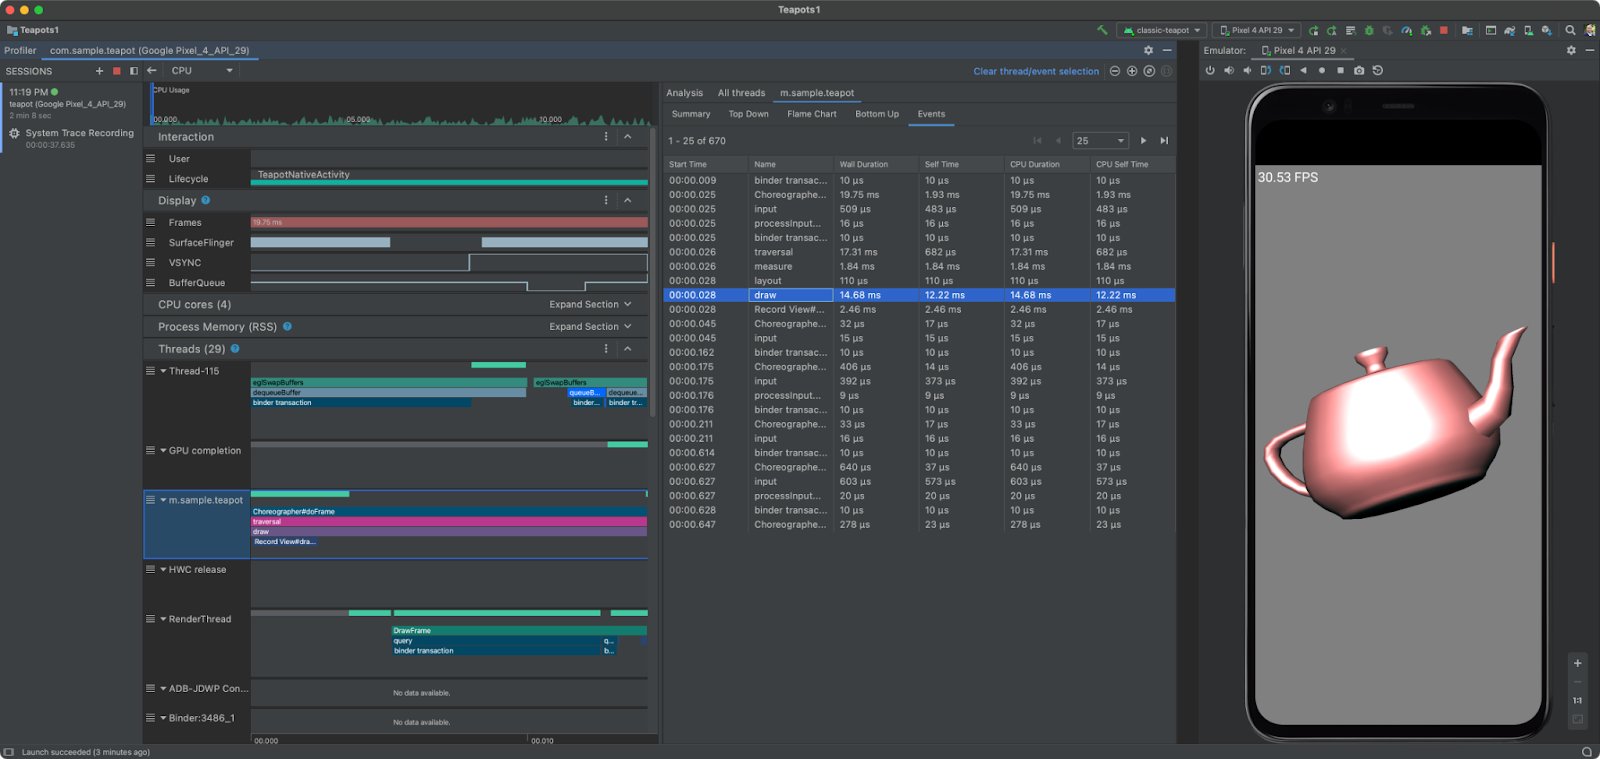
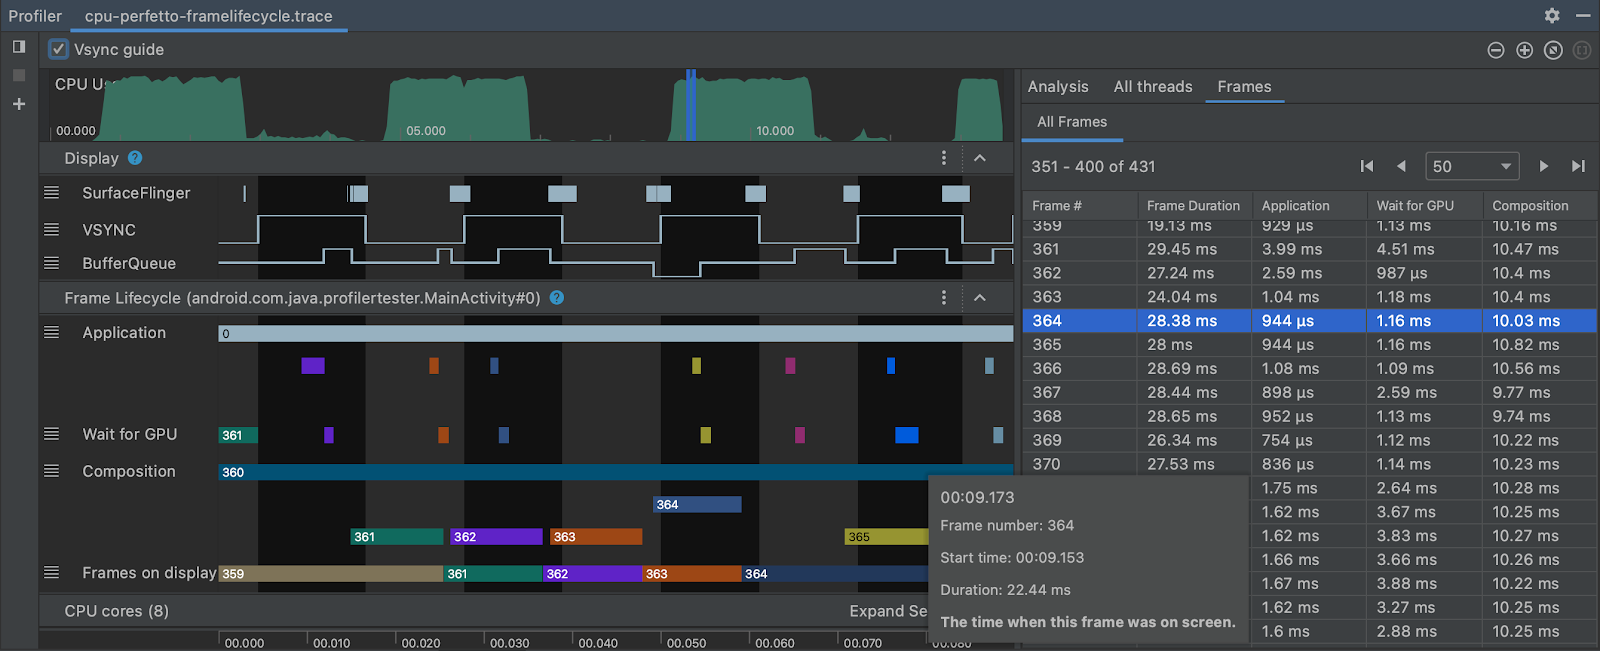
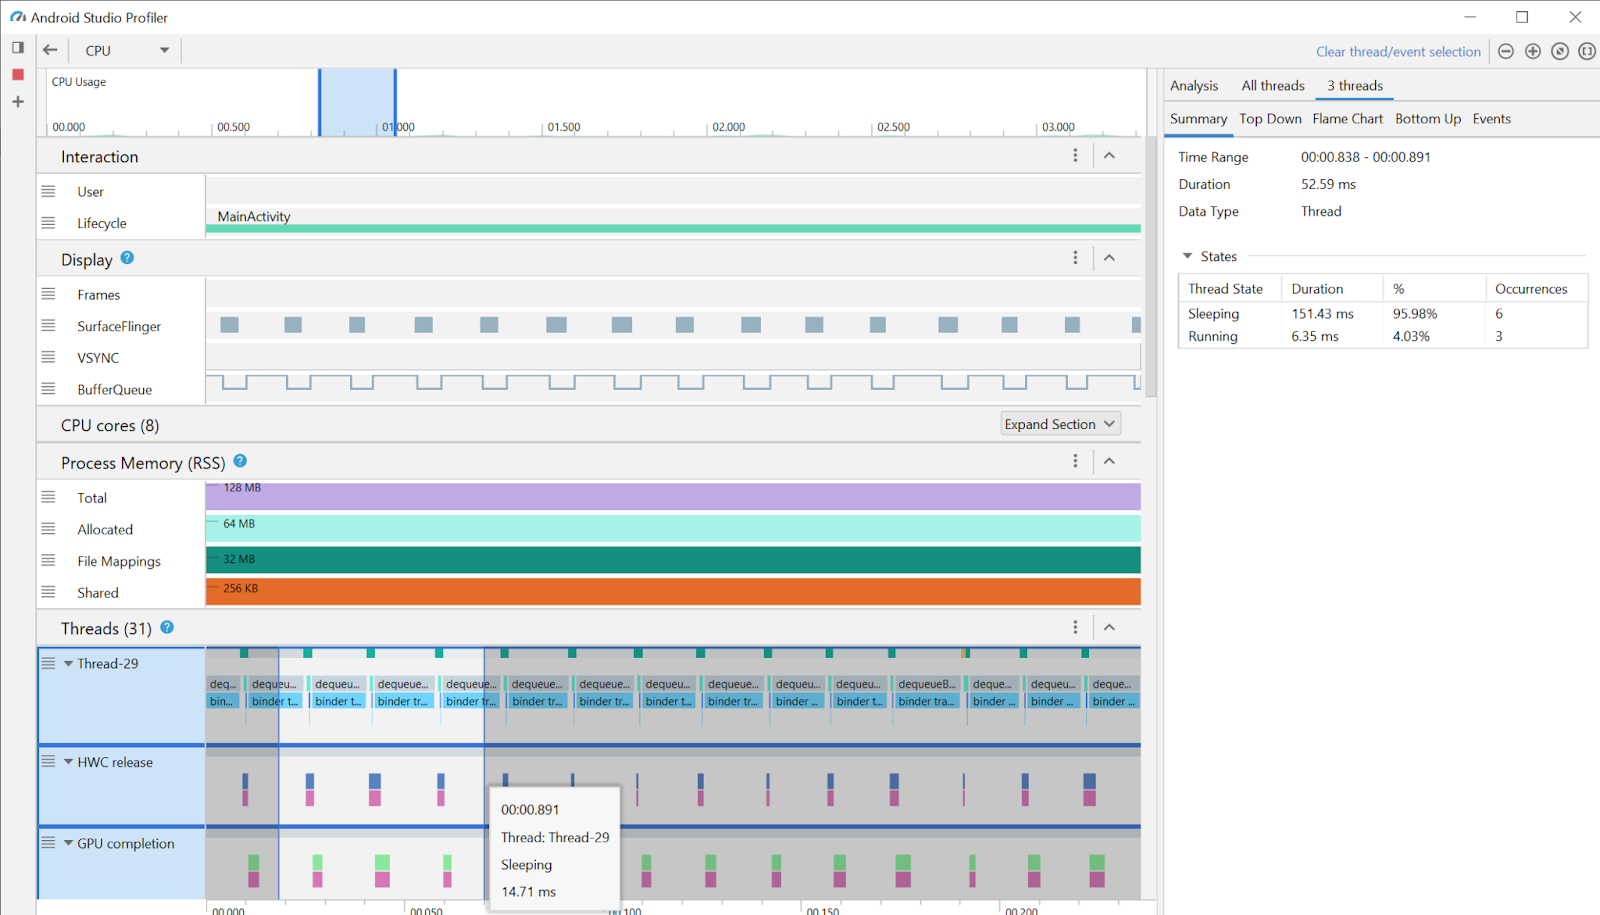
One-click automated profileable build and run – When you are profiling your app, you want to avoid profiling a debuggable build. These are great during development, but the results can be skewed. Instead, you should profile a non-debuggable build because that is what your users will be running. This is now more convenient with one-click automated profileable build and run. Easily configure a profileable app and profile it with one click. You can still choose to profile your debuggable build by selecting Profile app with complete data. Read more on the blog.
 |
| One-click Automated Profileable Build and Run |
Lint support for SDK extensions – SDK extensions leverage modular system components to add APIs to the public SDK for previously released API levels. Now, you can scan for and fix SDK extension issues with lint support. Android Studio automatically generates the correct version checks for APIs that are launched using SDK extensions.
 |
| Lint Support for SDK Extensions |
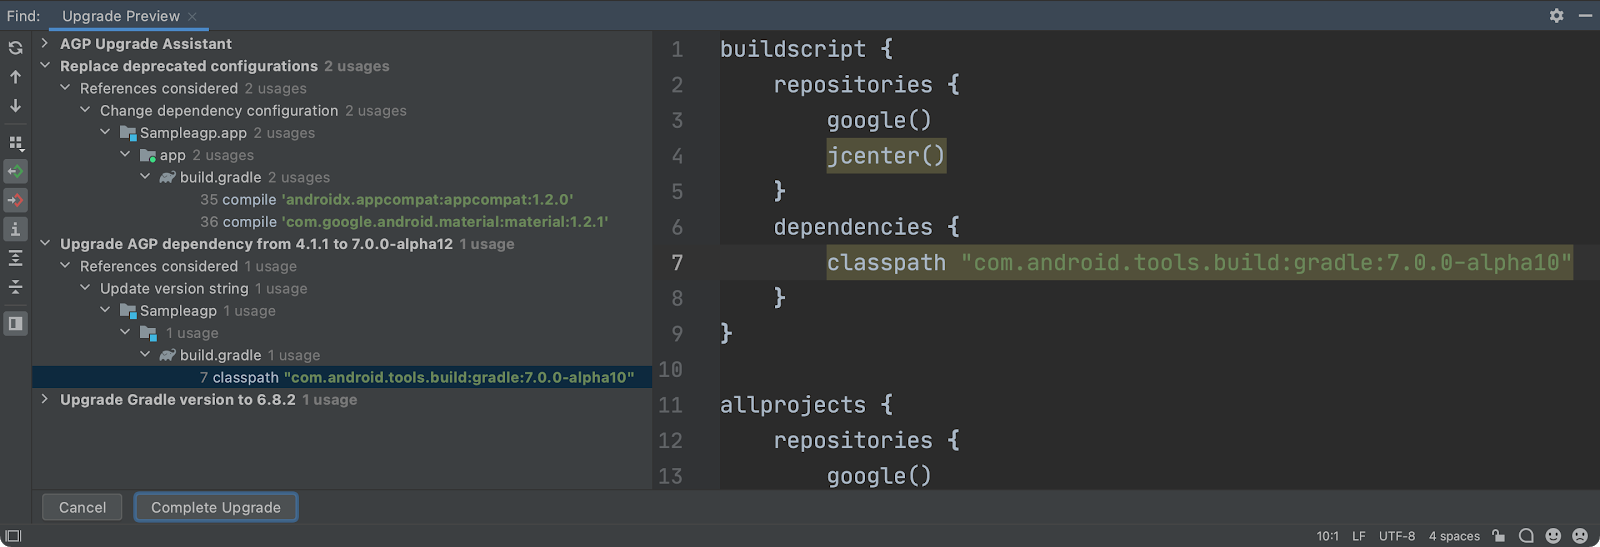
Android Gradle Plugin 8.0.0 – Android Studio Flamingo ships with a new, major version of the Android Gradle plugin. The plugin brings many improvements, but also introduces a number of behavior changes and the Transform API removal. Please make sure to read about the required changes before you upgrade the AGP version in your projects.
Inspect
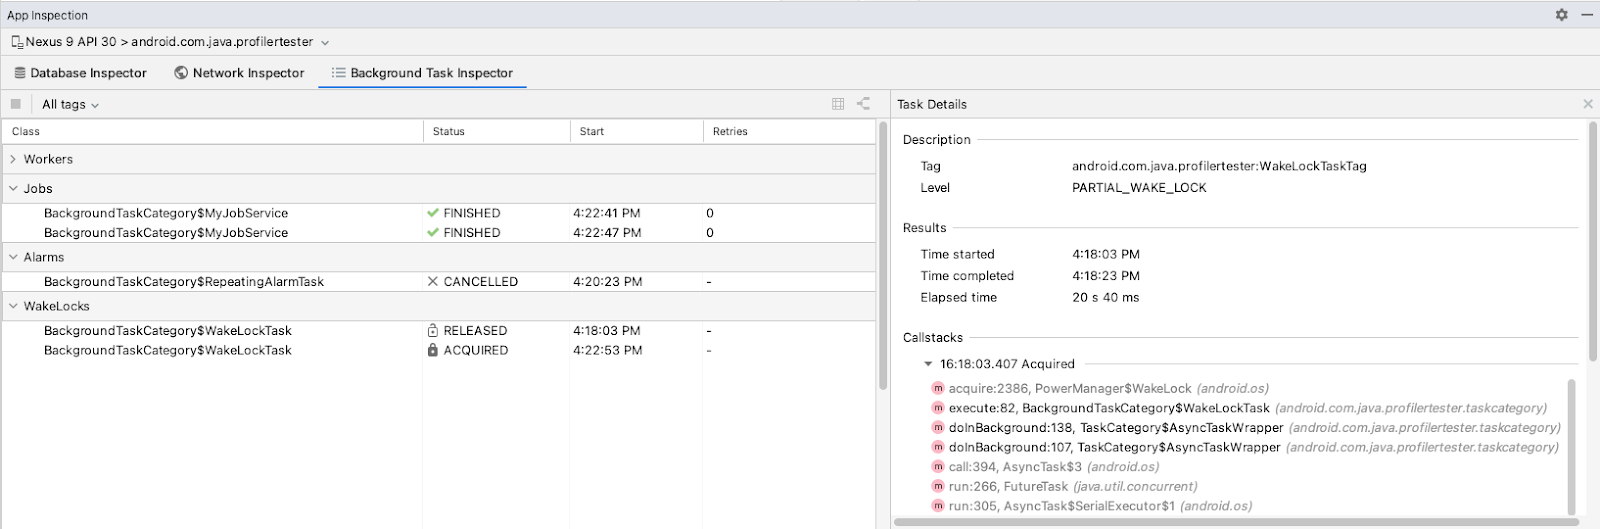
Updates to App Quality Insights – Discover, investigate, and reproduce issues reported by Crashlytics with App Quality Insights. You can filter by app version, Crashlytics signals, device type, or operating system version. In the latest update you can now close issues or add useful annotations in the Notes pane.
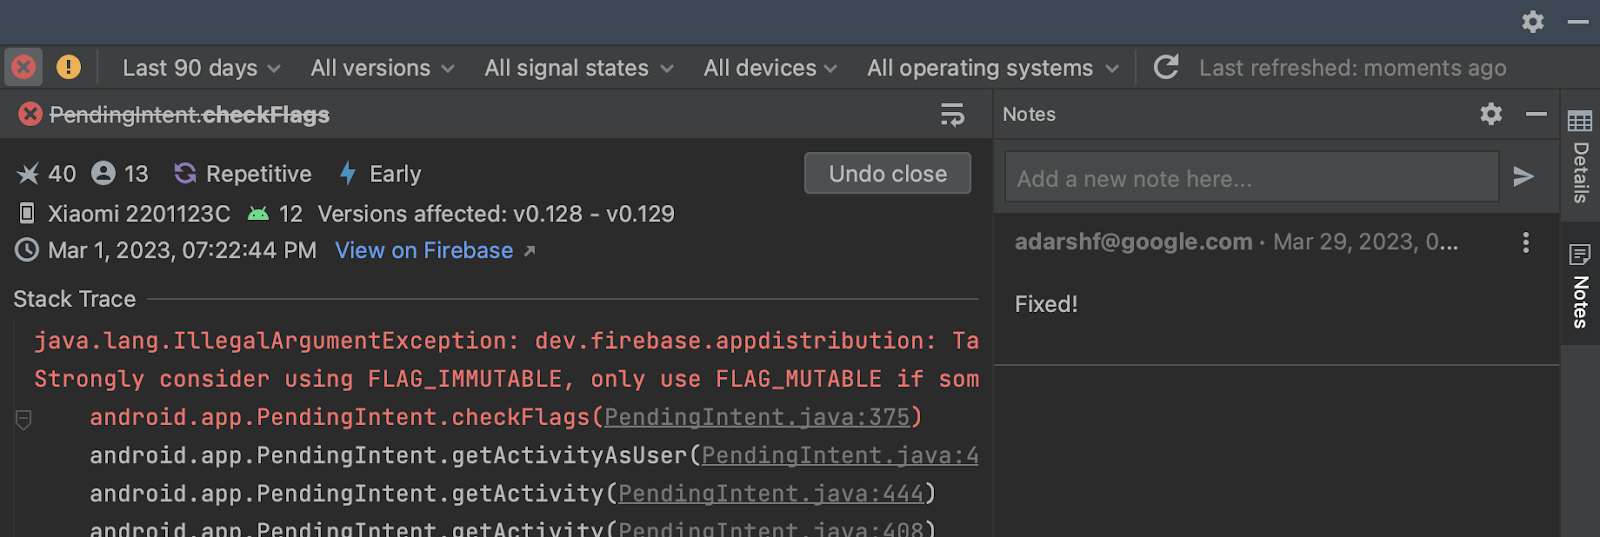 |
| Annotate and close issues inside the notes pane |
Network Inspector traffic interception – Network Inspector now shows all traffic data for the full timeline by default. Create and manage rules that help test how your app behaves when encountering different responses such as status codes, and response headers and bodies. The rules determine what responses to intercept and how to modify these responses before they reach the app. You can choose which rule to enable or disable by checking the Active box next to each rule. Rules are automatically saved every time you modify them.
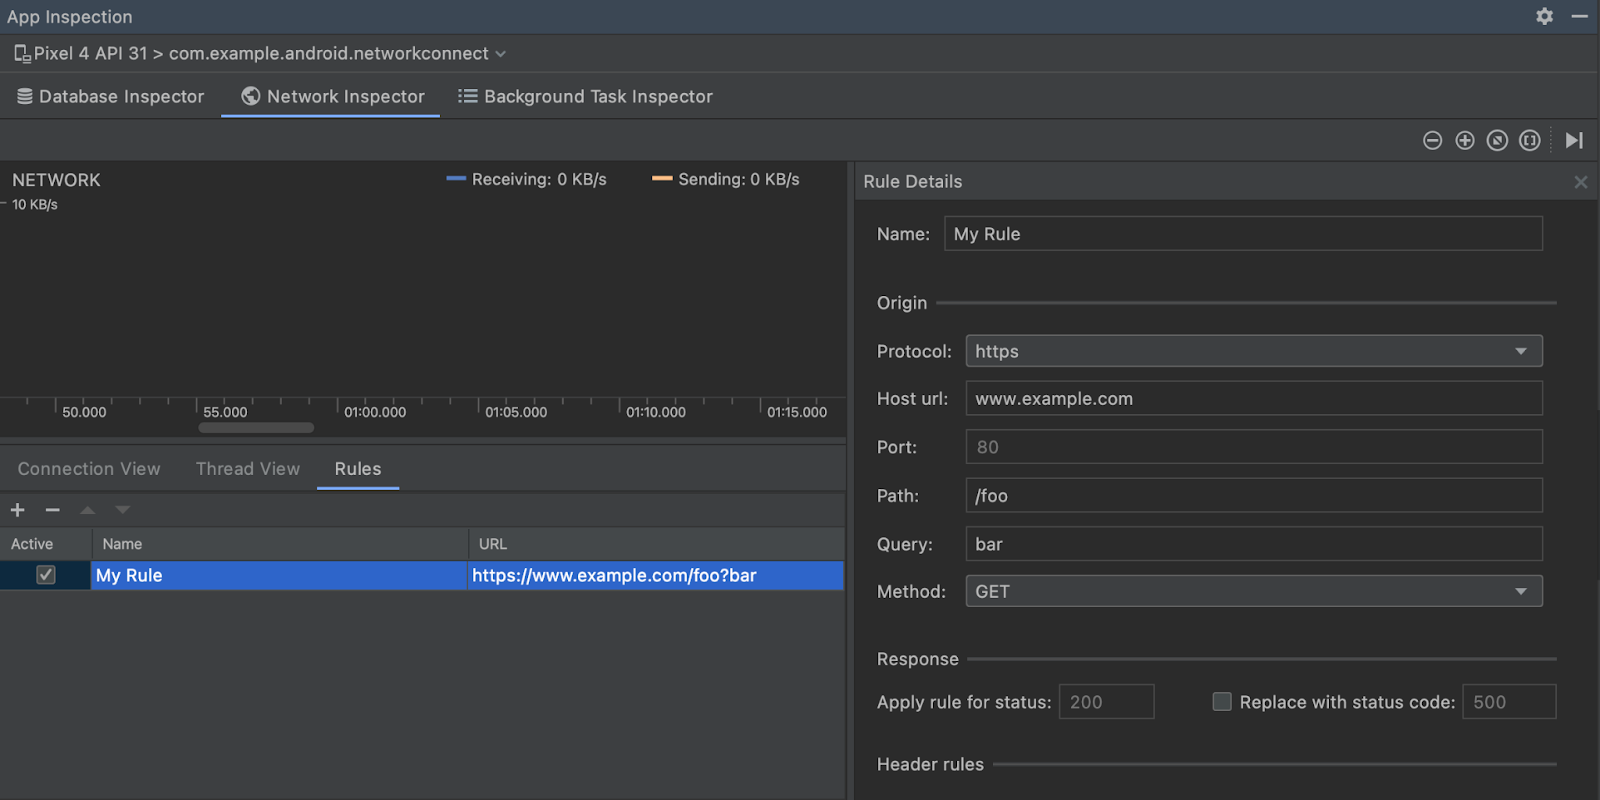 |
| Network Inspector Traffic Interception |
Auto-connect to foreground process in Layout Inspector – Layout Inspector now automatically connects to the foreground process. You no longer have to click to attach it to your app.
IntelliJ
IntelliJ Platform Update – Android Studio Flamingo (2022.2.1) includes the IntelliJ 2022.2 platform release, which comes with IDE performance improvements, enhanced rendering performance on macOS thanks to the Metal API and more. It also improves the IDE performance when using Kotlin, which positively impacts code highlighting, completion, and find usages. Read the IntelliJ release notes here.
Summary
To recap, Android Studio Flamingo (2022.2.1) includes these new enhancements and features:
UI Tools
- Live Edit (Compose) - Experimental
- Themed app icon Preview support
- Dynamic color Preview
- Jetpack Compose and Material 3 Templates
- Build Analyzer Task Categorization
- One-click Automated Profileable Build and Run
- Lint Support for SDK Extensions
- Breaking changes in Android Gradle Plugin 8.0
- Updates to App Quality Insights
- Network Inspector Traffic Interception
- Auto-connect to foreground process in Layout Inspector
- IntelliJ Platform 2022.2 Update
Check out the Android Studio release notes, Android Gradle plugin release notes, and the Android Emulator release notes for more details.
Download Studio Today!
Now is the time to download Android Studio Flamingo (2022.2.1) to incorporate the new features into your workflow. As always, we appreciate any feedback on things you like and issues or features you would like to see. If you find a bug or issue, please file an issue and also check out known issues. Remember to also follow us on Twitter, Medium, or YouTube for more Android development updates!


 Posted by Lily Rapaport, Product Manager