Category Archives: Google Cloud Platform Blog

Product updates, customer stories, and tips and tricks on Google Cloud Platform

Troubleshooting tips: Help your cloud provider help you


Editor’s note: We’re excited to bring you this blog post from the team of Google experts who wrote the book (really!) on Site Reliability Engineering (SRE) a few years back. The second edition of the book is underway, and this post delves into one area of SRE that’s relevant to many IT teams today: troubleshooting in the age of cloud computing. This is part two of two. Check out part one on writing better issue reports for cloud provider support.

Troubleshooting computer systems is an act as old as computers themselves. Some might even call it an art. The cloud computing paradigm entails a fundamental change to how IT teams conduct troubleshooting.

Successful IT troubleshooting doesn’t depend only on luck or experience, but is a deliberate process that can be taught. When you’re using cloud-based infrastructure, you’re often troubleshooting via a cloud provider’s help desk, adding another layer to helping users. Because of this shift away from the traditional IT team model, your communications with the provider are essential. (See part one for more on putting together an effective issue report to improve troubleshooting from the start.)

Once you’ve communicated the issue to your provider, you’ll be working with the provider’s support team to get the issue fixed.

The essentials of cloud troubleshooting

Those diagnosing a technical problem with cloud infrastructure are seeking possible explanations (hypotheses) and evidence that explains the problem. In the short term, they look for changes in the system that roughly correlate with the problem, and consider rolling back, as a first step to mitigate the problem and stop the bleeding. The longer-term goal is to identify and fix the root cause so the problem will not recur.

From the site reliability engineering (SRE) perspective,  the general approach for troubleshooting is as follows:

  • Triage: Mitigate the impact if possible
  • Examine: Gather observations and share them
  • Diagnose: Create a hypothesis that explains the observations
  • Test and treat:
    • Identify tests that may prove or disprove the hypothesis
    • Execute the tests and agree on the meaning of the result
    • Move on to the next hypothesis; repeat until solved


When you’re working with a cloud provider on troubleshooting an issue, there are parts of the process you’re unable to control. But you can follow the steps on your end. Here’s what you can do when submitting a report to your cloud provider support team.

1. Communicate any troubleshooting you've already done
By the time you open an issue report, you've probably done some troubleshooting already. You may have checked the provider’s status page, for example. Share the steps you've taken and any key findings. Keep a timeline and log book of what you have done and share it with the provider. This means that you should start keeping a log book as soon as possible, from the start of detection of your problem. Keep in mind that while cloud providers may have telemetry that provides real-time omniscient awareness of the state of their infrastructure, the dependencies that result from your particular implementation may be less obvious. By design, your particular use of cloud resources is proprietary and private, so your troubleshooting vantage point is vital.

If you think you have a diagnosis, explain how you came to that conclusion. If you think others can reproduce the issue, include the steps to do so. A reproducible test in an issue report usually leads to the fastest resolution.

You may have an idea or guess about what's causing the problem. Be careful to avoid confirmation bias—looking for evidence to support your guess without considering evidence to the contrary.

2. Be specific and explicit about the issue
If you've ever played the telephone game, in which players whisper a message from person to person, you've seen how human translation and interpretation can lead to communication gaps. Rather than describing information in your provider communications, try to share it. Doing so reduces the chance that your reader will misinterpret what you're saying and can help speed up troubleshooting. Don’t assume that your provider has access to all of this information; customer privacy means that they may not, by design.

For example:

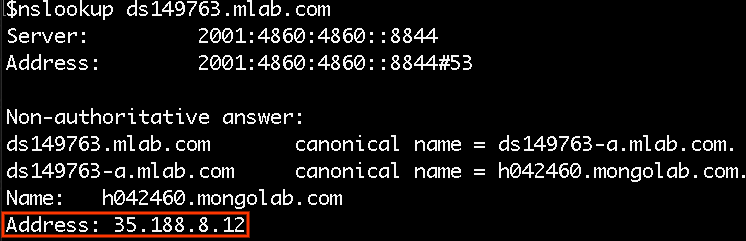
  • Use a screenshot to show exactly what you see
  • For web-based interfaces, provide a .HAR (Http ARchive) file
  • Attach information like tcpdump output, logs snippets and example stack traces

3. Report production outages quickly
An issue is considered to be a production outage if your application has stopped serving traffic to users or is experiencing similar business-critical impact. Report production outages to your cloud provider support as soon as possible. Issues that block a small number of developers in a developer test environment are normally not considered production outages, so they should be reported at lower priorities.

Normally, when cloud provider support is alerted about a production outage, they quickly triage the situation with the following steps:

  1. Immediately check for known issues affecting the infrastructure.
  2. Confirm the nature of the issue.
  3. Establish communication channels.


Typically, you can expect a quick response with a brief message, which might contain:

  • Whether or not there is a known issue affecting multiple customers
  • An acknowledgement that they can observe the issue you've reported or a request for more details
  • How they intend to communicate (for example, phone, Skype, or issue report)


It’s important to quickly create an issue report including the four critical details (described in part one  and then begin deeper troubleshooting on your side of the equation. If your organization has a defined incident management process (see Managing Incidents), escalating to your cloud provider should be among your initial steps.

4. Report networking issues with specificity
Most cloud providers’ networks are huge and complex, composed of many technologies and teams. It's important to quickly identify a networking-specific problem as such and engage with the team that can repair it.

Many networking issues have similar symptoms, like "can't connect to server," at a high level. This level of detail is typically too generic to be useful in identifying the root cause, so you need to provide more diagnostic information. Network issues relate to connectivity, which always involves at least two specific points: source and destination. Always include information about these points when reporting network issues.

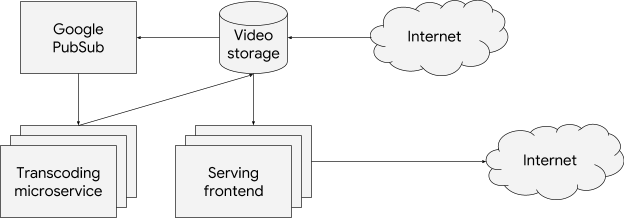
To structure your issue report,  use the conceptual tool of a packet flow diagram:

  • Describe the important hops that a packet takes along a path from source to destination, along with any significant transformations (e.g., NAT) along the way.
  • Start by identifying the affected network endpoints by Internet IP address or by RFC 1918 private address, plus an ASN for the network.
  • Note anything meaningful about the endpoints, such as who controls them and whether they are associated with a DNS hostname. 
  • Note any intermediate encapsulation and/or indirection. For example: VPN tunneling, proxies or NAT gateways.
  • Note any intermediate filtering, like firewalls, CDN or WAF.


Many problems that manifest as high latency or intermittent packet loss will require a path analysis and/or a packet capture for diagnosis. Path analysis is a list of all hops that packets traverse (for example, MTR or tcptraceroute). A packet capture (a.k.a. pcap, derived from the name of the library libpcap) is an observation of real network traffic. It's important to take a packet capture for both endpoints, at the same time, which can be tricky. Practice with the necessary tools (for example tcpdump or Wireshark) and make sure they are installed before you need them.

5. Escalate when appropriate
If circumstances change, you may need to escalate the urgency of an issue so it receives attention quickly. Take this step if business impact increases, if an issue is stuck without progress after a lot of back-and-forth with support, or if some other factor calls for quicker resolution.

The most explicit way to escalate an issue is to change the priority of the issue report (for example, from P3 to P2). Provide comments about why you need to escalate so support can respond appropriately.

6. Create a summary document for long-running or difficult issues
Issue state and relevant information change over time as new facts come to light and hypotheses are ruled out. In the meantime, new people join the investigation. Help communicate relevant, up-to-date information by collecting information in a summary document.

A good summary document has the following dimensions:

  • The latest state summarized at the top
  • Links to all relevant issue reports and internal tracking bugs
  • A list of hypotheses which are potentially true, and hypotheses that have been ruled out already. When you start investigating a particular hypothesis, note that you are doing so, and mention the tests or tools that you intend to use. Often, you can get good advice or prevent duplicate work.


SAMPLE summary document format:

$TIMESTAMP
<Current customer impact> <Working theory and actions being taken> <Next steps>

13:00:00
Customer impact has been mitigated and resolved. Our networking provider was throttling our traffic because we forgot to pay our bill last month. Next step is to be nicer to our finance team.

12:00:00
More than 100 customers are actively complaining about not being able to reach our service. Our networking provider is throttling customer traffic to one of our load balancers. The response team is actively working with our networking provider’s tier 1 support to understand why and how this happened.

11:00:00
We have now received 100 complaints from 50 customers from four different geos that they cannot consistently reach our API at api.acme.com. Our engineers currently believe that an upstream networking issue is causing this. Next steps are to reach out to our networking provider to see if there are any upstream issues.

10:00:00
We have received five complaints from five customers that they are unable to reach api.acme.com. Our engineers are looking into the issue.


Try to keep each issue report focused on a single issue. Don't reopen an issue report to bring up a new issue, even if it's related to the original issue. Do reference similar issues in your new report to help your provider recognize patterns from systemic root causes.

Keep your communication skills sharp

Communicating highly detailed technical information in a clear and actionable manner can be difficult. Doing so requires focus and specific skills. This task is particularly challenging in stressful situations, because our biological response to stress works against the need for clear cognitive reasoning. The following techniques help make communication easier for everyone.

Help reduce cognitive load by writing a detailed issue report
Many issue reports require the reader to make inferences or calculations. This introduces cognitive load, which decreases the mental energy available for solving the technical problem.

When writing an issue report, be as specific and detailed as possible. While this attention to detail requires more time on the part of the writer, consider that an issue report is written once but read many times by many people. People can solve the problem faster together when equipped with comprehensive information. Avoid acronyms and internal company code names. Also, be mindful of protecting customer privacy when disclosing any information to any third party.

Use narrative techniques
Once upon a time, in a land far, far away...

Humans are very good at absorbing information in the form of stories, so you can get your point across quite effectively this way. Start with the context: What was happening when you first observed the problem? What potential fixes did you try? Who are the characters involved, and why does the issue matter to them?
Include visuals Illustrate your issue report with any supporting images you have available, like text formatting or charts and screenshots.

Text formatting
Formatted text like log lines, code excerpts or MySQL results often become illegible when sent through plain-text emails. Add explicit markers (for example, <<<<<< at the end of the line) to help direct attention to important sections. You can use footnotes to point to long-form URLs, or use a URL shortener.

Use bullet points to format lists, and to call out important details like instance names. Use numbered lists to enumerate series of steps.

Charts
Charts are very useful for understanding time-series data. When you’re sending charts with an issue report, keep these best practices in mind:

  • Take a screenshot, including title and axis labels. For absolute values, specify units (requests per minute, errors per second, etc).
  • Annotate the screenshot with arrows or circles to call out important points.
  • Briefly describe what the chart is measuring.
  • Briefly describe how the chart normally looks.
  • In a few sentences, describe your interpretation of the chart and why it is relevant to the problem.


Avoid the following antipatterns:

  • The Y-axis represents a specific error (e.g., exceptions in my-handler) and has no clear relationship to the problem under investigation (e.g., high persistence-layer latency). To remedy this situation, explain why the graph is relevant to the problem.
  • The Y-axis is an absolute number (e.g., 1M per minute) that provides no context about the relative impact.
  • The X-axis doesn't have a time zone.
  • The Y-axis is not zero-based. This can make minor changes in the Y value seem very large.
  • Axis labels are missing or cut off.

Well-crafted issue reports, along with strong communication with your cloud provider, can speed the resolution process and time it takes. The cloud computing model has drastically changed the way that IT teams troubleshoot computer systems. Technical savvy is no longer the sole necessary skill set for effective troubleshooting--you must also be able to communicate clearly and efficiently with cloud providers. While the reality of your deployment may be unique, nuanced, and complex, these building blocks can help you navigate this territory.

Related content:
SLOs, SLIs, SLAs, oh my - CRE life lessons
SRE vs. DevOps: competing standards or close friends?
Introducing Google Customer Reliability Engineering


Special thanks to Ralph Pearson, J.C. van Winkel, John Lowry, Dermot Duffy and Dave Rensin

Cloud Source Repositories: more than just a private Git repository


If your goal is to release software continuously at high velocity, you need to be able to automatically build, test, deploy, and debug your code changes, all within minutes. But first you need to integrate your version control systems and your build, deploy, and debugging tools—a time-consuming and complicated process that requires numerous manual configuration steps like downloading plugins and setting up webhooks. And when you’re done, the workflow still isn’t very integrated, forcing developers to jump from one tool to another as they go from code to deployment. So much for high velocity.

Cloud Source Repositories, fully-managed private Git repositories hosted on Google Cloud Platform (GCP), is tightly integrated with other GCP tools, making it easy to automatically build, test, deploy, and debug code right out of the gate. With just a few clicks and without any additional setup or configuration, you can extend Cloud Source Repositories with other GCP tools to perform other tasks as a part of your development workflow. In this post, let’s take a closer look at some of the GCP tools that are integrated with Cloud Source Repositories, and how they simplify developer workflows:

Simplified continuous integration (CI) with Container Builder

Looking to implement continuous integration and validate each check-in to a shared repository with an automated build and test? The integration of Cloud Source Repositories with Container Builder comes in handy here, making it easy to set up a CI on a branch or tag. There are no CI servers to set up or repositories to configure. In fact, you can enable a CI process on any existing or new repo present in Cloud Source Repositories. Simply specify the trigger on which Container Builder should build the image. In the following example, for instance, the trigger specifies that a build will be triggered when changes are pushed to any branch of Cloud Source Repositories.


To demonstrate this trigger in action, the example below changes the background color of the “Hello World” website from yellow to blue.

The first step involves setting blue as the background color using background-color CSS property. Then, you need to add the changed file to the index using a git add command and record the changes to the repository with git commit. The commits are then pushed to the remote server using git push.

Because of the trigger defined above, an automated build is triggered as soon as changes are pushed to Cloud Source Repositories. Container Builder starts automatically building the image based on the changes. Once the image is created, the new version of the app is deployed using kubectl set image. The new changes are reflected and the “Hello World” website now shows a blue background color.

Follow this quickstart to begin continuous integration with Container Builder & Cloud Source Repositories.

Pre-Installed tools and programming languages in Cloud Shell and Cloud Shell Editor

Cloud Source Repositories is integrated out-of-the-box with Cloud Shell and the Cloud Shell Editor. Cloud Shell provides browser-based command-line access, giving you an easy way to build and deploy applications. It is already configured with common tools such as MySql client, kubernetes, and Docker, as well as Java, Go, Python, Node.js, PHP and Ruby, so you don't have to spend time looking for the latest dependencies or installing software. Cloud Editor, meanwhile, acts as a cross-platform IDE to edit code with no setup.

Quick deployment to App Engine

The integration of Cloud Source Repositories and App Engine makes publishing applications a breeze. It provides you a way to deploy apps quickly and lets developers focus just on writing code, without the worry of managing the underlying infrastructure or even scaling the app as its needs grow. You can deploy source code stored in Cloud Source Repositories to App Engine with the gcloud app deploy command, which automatically builds an image and deploys it to App Engine flexible environment. Let’s see this in action.

In the following example, we’ll change the text on the website from “Hello Universe” to “Hello World” before deploying it. Like with the previous example, git add and git commit help stage and commit the files staged to Cloud Source Repositories. Next, the git push command pushes the changes to the master branch.

Once the changes have been pushed to Cloud Source Repositories, you can deploy the new version of the application by running the gcloud app deploy command from the directory where the app.yaml file is located.

The text is now changed to “Hello, World!” from “Hello Universe”.

Try deploying code stored in Cloud Source Repositories to App Engine by following the quickstart here.

Debug in production with Stackdriver Debugger

If your app is running in production and has problems, you need to troubleshoot issues quickly to avoid bad customer experiences. For debugging apps in production, creating breakpoints isn't really an option as you can’t suspend the program. To help locate the root cause of production issues quickly, Cloud Source Repositories is integrated with Stackdriver Debugger, which lets you debug applications in production without stopping or slowing the application.

Stackdriver Debugger allows you to either use a debug snapshot or debug logpoint to debug production applications. Debug Snapshot captures the call stack and variables at a specific code location the first time any instance of that code is executed. Debug Logpoint, on the other hand, writes the log messages to the log stream. You can set a debug snapshot or a debug logpoint for code stored in Cloud Source Repositories with a single click.

Debug Snapshot for debugging

In the following example, a snapshot has been set up for the second line of code in the get function of the MainPage class.

The right-hand panel display details such as the call stack and the values of local variables in scope once the snapshot set above is reached.

Learn more about production debugging by following the quickstart here.

Debug Logpoint for Debugging

The integration of Stackdriver with Cloud Source Repositories also allows for injecting logging statements without restarting the app. It lets you store, search, analyze, monitor, and alert on log data and events. As an example, a logging statement introduced in the above code is highlighted below.

The logs panel highlights the logs printed by logpoint.

Version control with Cloud Functions

If you’re building a serverless app, you’ll be happy to know that Cloud Source Repositories is also integrated with Cloud Functions. You can store your function source code in Cloud Source Repositories and reference it from event-driven serverless apps. The code stored in Cloud Source Repositories can also be deployed in response to specific triggers, ranging from HTTP, Cloud Pub/Sub, and others. Changes made to function source code are automatically tracked over time, and you can roll back to the previous state of any repository.

In the following example, the “helloworld” function is deployed by an HTTP request. The location of the source code for function can be found in the root directory of the Cloud Source repository.

Learn more about deploying your function source code stored in Cloud Source Repositories using the quickstart here.

In short, the integration of Cloud Source Repositories with other Google Cloud tools lets your team to go from code to deployment in minutes, all while managing versioning and aliasing. You even get the ability to perform production debugging on the fly by using built-in monitoring logging tools. Try Cloud Source Repositories along with these integrations here.

Google is named a leader in the 2018 Gartner Infrastructure as a Service Magic Quadrant


We’re pleased to announce that Gartner recently named Google as a Leader in the 2018 Gartner Infrastructure as a Service Magic Quadrant (report available here).

With an increasing number of enterprises turning to the cloud to build and scale their businesses, research from organizations like Gartner can help you evaluate and compare cloud providers.

We believe being recognized by Gartner as one of the three leading cloud providers demonstrates our commitment to building innovative technology that helps customers run their businesses at scale. It also highlights our goal to help customers transform their businesses through open source and deep investments in analytics and machine learning.

Here are a few takeaways from the report:

A solid compute foundation
Gartner identifies our core IaaS and PaaS capabilities as a strength, and noted that we’re increasingly offering a number of innovative capabilities. From custom machine types and sustained use discounts, to the next generation of cloud-native containerized development and operations through tools like Kubernetes and Istio, we work hard to deliver a cloud that can run your most demanding applications.

Our investments in analytics and ML
The report recognizes the investments we’ve made in advanced analytics and machine learning. Our Google Cloud AI team has been making good progress towards this goal. In 2017, we introduced Cloud Machine Learning Engine, to help developers with machine learning expertise easily build ML models that work on any type of data, of any size. We showed how modern machine learning services, i.e., APIs—including Vision, Speech, NLP, Translation, and Dialogflow—could be built upon pre-trained models to bring scale and speed to business applications. Kaggle, our community of data scientists and ML researchers, has grown to more than one million members. And today, more than 10,000 businesses are using Google Cloud AI services, including companies like Kewpie, and Ocado. Recently introduced Cloud AutoML to help businesses with limited ML expertise start building their own high-quality custom models.

Our commitment to openness
Our strong grounding in the open source ecosystem, with an emphasis on portability, was highlighted in the report. Our goal is to help more organizations take advantage of cloud services, which means offering the tools to build, scale, and quickly move to the cloud. Our dedication to portability and open source gives you the flexibility to build on your own terms.

Sharing our best practices with customers
Our Customer Reliability Engineering (CRE) program is an approach that can help customers succeed while running their operations on Google Cloud Platform (GCP). We built CRE to provide a shared operational fate between you and Google, giving you more control over the critical applications you’ve entrusted with us.

Google Cloud continues to be adopted by enterprises who are looking to achieve greater availability, scalability, and security in the cloud. Gartner’s IaaS Magic Quadrant is now the sixth report from a leading analyst firm that has identified Google Cloud as a Leader. You can download a complimentary copy of the Gartner Cloud Infrastructure as a Service Magic Quadrant report on our website.

Gartner does not endorse any vendor, product or service depicted in its research publications, and does not advise technology users to select only those vendors with the highest ratings or other designation. Gartner research publications consist of the opinions of Gartner's research organization and should not be construed as statements of fact. Gartner disclaims all warranties, expressed or implied, with respect to this research, including any warranties of merchantability or fitness for a particular purpose.

Gain visibility and take control of Stackdriver costs with new metrics and tools


A few months back, we announced new simplified Stackdriver pricing that will go into effect on June 30. We’re excited to bring this change to our users. To streamline this change, you’ll receive advanced notifications and alerting on the performance and diagnostics data you track for cloud applications, plus flexibility in creating dashboards, without having to opt in to the premium pricing tier.

We’ve added new metrics and views to help you understand your Stackdriver usage now as you prepare for the new pricing to take effect. We’ve got some tips to help you maximize value while minimizing costs for your monitoring, logging and application performance management (APM) solutions.

Getting visibility into your monitoring and logging usage

In anticipation of the pricing changes, we’ve added new metrics to make it easier than ever to understand your logs and metrics volume. There are three different ways to view your usage, depending on which tool you prefer: the billing console; updated summary pages in the Stackdriver console; or metrics available via the API and Metrics Explorer.

1. Analyzing Stackdriver costs using the billing console
Stackdriver is now reporting logging and monitoring usage on the new SKUs (fancy name for something you can buy—in this case, volume of metrics or logs), which are visible in the billing console. Don’t worry—until June 30, the costs will still be $0, but you can view your existing volume across your billing account by going to the new reports page in the billing console. To view your current Stackdriver logging and monitoring usage volume, select group by SKU, filter for Log Volume, Metric Volume or Monitoring API Requests, and you’ll see your usage across your billing account. (See more in our documentation). You can also analyze your usage by exporting your billing data to BigQuery. Once you understand your usage, you can easily estimate what your cost will be after June 30 using the pricing calculator under the Upcoming Model tab.

2. Analyzing Stackdriver costs using the Stackdriver console
We’ve also updated the tools for viewing and managing volumes of logs and metrics within Stackdriver itself.


The Logs Ingestion page, above, now shows last month’s volume in addition to the current month’s volume for the project and by resource type. We’ve also added handy links to view detailed usage in Metrics Explorer right from this page as well.

The Monitoring Resource Usage page, above, now shows your metrics volume month-to-date vs. the last calendar month (note that these metrics are brand-new, so they will take some time to populate). All projects in your Stackdriver account are broken out individually. We’ve also added the capability to see your projected total for the month and added links to see the details in Metrics Explorer.

3. Analyzing Stackdriver costs using the API and Metrics Explorer
If you’d like to understand which logs or metrics are costing the most, you’re in luck—we now have even better tools for viewing, analyzing and alerting on metrics. For Stackdriver Logging, we’ve added two new metrics:
  • logging.googleapis.com/billing/bytes_ingested provides real-time incremental delta values that can be used to calculate your rates of log volume ingestion. It does not cover excluded logs volume. This metric provides a resource_type label to analyze log volume by various monitored resource types that are sending logs.
  • logging.googleapis.com/billing/monthly_bytes_ingested provides your usage as a month-to-date sum every 30 minutes and resets to zero every month. This can be useful for alerting on month-to-date log volume so that you can create or update exclusions as needed.
We’ve also added a new metric for Stackdriver Monitoring to make it easier to understand your costs:
  • monitoring.googleapis.com/billing/bytes_ingested provides real-time incremental deltas that can be used to calculate your rate of metrics volume ingestion. You can drill down and group or filter by metric_domain to separate out usage for your agent, AWS, custom or logs-based metrics. You can also drill down by individual metric_type or resource_type.
You can access these metrics via the monitoring API, create charts for them in Stackdriver or explore them in real time in Metrics Explorer (shown below), where you can easily group by the provided labels in each metric, or use Outlier mode to detect top metric or resource type with the highest usage. You can read more about aggregations in our documentation.

If you’re interested in an even deeper analysis of your logs usage, check out this post by one of Google’s Technical Solutions Consultants that will show you how to analyze your log volume using logs-based metrics in Datalab.


Controlling your monitoring and logging costs
Our new pricing model is designed to make the same powerful log and metric analysis we use within Google accessible to everyone who wants to run reliable systems. That means you can focus on building great software, not on building logging and monitoring systems. This new model brings you a few notable benefits:
  • Generous allocations for monitoring, logging and trace, so many small or medium customers can use Stackdriver on their services at no cost.
    • Monitoring: All Google Cloud Platform (GCP) metrics and the first 150 MB of non-GCP metrics per month are available at no cost.
    • Logging: 50 GB free per month, plus all admin activity audit logs, are available at no cost.
  • Pay only for the data you want. Our pricing model is designed to put you in control.
    • Monitoring: When using Stackdriver, you pay for the volume of data you send, so a metric sent once an hour costs 1/60th as much as a metric sent once a minute. You’ll want to keep that in mind when setting up your monitoring schedules. We recommend collecting key logs and metrics via agents or custom metrics for everything in production; development environments may not need the same level of visibility. For custom metrics, you can write points at a smaller time granularity. Another way is to reduce the number of time series sent by avoiding unnecessary labels for custom and logs-based metrics that may have high cardinality.
    • Logging: The exclusion filter in Logging is an incredible tool for managing your costs. The way we’ve designed our system to manage logs is truly unique. As the image below shows, you can choose to export your logs to BigQuery, Cloud Storage or Cloud Pub/Sub without needing to pay to ingest them into Stackdriver.
      You can even use exclusion filters to collect a percentage of logs, such as 1% of successful HTTP responses. Plus, exclusion filters are easy to update, so if you’re troubleshooting your system, you can always temporarily increase the logs you’re ingesting.

Putting it all together: managing to your budget
Let’s look at how to combine the visibility from the new metrics with the other tools in Stackdriver to follow a specific monthly budget. Suppose we have $50 per month to spend on logs, and we’d like to make that go as far as possible. We can afford to ingest 150 GB of logs for the month. Looking at the Log Ingestion page, shown below, we can easily get an idea of our volume from last month—200 GB. We can also see that 75 GB came from our Cloud Load Balancer, so we’ll add an exclusion filter for 99% of 200 responses.

To make sure we don’t go over our budget, we’ll also set a Stackdriver alert, shown below, for when we reach 145 GB on the monthly log bytes ingested. Based on the cost of ingesting log bytes, that’s just before we’ll reach the $50 monthly budget threshold.

Based on this alerting policy, suppose we get an email near the end of the month that our volume is at 145 GB for the month to date. We can turn off ingestion of all logs in the project with an exclusion filter like this:
logName:*

Now only admin activity audit logs will come through, since they don’t count toward any quota and can’t be excluded. Let’s suppose we also have a requirement to save all data access logs on our project. Our sinks to BigQuery for these logs will continue to work, even though we won’t see those logs in Stackdriver Logging until we disable the exclusion filter. So we won’t lose that data during that period of time.


Like managing your household budget, running out of funds at the end of the month isn’t a best practice. Turning off your logs should be considered a last option, similar to turning off your water in your house toward the end of the month. Both these scenarios run the risk of making it harder to put out fires or incidents that may come up. One such risk is that if you have an issue and need to contact GCP support, they won’t be able to see your logs and may not be able to help you.


With these tools, you’ll be able to plan ahead to help ensure you’re avoiding ingesting less useful logs throughout the month. You might turn off unnecessary logs based on use, rejigger production and development environment monitoring or logging, or decide to offload data to another service or database. Our new metrics, views and dashboards give you a lot more tools to see how much you’re spending in both resources and IT budget in Stackdriver. You’ll be able to bring flexibility and efficiency to logging and monitoring, and avoid unpleasant surprises. 


To learn more about Stackdriver, check out our documentation or join in the conversation in our discussion group.


Related content

Introducing VPC-native clusters for Google Kubernetes Engine


[Editor's note: This is one of many posts on enterprise features enabled by Kubernetes Engine 1.10. For the full coverage, follow along here.]

Over the past few weeks, we’ve made some exciting announcements around Google Kubernetes Engine, starting with the general availability of Kubernetes 1.10 in the service. This latest version has new features that will really help enterprise use cases such as support for Shared Virtual Private Cloud (VPC) and Regional Clusters for high availability and reliability.

Building on that momentum, we are excited to announce the ability to create VPC-native clusters in Kubernetes Engine. A VPC-native cluster uses Alias IP routing built into the VPC network, resulting in a more scalable, secure and simple system that is suited for demanding enterprise deployments and use cases.

VPC-native clusters using Alias IP
VPC-native clusters rely on Alias IP which provides integrated VPC support for container networking. Without Alias IP, Kubernetes Engine uses Routes for Pod networking, which requires the Kubernetes control plane to maintain static routes to each Node. By using Alias IP, the VPC control panel automatically manages routing setup for Pods. In addition to this automatic management, native integration of container networking into the VPC fabric improves scalability and integration between Kubernetes and other VPC features.

Alias IP has been available on Google Cloud Platform (GCP) for Google Compute Engine instances for some time. Extending this functionality to Kubernetes Engine provides the following benefits:
  • Scale enhancements - VPC-native clusters no longer carry the burden of Routes and can scale to more nodes. VPC-native clusters will not be subject to Route quotas and limits, allowing you to seamlessly increase your Cluster size.
  • Hybrid connectivity - Alias IP subnets can be advertised by the Cloud Router over Cloud VPN or Cloud Interconnect, allowing you to connect your hybrid on-premises deployments with your Kubernetes Engine cluster. In addition, Alias IP advertisements with Cloud Router gives you granular control over which subnetworks and secondary range(s) are published to peer routers.
  • Better VPC integration - Alias IP provides Kubernetes Engine Pods with direct access to Google services like Google Cloud Storage, BigQuery and any other services served from the googleapis.com domain, without the overhead of a NAT proxy. Alias IP also enables enhanced VPC features such as Shared VPC.
  • Security checks - Alias IP allows you to enable anti-spoofing checks for the Nodes in your cluster. These anti-spoofing checks are provisioned on instances by default to ensure that traffic is not sent from arbitrary source IPs. Since Alias IP ranges in VPC-native clusters are known to the VPC network, they pass anti-spoofing checks by gidefault.
  • IP address management - VPC-native clusters integrate directly into your VPC IP address management system, preventing potential double allocation of your VPC IP space. Route-based clusters required manually blocking off the set of IPs assigned to your Cluster. VPC-native clusters provide two modes of allocating IPs, providing a full spectrum of control to the user. In the default method, Kubernetes Engine auto-selects and assigns secondary ranges for Pods and Services ranges. And if you need tight control over subnet assignments, you can create a custom subnet and secondary ranges and use it for Node, Pods and Service IPs. With Alias IP, GCP ensures that the Pod IP addresses cannot conflict with IP addresses on other resources.
Early adopters are already benefiting from the security and scale of VPC-native clusters in Kubernetes Engine. Vungle, an in-app video advertising platform for performance marketers, uses VPC-native clusters in Kubernetes Engine for its demanding applications
“VPC-native clusters, using Alias IPs, in Google Kubernetes Engine allowed us to run our bandwidth-hungry applications on Kubernetes without any of the performance degradation that we had seen when using overlay networks."
- Daniel Nelson, Director of Engineering, Vungle
Try it out today!
Create VPC-native clusters in Kubernetes Engine to get the ease of access and scale enterprise workloads require. Also, don’t forget to sign up for our upcoming webinar, 3 reasons why you should run your enterprise workloads on Google Kubernetes Engine.

Stackdriver brings powerful alerting capabilities to the condition editor UI


If you use Stackdriver, you probably rely on our alerting stack to be informed when your applications are misbehaving or aren’t performing as expected. We know how important it is to receive notifications at the right time as well as in the right situation. Imprecisely specifying what situation you want to be alerted on can lead to too many alerts (false positives) or too few (false negatives). When defining a Stackdriver alerting policy, it’s imperative that conditions be made as specific as possible, which is part of the reason that we introduced the ability to manage alerting policies in the Stackdriver Monitoring API last month. This, for example, enables users to create alerting conditions for resources filtered by certain metadata so that they can assign different conditions to parts of their applications that use similar resources but perform different functions.

But what about users who want to specify similar filters and aggregations using the Stackdriver UI? How can you get a more precise way to define the behavior that a metric must exhibit for the condition to be met (for example, alerting on certain resources filtered by metadata), as well as a more visual way of finding the right metrics to alert on for your applications?

We’ve got you covered. We are excited to announce the beta version of our new alerting condition configuration UI. In addition to allowing you to define alerting conditions more precisely, this new UI provides an easier, more visual way to find the metrics to alert on. The new UI lets you use the same metrics selector as used in Stackdriver’s Metrics Explorer to define a broader set of conditions. Starting today, you can use that metrics selector to create and edit threshold conditions for alerting policies. The same UI that you use to select metrics for charts can now be used for defining alerting policy conditions. It’s a powerful and more complete method for identifying your time series and specific aggregations. You’ll be able to express more targeted, actionable alerts with fewer false alerts.

We’ve already seen some great use cases for this functionality. Here are some ways in which our users have used this UI during early testing:

1. Alerting on aggregations of custom metrics and logs-based metrics
The ability to alert on aggregations of custom metrics or logs-based metrics is a common request from our users. This was recently made possible with the introduction of support for alerting policy management in the Stackdriver Monitoring v3 API. However, until this beta launch, there was no visual equivalent. With the introduction of this new UI, you can now visually explore metrics and define their alerting conditions before committing to an alerting policy. This adds a useful visual representation so you’ll have choices when setting up alert policies.

For example, below is a screen recording that shows how to aggregate a sum across a custom metrics grouped by pod:

2. Filter metadata to alert on specific Kubernetes resources
With the recent introduction of Stackdriver Kubernetes Monitoring, you have more out-of-the-box observability into your Kubernetes clusters. Now, with the addition of this new threshold condition UI, you can set up alerts on specific resources defined by metadata fields, instead of having to include the entire cluster.

For example, below is a screen recording showing how to alert when Kubernetes resources with a specific service name (customers-service) cross a certain aggregated threshold of the bytes transmitted. Using the metrics selector, you can configure the specific filters, grouping and aggregations that you’re interested in:

3. Edit metric threshold conditions that were created via the API
Many Stackdriver users utilize both the API and the alerting UI to create and edit alerting conditions. With this release, you can edit directly in the new UI many conditions that were previously created using the API.

Getting started with the new Stackdriver condition editor UI
To use the new UI, you must first opt in. When adding a policy condition, go to the Select condition type page. At the top of this page is an invitation to try a new variant of the UI:

Note that the new condition editor does not support process-health and uptime-check conditions, which continue to use the existing UI. The new UI supports all other condition types.

If you prefer to go back to the current UI, you can do so at any time by opting out. We’re looking forward to hearing more from users about what you’re accomplishing with the new UI.

To learn more, check out some specifics here on using the alerting UI.

Please send us feedback either via the feedback widget (click on your avatar -> Send Feedback), or by emailing us.

Related content:
New ways to manage and automate your Stackdriver alerting policies
Extracting value from your logs with Stackdriver logs-based metrics
Announcing Stackdriver Kubernetes Monitoring: Comprehensive Kubernetes observability from the start

Kubernetes best practices: mapping external services


Editor’s note: Today is the sixth installment in a seven-part video and blog series from Google Developer Advocate Sandeep Dinesh on how to get the most out of your Kubernetes environment.

If you’re like most Kubernetes users, chances are you use services that live outside your cluster. For example, maybe you use the Twillio API to send text messages, or maybe the Google Cloud Vision API to do image analysis.

If your applications in your different environments connect to the same external endpoint, and have no plans to bring the external service into your Kubernetes cluster, it is perfectly fine to use the external service endpoint directly in your code. However, there are many scenarios where this is not the case.

A good example of this are databases. While some cloud-native databases such as Cloud Firestore or Cloud Spanner use a single endpoint for all access, most databases have separate endpoints for different instances.

At this point, you may be thinking that a good solution to finding the endpoint is to use ConfigMaps. Simply store the endpoint address in a ConfigMap, and use it in your code as an environment variable. While this solution works, there are a few downsides. You need to modify your deployment to include the ConfigMap and write additional code to read from the environment variables. But most importantly, if the endpoint address changes you may need to restart all running containers to get the updated endpoint address.

In this episode of “Kubernetes best practices”, let’s learn how to leverage Kubernetes’ built-in service discovery mechanisms for services running outside the cluster, just like you can for services inside the cluster! This gives you parity across your dev and prod environments, and if you eventually move the service inside the cluster, you don’t have to change your code at all.

Scenario 1: Database outside cluster with IP address

A very common scenario is when you are hosting your own database, but doing so outside the cluster, for example on a Google Compute Engine instance. This is very common if you run some services inside Kubernetes and some outside, or need more customization or control than Kubernetes allows.

Hopefully, at some point, you can move all services inside the cluster, but until then you are living in a hybrid world. Thankfully, you can use static Kubernetes services to ease some of the pain.

In this example, I created a MongoDB server using Cloud Launcher. Because it is created in the same network (or VPC) as the Kubernetes cluster, it can be accessed using the high performance internal IP address. In Google Cloud, this is the default setup, so there is nothing special you need to configure.

Now that we have the IP address, the first step is to create a service:
kind: Service
apiVersion: v1
metadata:
 name: mongo
Spec:
 type: ClusterIP
 ports:
 - port: 27017
   targetPort: 27017
You might notice there are no Pod selectors for this service. This creates a service, but it doesn’t know where to send the traffic. This allows you to manually create an Endpoints object that will receive traffic from this service.

kind: Endpoints
apiVersion: v1
metadata:
 name: mongo
subsets:
 - addresses:
     - ip: 10.240.0.4
   ports:
     - port: 27017
You can see that the Endpoints manually defines the IP address for the database, and it uses the same name as the service. Kubernetes uses all the IP addresses defined in the Endpoints as if they were regular Kubernetes Pods. Now you can access the database with a simple connection string:
mongodb://mongo
> No need to use IP addresses in your code at all! If the IP address changes in the future, you can update the Endpoint with the new IP address, and your applications won’t need to make any changes.

Scenario 2: Remotely hosted database with URI

If you are using a hosted database service from a third party, chances are they give you a unified resource identifier (URI) that you can use to connect to. If they give you an IP address, you can use the method in Scenario 1.

In this example, I have two MongoDB databases hosted on mLab. One of them is my dev database, and the other is production.

The connection strings for these databases are as follows:
mongodb://<dbuser>:<dbpassword>@ds149763.mlab.com:49763/dev
mongodb://<dbuser>:<dbpassword>@ds145868.mlab.com:45868/prod
mLab gives you a dynamic URI and a dynamic port, and you can see that they are both different. Let’s use Kubernetes to create an abstraction layer over these differences. In this example, let’s connect to the dev database.

You can create a “ExternalName” Kubernetes service, which gives you a static Kubernetes service that redirects traffic to the external service. This service does a simple CNAME redirection at the kernel level, so there is very minimal impact on your performance.

The YAML for the service looks like this:
kind: Service
apiVersion: v1
metadata:
 name: mongo
spec:
 type: ExternalName
 externalName: ds149763.mlab.com
Now, you can use a much more simplified connection string:
mongodb://<dbuser>:<dbpassword>@mongo:<port>/dev
Because “ExternalName” uses CNAME redirection, it can’t do port remapping. This might be okay for services with static ports, but unfortunately it falls short in this example, where the port is dynamic. mLab’s free tier gives you a dynamic port number and you cannot change it. This means you need a different connection string for dev and prod.

However, if you can get the IP address, then you can do port remapping as I will explain in the next section.

Scenario 3: Remotely hosted database with URI and port remapping

While the CNAME redirect works great for services with the same port for each environment, it falls short in scenarios where the different endpoints for each environment use different ports. Thankfully we can work around that using some basic tools.

The first step is to get the IP address from the URI.

If you run the nslookup, hostname, or ping command against the URI, you can get the IP address of the database.

You can now create a service that remaps the mLab port and an endpoint for this IP address.
kind: Service
apiVersion: v1
metadata:
 name: mongo
spec:
 ports:
 - port: 27017
   targetPort: 49763
---
kind: Endpoints
apiVersion: v1
metadata:
 name: mongo
subsets:
 - addresses:
     - ip: 35.188.8.12
   ports:
     - port: 49763
Note: A URI might use DNS to load-balance to multiple IP addresses, so this method can be risky if the IP addresses change! If you get multiple IP addresses from the above command, you can include all of them in the Endpoints YAML, and Kubernetes will load balance traffic to all the IP addresses.

With this, you can connect to the remote database without needing to specify the port. The Kubernetes service does the port remapping transparently!
mongodb://<dbuser>:<dbpassword>@mongo/dev

Conclusion

Mapping external services to internal ones gives you the flexibility to bring these services into the cluster in the future while minimizing refactoring efforts. Even if you don’t plan to bring them in today, you never know what tomorrow might bring! Additionally, it makes it easier to manage and understand which external services your organization is using.

If the external service has a valid domain name and you don’t need port remapping, then using the “ExternalName” service type is an easy and quick way to map the external service to an internal one. If you don’t have a domain name or need to do port remapping, simply add the IP addresses to an endpoint and use that instead.

Going to Google Cloud Next18? Stop by to meet me and other Kubernetes team members in the "Meet the Experts" zone! Hope to see you there!

Beyond CPU: horizontal pod autoscaling with custom metrics in Google Kubernetes Engine


Many customers of Kubernetes Engine, especially enterprises, need to autoscale their environments based on more than just CPU usage—for example queue length or concurrent persistent connections. In Kubernetes Engine 1.9 we started adding features to address this and today, with the latest beta release of Horizontal Pod Autoscaler (HPA) on Kubernetes Engine 1.10, you can configure your deployments to scale horizontally in a variety of ways.

To walk you through your different horizontal scaling options, meet Barbara, a DevOps engineer working at a global video-streaming company. Barbara runs her environment on Kubernetes Engine, including the following microservices:
  • A video transcoding service that processes newly uploaded videos
  • A Google Cloud Pub/Sub queue for the list of videos that the transcoding service needs to process
  • A video-serving frontend that streams videos to users
A high-level diagram of Barbara’s application.

To make sure she meets the service level agreement for the latency of processing the uploads (which her company defines as a total travel time of the uploaded file) Barbara configures the transcoding service to scale horizontally based on the queue length—adding more replicas when there are more videos to process or removing replicas and saving money when the queue is short. In Kubernetes Engine 1.10 she accomplishes that by using the new ‘External’ metric type when configuring the Horizontal Pod Autoscaler. You can read more about this here.

apiVersion: autoscaling/v2beta1                                                 
kind: HorizontalPodAutoscaler                                                   
metadata:                                                                       
  name: transcoding-worker                                                                    
  namespace: video                                                            
spec:                                                                           
  minReplicas: 1                                                                
  maxReplicas: 20                                                                
  metrics:                                                                      
  - external:                                                                      
      metricName: pubsub.googleapis.com|subscription|num_undelivered_messages   
      metricSelector:                                                           
        matchLabels:                                                            
          resource.labels.subscription_id: transcoder_subscription                            
      targetAverageValue: "10"                                                   
    type: External                                                              
  scaleTargetRef:                                                               
    apiVersion: apps/v1                                              
    kind: Deployment                                                            
    name: transcoding-worker
To handle scaledowns correctly, Barbara also makes sure to set graceful termination periods of pods that are long enough to allow any transcoding already happening on pods to complete. She also writes her application to stop processing new queue items after it receives the SIGTERM termination signal from Kubernetes Engine.
A high-level diagram of Barbara’s application showing the scaling bottleneck.

Once the videos are transcoded, Barbara needs to ensure great viewing experience for her users. She identifies the bottleneck for the serving frontend: the number of concurrent persistent connections that a single replica can handle. Each of her pods already exposes its current number of open connections, so she configures the HPA object to maintain the average value of open connections per pod at a comfortable level. She does that using the Pods custom metric type.

apiVersion: autoscaling/v2beta1                                                 
kind: HorizontalPodAutoscaler                                                   
metadata:                                                                       
  name: frontend                                                                    
  namespace: video                                                            
spec:                                                                           
  minReplicas: 4                                                                
  maxReplicas: 40                                                                
  metrics:  
  - type: Pods
    pods:
      metricName: open_connections
      targetAverageValue: 100                                                                                                                            
  scaleTargetRef:                                                               
    apiVersion: apps/v1                                              
    kind: Deployment                                                            
    name: frontend
To scale based on the number of concurrent persistent connections as intended, Barbara also configures readiness probes such that any saturated pods are temporarily removed from the service until their situation improves. She also ensures that the streaming client can quickly recover if its current serving pod is scaled down.

It is worth noting here that her pods expose the open_connections metric as an endpoint for Prometheus to monitor. Barbara uses the prometheus-to-sd sidecar to make those metrics available in Stackdriver. To do that, she adds the following YAML to her frontend deployment config. You can read more about different ways to export metrics and use them for autoscaling here.

containers:
  ...
  - name: prometheus-to-sd
    image: gcr.io/google-containers/prometheus-to-sd:v0.2.6
    command:
    - /monitor
    - --source=:http://localhost:8080
    - --stackdriver-prefix=custom.googleapis.com
    - --pod-id=$(POD_ID)
    - --namespace-id=$(POD_NAMESPACE)
    env:
    - name: POD_ID
      valueFrom:
        fieldRef:
          apiVersion: v1
          fieldPath: metadata.uid
    - name: POD_NAMESPACE
      valueFrom:
        fieldRef:
          fieldPath: metadata.namespace
Recently, Barbara’s company introduced a new feature: streaming live videos. This introduces a new bottleneck to the serving frontend. It now needs to transcode some streams in real- time, which consumes a lot of CPU and decreases the number of connections that a single replica can handle.
A high-level diagram of Barbara’s application showing the new bottleneck due to CPU intensive live transcoding.
To deal with that, Barbara uses an existing feature of the Horizontal Pod Autoscaler to scale based on multiple metrics at the same time—in this case both the number of persistent connections as well as CPU consumption. HPA selects the maximum signal of the two, which is then used to trigger autoscaling:

apiVersion: autoscaling/v2beta1                                                 
kind: HorizontalPodAutoscaler                                                   
metadata:                                                                       
  name: frontend                                                                    
  namespace: video                                                            
spec:                                                                           
  minReplicas: 4                                                                
  maxReplicas: 40                                                                
  metrics:  
  - type: Pods
    pods:
      metricName: open_connections
      targetAverageValue: 100
  - type: Resource
    resource:
      name: cpu
      targetAverageUtilization: 60                                                                                                                        
  scaleTargetRef:                                                               
    apiVersion: apps/v1                                              
    kind: Deployment                                                            
    name: frontend
These are just some of the scenarios that HPA on Kubernetes can help you with.

Take it for a spin

Try Kubernetes Engine today with our generous 12-month free trial of $300 credits. Spin up a cluster (or a dozen) and experience the difference of running Kubernetes on Google Cloud, the cloud built for containers. And watch this space for future posts about how to use Cluster Autoscaler and Horizontal Pod Autoscaler together to make the most out of Kubernetes Engine.