Category Archives: Google Cloud Platform Blog

Product updates, customer stories, and tips and tricks on Google Cloud Platform

Google Cloud Endpoints now generally available: a fast, scalable API gateway


Today we're excited to announce general availability and full support for Google Cloud Endpoints, a truly distributed API gateway. It features a server-local proxy (the Extensible Service Proxy) and is built on the same services that Google uses to power its own APIs. For developers building applications and microservices on Google Cloud Platform (GCP), Cloud Endpoints is the best-suited modern API gateway that helps secure and monitor their APIs.

APIs are a critical part of mobile apps, modern web applications and microservices. With the increased focus on APIs comes increased responsibility: the top features you need to take care of your API are authorization, monitoring and logging. In other words, “Help make my API safer” and “Tell me how my API is doing.” And, above all: “Help make sure it is highly performant!”

Cloud Endpoints helps you with all of that. Through integrations with Firebase and Auth0, Cloud Endpoints authenticates each call to your API  so you know who's using your mobile and web apps. Cloud Endpoints also validates service-to-service calls, helping to keep your microservices more secure. You can create API keys via the Google Cloud Console, just like we do for APIs such as the Google Translation API and the Google Maps APIs. It logs API calls to Stackdriver Logging and displays a monitoring dashboard in the console, giving you critical status information about the health and performance of your API.

Cloud Endpoints is tightly integrated with the GCP ecosystem and is easy to use especially when running containerized workloads. The API proxy is built into Google App Engine flexible environment and can be added to any Kubernetes or Google Container Engine deployment with a couple of lines of YAML. Deployment occurs through gcloud, and the monitoring and logging is all in Cloud Console. The proxy functionality is also built into the Endpoints API Frameworks (see below) for use on App Engine standard environment.

Cloud Endpoints is ideal for GCP customers who need a fast, scalable API gateway. Enterprise customers can also take advantage of Apigee Edge, an industry leading API management platform that we acquired this fall, for full-featured API management that works across on-premises, cloud and hybrid deployment models.

Endpoints has been in beta for three months and our early adopters are already doing amazing things with it. We’ve seen people going from initial evaluation to production in days, and scalability has been terrific: one customer’s API peaked at over 11,000 requests per second, and another customer served nearly 50 million requests in a day.
“When migrating our workloads to Google Cloud Platform, we needed to securely communicate between multiple data centres. Traditional methods like firewalls and ad hoc authentication were unsustainable, quickly leading to a jumbled mess of ACLs. Endpoints, on the other hand, gives us a standardised authentication system, backed by Google's security pedigree.”  Laurie Clark-Michalek, Infrastructure Engineer at Qubit

Frameworks

For developers working on App Engine standard environment, we're also announcing general availability and full support for our Java and Python frameworks. The Endpoints Frameworks are available to help developers quickly get started serving an API from App Engine. Think of the Endpoints Frameworks as lightweight alternatives to Python Flask or Java Jersey. The Endpoints Frameworks come with built-in integration to the Google Service Control API, meaning that back-ends built with the Endpoints Frameworks do not need to run behind the Extensible Service Proxy.

Pricing

We want everyone to be able to benefit from Cloud Endpoints, so we created a free tier so that your first two million API calls per month are available at no charge. Once your service is popular enough to go beyond the free-tier, the pricing is a simple $3.00 per million requests.

The Endpoints Frameworks can optionally expose all of the features of the Cloud Endpoints API gateway. The Endpoints Frameworks can be used at no cost, but the Endpoints API gateway features turned on with the Frameworks (API keys, monitoring and logging) are charged at the standard rate.

Go ahead, read the documentation, try our walkthroughs for App Engine (standard or flexible environment), Container Engine or Compute Engine and join our Google Cloud Endpoints Google Group. To hear more about Google’s vision on comprehensive API technologies for enterprise customers and developers, including more about Apigee Edge, please join us next month at Google Cloud Next '17 in San Francisco.

5 must-see security sessions at Google Cloud Next ’17


So many sessions, so little time. Google Cloud Next '17, taking place next month, features over 200 breakout sessions; many geared directly at security professionals. If you only have time on your schedule for a few security breakouts, here are the ones you can’t afford to miss.

For a foundation in how we help secure Google Cloud Platform (GCP)  and for a peek at the various security threats Google grapples with day in and day out  check out “Lessons learned from securing both Google and Google Cloud customers.” Here, Andy Chang, Google Senior Product Manager, will discuss the various layers of Google security, its security team and what it’s learned from preventing, detecting and responding to cyber attacks over the years.

Now that you better understand our security features, learn how to attach your on-prem environment to Google Cloud via Virtual Private Cloud. In “How to create a secure, private environment in the cloud and on-prem with Google Cloud Virtual Private Clouds,” Ines Envid, Google Product Manager, and Neha Pattan, Software Engineer, will show you how to build a sandbox to run your cloud workloads alongside on-prem applications, as well as how to integrate with GCP’s machine learning, big data and storage services.

More and more, building cloud applications means building mobile applications. In “Security first for a mobile first strategy,” director of Android security Adrian Ludwig discusses the multiple layers of protection that the Android platform provides to help keep business and personal information safe.

We do our part on the backend, but it’s up to you to write quality apps. In “Designing secure UX into your products,” Google senior developer advocate Mandy Waite discusses best practices you should follow when building apps and services, plus how Google protects against threats like malware and phishing attacks.

At a fundamental level, for many of our customers, keeping their business safe is rooted in protecting email. In “Trends in data security,” Gilad Golan, Google Director for Security and Data Protection, and Nicolas Lidzborski, Staff Software Engineer, describe our latest innovations in email security  and how you can apply those to your organization.

As an added bonus, we’re also offering a full-day security bootcamp before the show. Register now to reserve your spot, and see you at NEXT!

Fuzzing PCI express: security in plaintext


Google recently launched GPUs on Google Cloud Platform (GCP), which will allow customers to leverage this hardware for highly parallel workloads. These GPUs are connected to our cloud machines via a variety of PCIe switches, and that required us to have a deep understanding of PCIe security.

Securing PCIe devices requires overcoming some inherent challenges. For instance, GPUs have become far more complex in the past few decades, opening up new avenues for attack. Since GPUs are designed to directly access system memory, and since hardware has historically been considered trusted, it's difficult to ensure all the settings to keep it contained are set accurately, and difficult to ensure whether such settings even work. And since GPU manufacturers don't make the source code or binaries available for the GPU's main processes, we can't examine those to gain more confidence. You can read more about the challenges presented by the PCI and PCIe specs here.

With the risk of malicious behavior from compromised PCIe devices, Google needed to have a plan for combating these types of attacks, especially in a world of cloud services and publicly available virtual machines. Our approach has been to focus on mitigation: ensuring that compromised PCIe devices can’t jeopardize the security of the rest of the computer.

Fuzzing to the rescue

A key weapon in our arsenal is fuzzing, a testing technique that uses invalid, unexpected or random inputs to expose irregular behavior, such as memory leaks, crashes, or undocumented functionality. The hardware fuzzer we built directly tests the behavior of the PCIe switches used by our cloud GPUs.

After our initial research into the PCIe spec, we prepared a list of edge cases and device behaviors that didn’t have clearly defined outcomes. We wanted to test these behaviors on real hardware, and we also wanted to find out whether real hardware implemented the well defined parts of the spec properly. Hardware bugs are actually quite common, but many security professionals assume their absence, simply trusting the manufacturer. At Google, we want to verify every layer of the stack, including hardware.

Our plan called for a fuzzer that was highly specialized, and designed to be effective against the production configurations we use in our cloud hardware. We use a variety of GPU and switch combinations on our machines, so we set up some programmable network interface controllers (NICs) in similar configurations to simulate GPU memory accesses.

Our fuzzer used those NICs to aggressively hammer the port directly upstream from each NIC, as well as any other accessible ports in the network, with a variety of memory reads and writes. These operations included a mixture of targeted attacks, randomness and "lucky numbers" that tend to cause problems on many hardware architectures. We wanted to detect changes to the configuration of any port as a result of the fuzzing, particularly the port's secondary and subordinate bus numbers. PCIe networks with Source Validation enabled are governed primarily by these bus numbers, which dictate where packets can and cannot go. Being able to reconfigure a port's secondary or subordinate bus numbers could give you access to parts of the PCIe network that should be forbidden.

Our security team reviewed any suspicious memory reads or writes to determine if they represent security vulnerabilities, and adjusted either the fuzzer or our PCIe settings accordingly.

We discovered some curiosities. For instance, on one incorrect configuration, some undocumented debug registers on the switch were incorrectly exposed to downstream devices, which we discovered could cause serious malfunctioning of the switch under certain access patterns. If a device can cause out-of-spec behavior in the switch it’s connected to, it may be able to cause insecure routing, which would compromise the entire network. The value of fuzzing is its ability to find vulnerabilities in undocumented and undefined areas, outside the normal set of behaviors and operations defined in the spec. But by the end of the process, we had determined a minimum set of ACS features necessary to securely run GPUs in the cloud.

Let's check out those memory mappings too


When you make use of a GPU on a local computer through the root OS, it has direct memory access to the computer’s memory. This is very fast and straightforward. However, that model doesn't work in a virtualized environment like Google Compute Engine.

When a virtual machine is initialized, a set of page tables maps the guest's physical memory to the host's physical memory, but the GPU has no way to know about those mappings, and thus will attempt to write to the wrong places. This is where the Input–output memory management unit (IOMMU) comes in. The IOMMU is a page table, translating GPU accesses into DRAM/MMIO reads and writes. It's implemented in hardware, which reduces the remapping overhead.

This means the IOMMU is performing a pretty delicate operation. It’s mapping its own I/O virtual addresses into host physical addresses. We wanted to verify that the IOMMU was functioning correctly, and ensure that it was enabled any time a device may be running untrusted code, so that there would be no opportunity for unfiltered accesses.

Furthermore, there were features of the IOMMU that we didn't want, like compatibility interrupts. This is a type of interrupt that exists to support older Intel platforms that lack the interrupt-remapping capabilities that the IOMMU gives you. They're not necessary for modern hardware, and leaving them enabled allows guests to trigger unexpected MSIs, machine reboots, and host crashes.

The most interesting challenge here is protecting against PCIe's Address Translation Services (ATS). Using this feature, any device can claim it's using an address that's already been translated, and thus bypass IOMMU translation. For trusted devices, this is a useful performance improvement. For untrusted devices, this is a big security threat. ATS could allow a compromised device to ignore the IOMMU and write to places it shouldn't have access to.

Luckily, there's an ACS setting that can disable ATS for any given device. Thus, we disabled compatibility interrupts, disabled ATS, and had a separate fuzzer attempt to access memory outside the range specifically mapped to it. After some aggressive testing we determined that the IOMMU worked as advertised and could not be bypassed by a malicious device.

Conclusions


Beyond simply verifying our hardware in a test environment, we wanted to make sure our hardware remains secure in all of production. Misconfigurations are likely the biggest source of major outages in production environments, and it's a similar story with security vulnerabilities. Since ACS and IOMMU can be enabled or disabled at multiple layers of the stack—potentially varying between kernel versions, the default settings of the device, or other seemingly-minor tweaks—we would be remiss to rely solely on isolated unit tests to verify these settings. So, we developed tooling to monitor the ACS and IOMMU settings in production, so that any misconfiguration of the system could be quickly detected and rolled back.

As much as possible, it's good practice not to trust hardware without first verifying that it works correctly, and our targeted attacks and robust fuzzing allowed us to settle on a list of ACS settings that allow us to share GPUs with cloud users securely. This has resulted in being able to provide GPUs to our customers with a high degree of confidence in the security of the underlying system. Stay tuned for more posts that detail how we implement security at Google Cloud.

Windows and .NET Codelabs: an overview


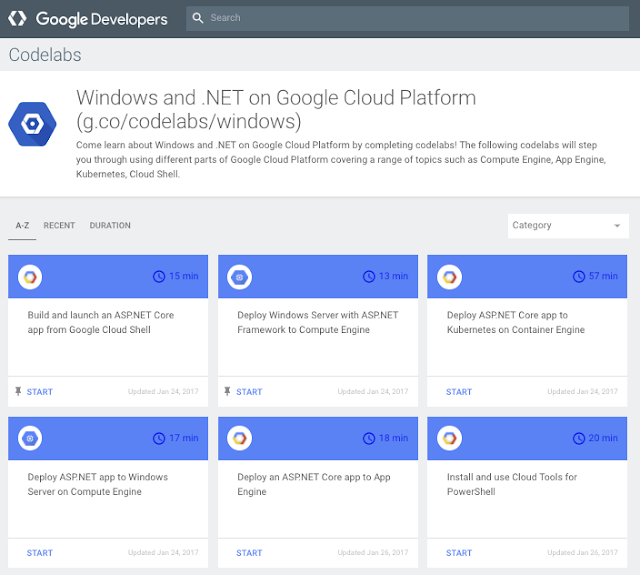
Google Developers Codelabs provide guided coding exercises to get hands-on experience with a wide range of topics such as Android Wear, Firebase and Web. Google Cloud Platform (GCP) has its own section, with codelabs for Google Compute Engine, Google App Engine, Kubernetes and many more.

We’re always working to create new content, and I’m happy to announce that we now have new codelabs for running Windows and .NET apps on GCP, with their own dedicated page. Here’s an overview to help you get started.

First, if you’re a .NET developer, you probably love and use Visual Studio daily. Install and use Cloud Tools for Visual Studio teaches you how to install and use our GCP plugin for Visual Studio.

If you're a traditional ASP.NET developer writing apps for Windows Server, Deploy Windows Server with ASP.NET Framework to Compute Engine is the first codelab you should try. It teaches you how to deploy a Windows Server with ASP.NET Framework on Compute Engine.

Once you have your Windows Server deployed, you can try Deploy ASP.NET app to Windows Server on Compute Engine. It shows you how to take a simple ASP.NET app and publish it to your Windows Server from Visual Studio. These two codelabs provide a good understanding of traditional ASP.NET development and deployment on GCP.

If you've already made the switch to ASP.NET Core, the new multi-platform version of ASP.NET, then start with Build and launch an ASP.NET Core app from Google Cloud Shell to learn how to build and test a basic ASP.NET Core app from Cloud Shell. The whole codelab can be done inside your browser, which is pretty cool!

Afterwards, you can take this app and either deploy to App Engine or to Kubernetes on Google Container Engine. App Engine is definitely the easier path, and Deploy an ASP.NET Core app to App Engine can show you the way. If you want to tackle Kubernetes, you can follow Deploy ASP.NET Core app to Kubernetes on Container Engine to create a Kubernetes cluster of ASP.NET Core pods.

Regardless of where you deploy your app, you need to manage it, and we have a codelab on PowerShell to help with that: Install and use Cloud Tools for PowerShell teaches the use of our PowerShell cmdlets to access and manage GCP resources via PowerShell scripts.

I hope this gives you a good overview of where to start with Windows and .NET codelabs on GCP. We'll be adding more to our dedicated page for Windows and .NET, so be sure to check back regularly.

8 must-see sessions for application developers at Google Cloud Next ’17


With 200-plus sessions to choose from at Google Cloud Next ‘17 on March 8 - 10, there’s a little bit of something for everyone. But if you’re an application developer coming to the show, here are a few sessions in particular that I recommend you check out.

The most popular application development platform on Google Cloud Platform (GCP) is Java. If that describes your shop, be sure to check out "Power your Java workloads on Google Cloud Platform," with Amir Rouzrokh, Product Manager for all things Java on GCP. Amir will show attendees how to deploy a Spring Boot application to GCP, plus how to use Cloud Tools for IntelliJ to troubleshoot production problems.

In the past year, we’ve also made big strides supporting Microsoft platforms like ASP.NET on GCP. For a taste, check out Google Developer Advocate Mete Atamel’s talk “Take your ASP.NET apps to the next level with Google Cloud,” where he’ll cover how to migrate an ASP.NET app to GCP, how to work with our Powersehll cmdlets and Visual Studio plugins and how to tie into advanced GCP services like Google Cloud Storage, Cloud Pub/Sub and our Machine Learning APIs. Then there’s "Running .NET and containers in Google Cloud Platform" with Jon Skeet and Chris Smith, who will show you the next generation of OSS, cross-platform .NET Core apps running in Containers in Google App Engine and in Kubernetes.

Speaking of App Engine, here’s your chance to learn all about App Engine flexible environment, our next-generation PaaS offering. In "You can run that on App Engine?," Product Manager Justin Beckwith shows you how to easily build production-scale web apps for an expanded variety of application patterns.

We’re also excited to talk more about Apigee, the API management platform we acquired in the fall. At “Using Apigee Edge to create and publish APIs that developers love,” Greg Brail, Principal Software Engineer and Prithpal Bhogil, GCP Sales Engineer, will walk developers through how to use Apigee Edge and best practices for building developer-friendly APIs.

Newcomers to GCP may also enjoy Google Cloud Product Manager Omar Ayoub’s session, "Developing made easy on Google Cloud Platform", where we’ll provide an overview of all the different libraries, IDE and framework integrations and other tools for developing applications on GCP.

But the hottest application development topic at Next '17 is arguably Google Cloud Functions, our event-based computing platform that we announced in alpha last year. For an introduction to Cloud Functions, there’s "Building serverless applications with Google Cloud Functions" with Product Manager Jason Polites. Mobile developers should also consider "Google Cloud Functions and Firebase", marrying our mobile backend as a service offering with Cloud Functions’ lightweight, asynchronous compute.

Of course, that’s just the tip of the iceberg when it comes to application development sessions. Be sure to check out the full session catalog, and register sooner rather than later to secure your spot in the most coveted sessions and bootcamps.

Delivering a better platform for your SQL Server Enterprise workloads


Our goal at Google Cloud Platform (GCP) is to be the best enterprise cloud environment. Throughout 2016, we worked hard to ensure that Windows developers and IT administrators would feel right at home when they came to GCP: whether it’s building an ASP.NET application with their favorite tools like Visual Studio and PowerShell, or deploying the latest version of Windows Server onto Google Compute Engine.

Continuing our work in providing great infrastructure for enterprises running Windows, we’re pleased to announce pre-configured images for Microsoft SQL Server Enterprise and Windows Server Core on Compute Engine. High-availability and disaster recovery are top of mind for our larger customers, so we’re also announcing support for SQL Server AlwaysOn Availability Groups and persistent disk snapshots integrated with Volume Shadow Copy Service (VSS) on Windows Server. Finally, all of our Windows Server images are now enabled with Windows Remote Management support, including our Windows Server Core 2016 and 2012 R2 images.

SQL Server Enterprise Edition images on GCE


You can now launch Compute Engine VMs with Microsoft SQL Server Enterprise Edition pre-installed, and pay by the minute for SQL Server Enterprise and Windows Server licenses. Customers can also choose to bring their own licenses for SQL Server Enterprise.

We now support pre-configured images for the following versions in Beta:

  • SQL Server Enterprise 2016
  • SQL Server Enterprise 2014
  • SQL Server Enterprise 2012 
Supported SQL Server images available on Compute Engine (click to enlarge)

SQL Server Enterprise
targets mission-critical workloads by supporting more cores, higher memory and important enterprise features, including:

  • In-memory tables and indexes
  • Row-level security and encryption for data at rest or in motion
  • Multiple read-only replicas for integrated HA/DR and read scale-out
  • Business intelligence and rich visualizations on all platforms, including mobile
  • In-database advanced analytics with R


Combined with Google’s world-class infrastructure, SQL Server instances running on Compute Engine benefit from price-to-performance advantages, highly customizable VM sizes and state-of-the-art networking and security capabilities. With automatic sustained use discounts and the prospect of retiring hardware and associated maintenance on the horizon, customers can achieve total costs lower than those of other cloud providers.

To get started, learn how to create SQL Server instances easily on Google Compute Engine.


High-availability and disaster recovery for SQL Server VMs


Mission-critical SQL Server workloads require support for high-availability and disaster recovery. To achieve this, GCP supports Windows Server Failover Clustering (WSFC) and SQL Server AlwaysOn Availability Groups. AlwaysOn Availability Groups is SQL Server’s flagship HA/DR solution, allowing you to configure replicas for automatic failover in case of failure. These replicas can be readable, allowing you to offload read workloads and backups.

Compute Engine users can now configure AlwaysOn Availability Groups. This includes configuring replicas on VMs in different isolated zones as described in these instructions.
A highly available SQL Server reference architecture using Windows Server Failover Clustering and SQL Server AlwaysOn Availability Groups (click to enlarge)


Better backups with VSS-integrated persistent disk snapshots for Windows VMs


Being able to take snapshots in coordination with Volume Shadow Copy Service ensures that you get application-consistent snapshots for persistent disks attached to an instance running Windows -- without having to shut it down. This feature is useful when you want to take a consistent backup for VSS-enabled applications like SQL Server and Exchange Server without affecting the workload running on the VMs.

To get started with VSS-enabled persistent disk snapshots, select Snapshots under the Cloud Console Compute Engine page. There you'll see a new check-box on the disk snapshot creation page that allows you to specify whether a snapshot should be VSS-enabled.
(click to enlarge)

This feature can also be invoked via the gcloud SDK and API, following these instructions.

Looking ahead


GCP’s expanded support for SQL Server images and high availability are our latest efforts to improve Windows support on Compute Engine, and to build a cloud environment for enterprise Windows that leads the industry. Last year we expanded our list of pre-configured images to include SQL Server Standard, SQL Server Web and Windows Server 2016, and announced comprehensive .NET developer solutions, including a .NET client library for all GCP APIs through NuGet. We have lots more in store for the rest of 2017!

For more resources on Windows Server and Microsoft SQL Server on GCP, check out cloud.google.com/windows and cloud.google.com/sql-server. And for hands-on training on how to deploy and manage Windows and SQL Server workloads on GCP, come to the GCP NEXT ‘17 Windows Bootcamp. Finally, if you need help migrating your Windows workloads, don’t hesitate to contact us. We’re eager to hear your feedback!

SLOs, SLIs, SLAs, oh my – CRE life lessons


Last week on CRE life lessons, we discussed how to come up with a precise numerical target for system availability. We term this target the Service Level Objective (SLO) of our system. Any discussion we have in future about whether the system is running sufficiently reliably and what design or architectural changes we should make to it must be framed in terms of our system continuing to meet this SLO.

We also have a direct measurement of SLO conformance: the frequency of successful probes of our system. This is a Service Level Indicator (SLI). When we evaluate whether our system has been running within SLO for the past week, we look at the SLI to get the service availability percentage. If it goes below the specified SLO, we have a problem and may need to make the system more available in some way, such as running a second instance of the service in a different city and load balancing between the two.

Why have an SLO at all?

Suppose that we decide that running our aforementioned Shakespeare service against a formally defined SLO is too rigid for our tastes; we decide to throw the SLO out of the window and make the service “as available as is reasonable.” This makes things easier, no? You simply don’t mind if the system goes down for an hour now and then. Indeed, perhaps downtime is normal during a new release and the attending stop-and-restart.

Unfortunately for you, customers don’t know that. All they see is that Shakespeare searches that were previously succeeding have suddenly started to return errors. They raise a high-priority ticket with support, who confirms that they see the error rate and escalate to you. Your on-call engineer investigates, confirms this is a known issue, and responds to the customer with “this happens now and again, you don’t have to escalate.” Without an SLO, your team has no principled way of saying what level of downtime is acceptable; there's no way to measure whether or not this a significant issue with the service. and you cannot terminate the escalation early with “Shakespeare search service is currently operating within SLO.” As our colleague Perry Lorier likes to say, “if you have no SLOs, toil is your job.”

The SLO you run at becomes the SLO everyone expects


A common pattern is to start your system off at a low SLO, because that’s easy to meet: you don’t want to run a 24/7 rotation, your initial customers are OK with a few hours of downtime, so you target at least 99% availability  1.68 hours downtime per week. But in fact, your system is fairly resilient and for six months operates at 99.99% availability  down for only a few minutes per month.

But then one week, something breaks in your system and it’s down for a few hours. All hell breaks loose. Customers page your on-call complaining that your system has been returning 500s for hours. These pages go unnoticed, because on-call leaves their pagers on their desks overnight, per your SLO which only specifies support during office hours.

The problem is, customers have become accustomed to your service being always available. They’ve started to build it into their business systems on the assumption that it’s always available. When it’s been continually available for six months, and then goes down for a few hours, something is clearly seriously wrong. Your excessive availability has become a problem because now it’s the expectation. Thus the expression, “An SLO is a target from above and below”  don’t make your system very reliable if you don’t intend and commit to it to being that reliable.

Within Google, we implement periodic downtime in some services to prevent a service from being overly available. In the SRE Book, our colleague Marc Alvidrez tells a story about our internal lock system  Chubby. Then, there’s the set of test front-end servers for internal services to use in testing, allowing those services to be accessible externally. These front-end servers are convenient but are explicitly not intended for use by real services; they have a one business day support SLA, and so can be down for 48 hours before the support team is even obligated to think about fixing them. Over time, experimental services that used those front-ends started to become critical; when we finally had a few hours of downtime on the front-ends, it caused widespread consternation.

Now we run a quarterly planned-downtime exercise with these front-ends. The front-end owners send out a warning, then block all services on the front-ends except for a small whitelist. They keep this up for several hours, or until a major problem with the blockage appears; the blockage can be quickly reversed in that case. At the end of the exercise the front-end owners receive a list of services that use the front-ends inappropriately, and work with the service owners to move them to somewhere more suitable. This downtime exercise keeps the front-end availability suitably low, and detects inappropriate dependencies in time to get them fixed.

Your SLA is not your SLO


At Google, we distinguish between a Service-Level Agreement (SLA) and a Service-Level Objective (SLO). An SLA normally involves a promise to someone using your service that its availability should meet a certain level over a certain period, and if it fails to do so then some kind of penalty will be paid. This might be a partial refund of the service subscription fee paid by customers for that period, or additional subscription time added for free. The concept is that going out of SLA is going to hurt the service team, so they'll push hard to keep it within SLA.

Because of this, and because the principle availability shouldn’t be much better than the SLO, the SLA is normally a looser objective than the SLO. This might be expressed in availability numbers: for instance, an availability SLA of 99.9% over 1 month with an internal availability SLO of 99.95%. Alternatively the SLA might only specify a subset of the metrics comprising the SLO.

For example, with our Shakespeare search service, we might decide to provide it as an API to paying customers in which a customer pays us $10K per month for the right to send up to one million searches per day. Now that money is involved, we need to specify in the contract how available they can expect the service to be, and what happens if we breach that agreement. We might say that we'll provide the service at a minimum of 99% availability, following the definition of successful queries given previously. If the service drops below 99% availability in a month, then we'll refund $2K; if it drops below 80% then, we'll refund $5K.

If you have an SLA that's different from your SLO, as it almost always is, it’s important for your monitoring to measure SLA compliance explicitly. You want to be able to view your system’s availability over the SLA calendar period, and easily see if it appears to be in danger of going out of SLA. You'll also need a precise measurement of compliance, usually from logs analysis. Since we have an extra set of obligations (in the form of our SLA) to paying customers, we need to measure queries received from them separately from other queries (we might not mind dropping queries from non-paying users if we have to start load shedding, but we really care about any query from the paying customer that we fail to handle properly). That’s another benefit of establishing an SLA  it’s an unambiguous way to prioritize traffic.

When you define your SLA, you need to be extra-careful about which queries you count as legitimate. For example, suppose that you give each of three major customers (whose traffic dominates your service) a quota of one million queries per day. One of your customers releases a buggy version of their mobile client, and issues two million queries per day for two days before they revert the change. Over a 30-day period you’ve issued approximately 90 million good responses, and two million errors; that gives you a 97.8% success rate. You probably don’t want to give all your customers a refund as a result of this; two customers had all their queries succeed, and the customer for whom two million out of 32 million queries were rejected brought this upon themselves. So perhaps you should exclude all “out of quota” response codes from your SLA accounting.

On the other hand, suppose you accidentally push an empty quota specification file to your service before going home for the evening. All customers receive a default 1000 queries per day quota. Your three top customers get served constant “out of quota” errors for 12 hours until you notice the problem when you come into work in the morning, and revert the change. You’re now showing 1.5 million rejected queries out of 90 million for the month, a 98.3% success rate. This is all your fault: counting this as 100% success for 88.5M queries is missing the point and a moral failure for measuring the SLA.

Conclusion


SLIs, SLOs and SLAs aren’t just useful abstractions. Without them you cannot know if your system is reliable, available, or even useful. If they don’t tie explicitly back to your business objectives then you have no idea if the choices you make are helping or hurting your business. You also can’t make honest promises to your customers.

If you’re building a system from scratch, make sure that SLIs, SLOs and SLAs are part of your system requirements. If you already have a production system but don’t have them clearly defined then that’s your highest priority work.

To summarize:
  • If you want to have a reliable service, you must first define “reliability.” In most cases that actually translates to availability.
  • If you want to know how reliable your service is, you must be able to measure the rates of successful and unsuccessful queries; these will form the basis of your SLIs.
  • The more reliable the service, the more it costs to operate. Define the lowest level of reliability that you can get away with, and state that as your Service Level Objective (SLO).
  • Without an SLO, your team and your stakeholders cannot make principled judgements about whether your service needs to be made more reliable (increasing cost and slowing development) or less reliable (allowing greater velocity of development).
  • If you’re charging your customers money you'll probably need an SLA, and it should be a little bit looser than your SLO.

As an SRE (or DevOps professional), it's your responsibility to understand how your systems serve the business in meeting those objectives, and, as much as possible, control for risks that threaten the high-level objective. Any measure of system availability that ignores business objectives is worse than worthless because it obfuscates the actual availability, leading to all sorts of dangerous scenarios, false senses of security and failure.

For those of you who wrote us thoughtful comments and questions from our last article, we hope this post has been helpful. Keep the feedback coming!

N. B. Google Cloud Next '17 is fewer than seven weeks away. Register now to join Google Cloud SVP Diane Greene, Google CEO Sundar Pichai, and other luminaries for three days of keynotes, code labs, certification programs, and over 200 technical sessions. And for the first time ever, Next '17 will have a dedicated space for attendees to interact with Google experts in Site Reliability Engineering and Developer Operations.

Guest post: building IoT applications with MQTT and Google Cloud Pub/Sub


[Editor’s note: Today we hear from Agosto, a Google Cloud Premier Partner that has been building products and delivering services on Google Cloud Platform (GCP) since 2012, including Internet of Things applications. Read on to learn about Agosto’s work to build an MQTT service broker for Google Cloud Pub/Sub, and how you can incorporate it into your own IoT applications.]

One of our key practice areas is Internet of Things (IoT). Using the many components of GCP, we’ve helped customers rapidly move their ideas from product concept to launch.

Along the way, we evaluated several IoT platforms and repeatedly came to the conclusion that we’d be better off staying on the GCP stack than a single IoT platform with costly licensing hooks and closed-source practices. Our clients also like being able to build scalable, functional prototypes using pre-existing and standard reference architectures and tools.

One of the many challenges we faced along the way was picking an efficient transport for two-way messaging between “things” and GCP. After evaluating a number of emerging and mature protocols, we settled on Message Queuing Telemetry Transport (MQTT). The MQTT protocol has been around since the early 2000’s and is now an ISO Standard. Originated in 1999 by Andy Stanford-Clark and Arlen Nipper, it's lightweight, has solid documentation and has tens of thousands of production deployments. Furthermore, many existing pre-IoT or “Machine to Machine” projects already use MQTT as their transport from embedded device to the back-office. With MQTT, we’ve been able to increase velocity and reduce complexity for our IoT products and services.

MQTT is a great transport protocol, but it can be challenging to manage at scale, particularly when it comes to scaling message storage and delivery systems. As one of the earliest Google partners to develop a set of reusable tools, reference architectures and methods for accelerating IoT products to market, we’ve been impressed with Google Cloud Pub/Sub, a durable, low-latency and scalable service for handling many-to-many asynchronous messaging. But Cloud Pub/Sub uses HTTPS to transfer data. Over numerous small requests, all those HTTP headers add up to a lot of extra data  a no-go when you’re dealing with a constrained device that communicates over a mobile network, and where you pay for each byte in mobile data charges, battery usage  or both.

We needed to bridge the gap between IoT-connected devices and Cloud Pub/Sub, and began investigating ways to connect MQTT to Cloud Pub/Sub using and extending RabbitMQ.

After initial load tests showed this approach was viable, Google asked Agosto to develop an open-source, highly performant MQTT connection broker that integrates with Cloud Pub/Sub. With low network overhead (Agosto has seen up to 10x less compared to HTTPS in scenarios we've tested) and high throughput, MQTT is a natural fit for many scenarios.

The resulting message broker integrates messaging between connected devices using a MQTT client and Cloud Pub/Sub; RabbitMQ performs the protocol conversion for two-way messaging between the device and Cloud Pub/Sub. This means administrators of the RabbitMQ compute infrastructure don't have to concern themselves with managing the durability of the data, or scaling storage.

Our message broker can support both small and very large GCP projects. For example, with smaller projects and IoT prototypes, you can rapidly deploy a single node of Agosto’s MQTT to Pub/Sub Connection Broker supporting up to 120,000 messages per minute for as little as $25/month for the compute costs. Larger production deployments with load-balanced brokers can support millions of concurrent connections and much higher throughput.

Download the broker, follow the instructions and learn more about leveraging MQTT and GCP for your IoT project.
GitHub: https://github.com/Agosto/gcp-iot-adapter

And if you're looking for a more customized implementation of our MQTT to Pub/Sub Connection broker, visit our website to learn more about our offerings.

Expanding our IDE support with a new Eclipse plugin for App Engine


Eclipse is one of the most popular IDEs for Java developers. Today, we're launching the beta version of Cloud Tools for Eclipse, a plugin that extends Eclipse to Google Cloud Platform (GCP). Based on Google Cloud SDK, the initial feature set targets App Engine standard environment, including support for creating applications, running and debugging them inside the IDE with the Eclipse Web Tools Platform tooling and deploying them to production.

You may be wondering how this plugin relates to the Google Plugin for Eclipse, which was launched in 2009. The older plugin is focused on a broader set of technologies than just GCP. Moreover, support for the Eclipse Web Tools Platform and Maven is spotty at best. Moving forward, we'll invest in building more cloud-related tooling in Cloud Tools for Eclipse.

Cloud Tools for Eclipse is available for Eclipse 4.5 (Mars) and Eclipse 4.6 (Neon) and can be installed through the Eclipse Update Manager. The plugin source code is available on GitHub, and we welcome contributions and reports of issues from the community.

First, install the Cloud Tools for Eclipse plugin. To verify that the plugin has installed correctly, launch Eclipse and look at the bottom right hand side of the window -- you should see a Google “G” Icon. Click on this icon to login to your Google account.

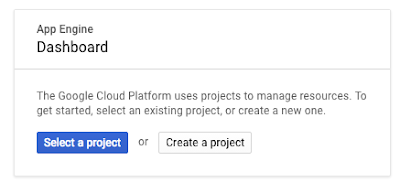
Now we'll demonstrate how to create and deploy a simple Maven-based "Hello World" App Engine standard environment application. First, create a new App Engine project from Cloud Console. (If this is your first time using GCP, we recommend signing up for our Free Trial first.) When you see this card, click Create a project:
You should then land on the following cards:
Every GCP project has a unique project ID. You’ll need this string later, so let’s grab that. On the left hand nav, click on Home and copy the project ID as shown below.

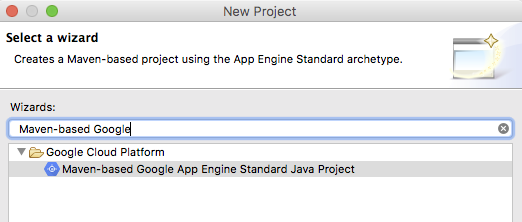
Now that you have an App Engine project, you're ready to deploy a simple Hello World application. Open Eclipse and click on File > New > Project and type “Maven-based Google” in the Wizards section, then select the following:
Fill in the Maven group ID and artifact ID and click Next:
In the next page, select the Hello World template and click Finish.
Now, right click on your project in the Project Explorer and select Run As > App Engine. You should now see your application running locally shortly on localhost. In the output terminal in Eclipse, the correct URL is hyperlinked.

Once you've finished running the application locally, you can deploy it to the cloud. Right-click on your application in the Eclipse Project Explorer and select Deploy to App Engine Standard. You'll see the following dialog if you're logging in for the first time. Click on the Account drop-down and proceed with the web browser UI to link the plugin for your GCP Account.
Once signed in, enter the Project ID of the application you created in Cloud Console and leave the rest as is. This is the ID you wrote down earlier.
Click Deploy to upload the finished project to App Engine. Status updates appear in the Eclipse console as files are uploaded. When the deployment finishes, the URL of the deployed application is shown in the Eclipse console. That’s it!

You can check the status of your application in the Cloud Console by heading to the App Engine tab and clicking on Instances to see the underlying infrastructure of your application.

We'll continue to add support for more GCP services to the plugin, so stay tuned for update notifications in the IDE. If you have specific feature requests, please submit them in the GitHub issue tracker.

To learn more about Java on GCP, visit the GCP Java developers portal, where you can find all the information you need to run your Java applications on GCP.

Happy Coding!

P.S. IntelliJ users, see here for the Cloud Tools for IntelliJ plugin.

Available . . . or not? That is the question – CRE life lessons


In our last installment of the CRE life lessons series, we discussed how to survive a "success disaster" with load-shedding techniques. We got a lot of great feedback from that post, including several questions about how to tie measurements to business objectives. So, in this post, we decided to go back to first principles, and investigate what “success” means in the first place, and how to know if your system is “succeeding” at all.

A prerequisite to success is availability. A system that's unavailable cannot perform its function and will fail by default. But what is "availability"? We must define our terms:

Availability defines whether a system is able to fulfill its intended function at a point in time. In addition to being used as a reporting tool, the historical availability measurement can also describe the probability that your system will perform as expected in the future. Sometimes availability is measured by using a count of requests rather than time directly. In either case, the structure of the formula is the same: successful units / total units. For example, you might measure uptime / (uptime + downtime), or successful requests / (successful requests + failed requests). Regardless of the particular unit used, the result is a percentage like 99.9% or 99.999%  sometimes referred to as “three nines” or “five nines.”

Achieving high availability is best approached by focusing on the unsuccessful component (e.g., downtime or failed requests). Taking a time-based availability metric as an example: given a fixed period of time (e.g., 30 days, 43200 minutes) and an availability target of 99.9% (three nines), simple arithmetic shows that the system must not be down for more than 43.2 minutes over the 30 days. This 43.2 minute figure provides a very concrete target to plan around, and is often referred to as the error budget. If you exceed 43.2 minutes of downtime over 30 days, you'll not meet your availability goal.

Two further concepts are often used to help understand and plan the error budget:

Mean Time Between Failures (MTBF): total uptime / # of failures. This is the average time between failures.

Mean Time to Repair (MTTR): total downtime / # of failures. This is the average time taken to recover from a failure.

These metrics can be computed historically (e.g., over the past 3 months, or year) and combined as (Total Period / MTBF) * MTTR to give an expected downtime value. Continuing with the above example, if the historical MTBF is calculated to be 10 days, and the historical MTTR is calculated to be 20 minutes, then you would expect to see 60 minutes of downtime ((30 days / 10 days) * 20 minutes)  clearly outside the 44-minute error budget for a three-nines availability target. To meet the target would require decreasing the MTBF (say to every 20 days) or decreasing the MTTR (say to 10 minutes), or a combination of both.

Keeping the concepts of error budget, MTBF and MTTR in mind when defining an availability target helps to provide justification for why the target is set where it is. Rather than simply describing the target as a fixed number of nines, it's possible to relate the numeric target to the user experience in terms of total allowable downtime, frequency and duration of failure.

Next, we'll look at how to ensure this focus on user experience is maintained when measuring availability.


Measuring availability


How do you know whether a system is available? Consider a fictitious "Shakespeare" service, which allows users to find mentions of a particular word or phrase in Shakespeare’s texts. This is a canonical example, used frequently within Google for training purposes, and mentioned throughout the SRE book.

Let's try working the scientific method to determine the availability of the hypothetical Shakespeare system.
  1. Question: how often is the system available?
  2. Observation: when you visit shakespeare.com, you normally get back the "200 OK" status code and an HTML blob. Very rarely, you see a 500 Internal Server error or a connection failure.
  3. Hypothesis: if "availability" is the percentage of requests per day that return 200 OK, the system will be 99.9% available.
  4. Measure: "tail" the response logs of the Shakespeare service’s web servers and dump them into a logs-processing system.
  5. Analyze: take a daily availability measurement as the percentage of 200 OK responses vs. the total number of requests.
  6. Interpret: After seven days, there’s a minimum of 99.7% availability on any given day.

Happily, you report these availability numbers to your boss (Dave), and go home. A job well done.

The next day Dave draws your attention to the support forum. Users are complaining that all their searches at shakespeare.com return no results. Dave asks why the availability dashboard shows 99.7% availability for the last day, when there clearly is a problem.

You check the logs and notice that the web server has received just 1000 requests in the last 24 hours, and they're all 200 OKs except for three 500s. Given that you expect at least 100 queries per second, that explains why users are complaining in the forums, although the dashboard looks fine.

You've made the classic mistake of basing your definition of availability on a measurement that does not match user-expectations or business objectives.


Redefining availability in terms of the user experience with black-box monitoring


After fixing the critical issue (a typo in a configuration file) that prevented the Shakespeare frontend service from reaching the backend, we take a step back to think about what it means for our system to be available.

If the "rate of 200 OK logs for shakespeare.com" is not an appropriate availability measurement, then how should we measure availability?

Dave wants to understand the availability as observed by users. When does the user feel that shakespeare.com is available? After some lively back-and-forth, we agree that the system is available when a user can visit shakespeare.com, enter a query and get a result for that query within five seconds, 100% of the time.

So you write a black-box "prober" (black-box, because it makes no assumptions about the implementation of the Shakespeare service, see the SRE Book, Chapter 6) to emulate a full range of clients devices (mobile, desktop). For each type of client, you visit shakespeare.com, enter the query "to be or not to be," and check that the result contains the expected link to Hamlet. You run the prober for a week, and finally recalculate the minimum daily availability measure: 80% of queries return Hamlet within five seconds, 18% of queries take longer, 1% timeout and another 1% return errors. A full 20% of queries fail our definition of availability!


Choosing an availability target according to business goals


After getting over his shock, Dave asks a simple question: “Why can't we have 100% returning within 5 seconds?”

You explain all the usual reasons why: power outages, fiber cuts, etc. After an hour or so, Dave is willing to admit that 100% query response in under five seconds is truly impossible.

Which leads, Dave to ask, “What availability can we have, then?”

You turn the question the question around on him: “What availability is required for us to meet our business goals?”

Dave's eyes light up. The business has set a revenue target of $25 million per year, and we make on average $0.01 per query result. At 100 queries per second * 3,1536,000 seconds per year * 80% success rate * $0.01 per query, we'll earn $25.23 million. In other words, even with a 20% failure rate, we'll still hit our revenue targets!

Still, a 20% failure rate is pretty ugly. Even if we think we'll meet our revenue targets, it's not a good user experience and we might have some attrition as a result. Should we fix it, and if so, what should our availability objective be?

Evaluating cost/benefit tradeoffs, opportunity costs


Suppose the rate of queries returning in greater than five seconds can be reduced to 0.5% if an engineer works on the problem for six months. How should we decide whether or not to do this?

We can start by estimating how much the 20% failure rate is going to cost us in missed revenue (accounting for users who give up on retrying) over the life of the product. We know roughly how much it will cost to fix the problem. Naively, we may decide that since the revenue lost due to the error rate exceeds the cost of fixing the issue, then we should fix it.

But this ignores a crucial factor… the opportunity cost of fixing the problem. What other things could an engineer have done with that time instead?

Hypothetically, there’s a new search algorithm that increases the relevance of Shakespeare search results, and putting it into production might drive a 20% increase in search traffic, even as availability remains constant. This increase in traffic could easily offset any lost revenue due to poor availability.

An oft-heard SRE saying is that you should “design a system to be as available as is required, but not much more.” At Google, when designing a system, we generally target a given availability figure (e.g., 99.9%), rather than particular MTBF or MTTR figures. Once we’ve achieved that availability metric, we optimize our operations for "fast fix," e.g., MTTR over MTBF, accepting that failure is inevitable, and that “spes consilium non est” (Hope is not a strategy). SREs are often able to mitigate the user visible impact of huge problems in minutes, allowing our engineering teams to achieve high development velocity, while simultaneously earning Google a reputation for great availability.

Ultimately, the tradeoff made between availability and development velocity belong to the business. Precisely defining the availability in product terms allows us to have a principled discussion and to make choices we can be proud of.

N.B. Google Cloud Next '17 is fewer than seven weeks away. Register now to join Google Cloud SVP Diane Greene, Google CEO Sundar Pichai and other luminaries for three days of keynotes, code labs, certification programs and over 200 technical sessions. And for the first time ever, Next '17 will have a dedicated space for attendees to interact with Google experts in Site Reliability Engineering and Developer Operations.