Category Archives: Google Cloud Platform Blog

Product updates, customer stories, and tips and tricks on Google Cloud Platform

Use labels to gain visibility into GCP resource usage and spending


We’re pleased to announce that labels, a new grouping mechanism for your cloud resources, is now widely available in GCP. With labels, you can group related resources together by adding metadata to your resources in the form of key-value pairs. This feature helps enterprises better organize resources, and gain visibility into resource usage and spending.
At Descartes Labs, we process petabytes of satellite imagery on a daily basis that we store in GCP. We use labels to tag our Google Cloud Storage buckets by functional business area so that we have better visibility into how resource usage looks across departments. We also use labels with Google Compute Engine to identify the processing pipelines across different areas of our environment so that we have an accurate view of how resource costs map to our business. We can easily track any cost changes by exporting resource billing details to Big Query and using Data Studio Dashboards.  
Tim Kelton, Co-Founder and Cloud Architect, Descartes Labs


Labels provide a convenient way for developers and administrators to organize resources at scale


By adding labels such as costcenter=c23543, service=playlist, and environment=test to your VMs or GCS buckets it’s easy to understand, for example, where your resources are deployed, for what purpose and which cost center they should be charged to.

The screenshot below shows how you can associate labels with Compute Engine instances through the UI.
Labels can be used to associate your GCP resources with your cost center of choice.

You can also, for example, further subdivide the playlist service into the systems that represent the web front-end and a different set of resources that represent a storage system (e.g., a Cassandra cluster). By assigning the labels component=frontend to all the web front-end resources, and component=storage to the Cassandra cluster, you can search and filter to find just the VMs that make up the front-end, as shown in the screenshot below.
Use labels to search and filter on specific GCP resources.

Using labels to understand costs


When you enable the export of billing data to BigQuery, labels are exported to BigQuery with all corresponding GCP resources and their usage. This makes it easier for CIOs and managers to answer questions such as:

  • What does the shopping cart service in my application cost to run?
  • How much do I spend on developer test machines?

You can use BigQuery in combination with labels such as costcenter=c23543, service=playlist, and environment=test on your VMs or GCS buckets, to understand exactly what all test systems resources cost versus production resources, or how much the playlist service costs.
Here, Billing export to BigQuery has been enabled. "Labels-demo-prj" is the source of your resource usage and "labels_demo_bqexport" is the destination dataset where usage data is stored.
Once you export your usage and labels to BigQuery, finding out how much your “playlist” service costs becomes very easy, as shown in the example below.
Here, you can see Google Compute Engine usage and its associated cost in BigQuery.
Labels are a powerful tool to track your GCP usage and resources at scale, and with the granularity you need. You can find a list of all GCP services that support labels today on the documentation page. Stay tuned as we announce more features for labels.

Extracting value from your logs with Stackdriver logs-based metrics


Most developers know that logs are important for debugging purposes but struggle in extracting value from the massive volume of logs generated across their system. This is where the right tools to extract insights from logs can really make a difference. Stackdriver Logging’s improved analytics tools became available in beta earlier this year and are now generally available, and being used by our customers.

Logs-based metrics are the cornerstone of Stackdriver Logging’s analytics platform and allow you to identify trends and extract numeric values out of the logs. Here are a few examples of how we’ve seen customers use logs-based metrics.

Filter on labels 

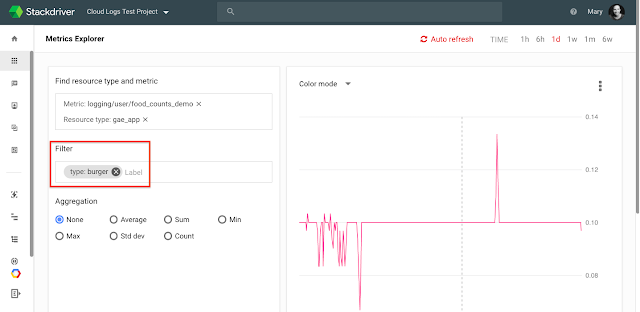
As a simple example, we have a sample App Engine restaurant application that includes a parameter that includes food ordered in the URL. We want to be able to count the number of each menu item ordered. Logs-based metric labels allow you to use a regular expression to extract the desired field.
You can then view the logs-based metric, filter on the labels or create alerts in Stackdriver Monitoring. In the example below, we use Metric Explorer to filter down to just “burgers” and can see the rate of orders placed over the last day.
Google Cloud Apigee needed to take their terabytes of rich log data and understand errors and latency for each service they run across each region. They used logs based metric labels to extract the service and region directly from the log entry. As Madhurranjan Mohaan, software engineer at Apigee explains, “Parameterizing log searches based on labels have really helped us visualize errors and latency across multiple charts. It’s great because it’s parameterized across all regions.”

Extract values from log entries with distribution metrics


Waze uses distribution metrics to extract fields such as latency from their log entries. They can then view the distributions coming from logs as a heat map in Stackdriver Monitoring.

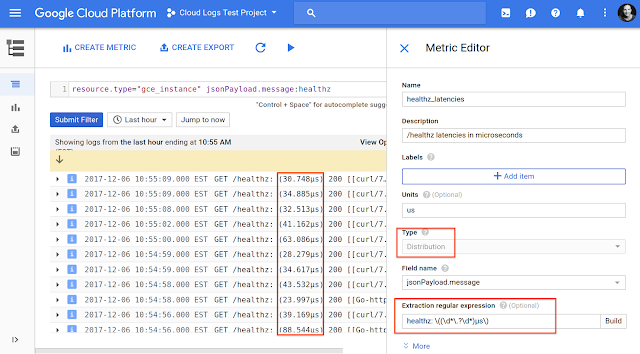
As a simple example, we have an application running on Compute Engine VMs, emitting logs with a latency value in the payload. We first filter down to the relevant log entries that include the “healthz” text in the payload and then use a regular expression to extract the value for the distribution logs-based metric.
In Stackdriver Monitoring, we can visualize the data. In the example below, we add the chart as a heatmap to a custom dashboard. We could also instead choose to visualize it as a line chart of the 99th percentile, for example, by changing the aggregation and visualization.

Alert on matching log entries


Another common use case is to get notified whenever a matching log entry occurs. For example, to get an email whenever a new VM is created in your system, you can create a logs-based metric on log entries for new VMs and then create a metric threshold based alerting policy. To see how to do this, watch this short video.

You can also use logs-based metrics to gain insight into the performance of Google Cloud Platform (GCP) services. For example, recently, our BigQuery team did an analysis of easily fixed errors that BigQuery users commonly encounter. We discovered that many users received rateLimitExceeded and quotaExceeded. We found that using logs-based metrics can improve the user experience by adding visibility to BigQuery administrators. You can read more about this analysis here.

We hope these examples help you to leverage the power of Stackdriver Logging analytics. If you have questions, feedback or want to share how you’ve made logs based metrics work for you, we’d love to hear from you.

Expanding our partner ecosystem with managed services providers


When it comes to managing IT for your business, you can never have too much help. That’s why earlier this year we announced that Rackspace was our first managed services provider (MSP) partner for Google Cloud Platform (GCP), and brought its “fanatical support” to customers building on, and migrating to, GCP. Today, the ecosystem of Google Cloud MSPs has continued to expand to a dozen partners globally — and they’re eager to support customers on their journey to the cloud.

For many Google Cloud customers, a qualified MSP makes all the difference. From hands-on support to the ongoing operation of customer workloads, these partners offer proactive services to both large and small cloud adopters. With their staff of dedicated technical experts, MSPs can tackle high-touch projects, covering engagement to migration and execution, to post-planning and ongoing optimization.

Specifically, Google Cloud MSPs offer at minimum:

  • Consulting, assessment, implementation, monitoring and optimization services 
  • 24x7x365 support with enterprise-grade SLAs 
  • L1, L2, L3 tiered support models 
  • Certified support engineers

Our MSP partners can help enterprises on their journey to the cloud — and our MSP partners can help. All are highly knowledgeable about Google Cloud technologies and processes, are investing dedicated engineering resources to support GCP customers and participate in immersive Google training that includes role and team shadowing.

Meet the Google Cloud MSPs


Here are the partners that now make up our MSP ecosystem:

  • Accenture - Accenture is a global leader in helping organizations move to cloud. Their managed service capability is multi-mode and multi-cloud, and they work with GCP to help customers with security, data, application, infrastructure or business process operations.
  • Cascadeo - As a long-time Google partner, Cascadeo specializes in managed services, cloud operations and automation. Their services are designed to allow customers to bring their own tooling, monitoring systems, and accounts — while leveraging best in breed services and engineers.
  • Claranet - With more than 1,800 employees and 24 offices across Europe and Brazil, Claranet specializes in helping customers migrate non-'cloud native' workloads into GCP, and then iteratively improve the infrastructure to take advantage of all of GCP’s tools and services.
  • Cloudreach -  Cloudreach has transitioned some of the largest enterprises from traditional IT to the power of GCP. They've been named a Gartner Magic Quadrant Leader for Hyperscale Cloud Managed Services and offer software enabled services including migration, app modernization, financial, security and governance management.
  • DoiT International - DoIT’s team of GCP experts provides state-of-the-art managed services for startups. They focus on helping some of the most innovative startups in the world design best in class architecture, cloud operations, security protection and advanced big data analytics.
  • Go Reply - Go Reply, the Reply group company specialized on Google Cloud technology, offers design and implementation on GCP. They help enterprises build and optimize their cloud strategy, migration, infrastructure hosting, big data, machine learning, PCI/ISO compliance and security management.
  • Pythian - For over 20 years, Pythian has been delivering managed services. They feature flexible subscription packages, with mix and match services, that help control costs while maximizing performance, availability, efficiency and security — ensuring customers get the most from their GCP environments.
  • Rackspace - Rackspace helps customers of all sizes plan, architect and operate projects at scale leveraging its 150+ GCP-certified experts. Rackspace recently acquired Datapipe, a next-gen cloud MSP, and both were named as leaders in the 2017 Gartner Magic Quadrant for Public Cloud Infrastructure Managed Service Providers, Worldwide.
  • RightScale - RightScale provides managed services to help organizations successfully and cost-effectively deploy and manage applications. Through the RightScale Cloud Management Platform and RightScale Optima for cost management, they enable enterprises, other MSPs, and system integrators to grow their cloud business on GCP.
  • SADA Systems - SADA Systems works with GCP customers at various stages of their cloud adoption strategy. They assist with deploying new cloud-native applications, augmenting existing applications to run more efficiently in the cloud or the hybrid cloud — and offer security services, billing management and automation via Orbitera.
  • Sutherland - As a unique Support Partner for Google Cloud, Sutherland brings domain expertise, process transformation, design knowledge and combined machine learning and artificial intelligence application management to GCP customers.
  • Taos - Taos delivers a robust portfolio of cloud, on-premise and hybrid managed services, assessments and migrations — plus end-to-end customer support for the full GCP journey. They leverage GCP to create future-proof infrastructure, data and analytics to mitigate concerns about reliability, capacity or performance.

We’ll be announcing new MSP partners in the coming months, so keep an eye on our partner page. You can also learn more about our partner program, find a partner or read some of the cool customer stories that our partners have made possible. We’re excited to see what you’ll build together!

Getting the most out of shared postmortems — CRE life lessons


In our previous post we discussed the benefits of sharing internal postmortems outside your company. You may adopt a one:many approach with an incident summary that tells all your customers what happened and how you'll prevent it from happening again. Or, if the incident impacted a major customer, you may share something close to your original postmortem with them.

In this post, we consider how to review a postmortem with your affected customer(s) for better actionable data and also to help customers improve their systems and practices. We also present a worked example of a shared postmortem based on the SRE Book postmortem template.


Postmortems should fix your customer too

How to get outages to benefit everyone

Even if the fault was 100% on you, the platform side, an external postmortem can still help customers improve their reliability. Now that we know what happens when a particular failure occurs, how can we generalize this to help the customer mitigate the impact, and reduce MTTD and MTTR for a similar incident in the future?

One of the best sources of data for any postmortem is your customers’ SLOs, with their ability to measure the impact of a platform outage. Our CRE team talks about SLOs quite a lot in the CRE Life Lessons series, and there’s a reason why: SLOs and error budgets inform more than just whether to release features in your software.

For customers with defined SLOs who suffered a significant error budget impact, we recommend conducting a postmortem review with them. The review is partly to ensure that the customer’s concerns were addressed, but also to identify “what went wrong,” “where we got lucky” and how to identify actions which would address these for the customer.

For example, the platform’s storage service suffered increased latency for a certain class of objects in a region. This is not the customer’s fault, but they may still be able to do something about it.

The internal postmortem might read something like:

What went well

  • The shared monitoring implemented with CustomerName showed a clear single-region latency hit which resulted in a quick escalation to storage oncall. 
What went wrong 

  • A new release of the storage frontend suffered from a performance regression for uncached reads that was not detected during testing or rollout. 
Where we got lucky 

  • Only reads of objects between 4KB and 32KB in size were materially affected. 
Action items

  • Add explicit read/write latency testing in testing for both cached and uncached objects in buckets of 1KB, 4KB, 32KB, … 
  • Have paging alerts for latency over SLO limits, aggregated by Cloud region, for both cached and uncached objects, in buckets of 1KB, 4KB, 32KB, ... 
When a customer writes their own postmortem about this incident, using the shared postmortem to understand better what broke in the platform and when, that postmortem might look like:

What went well

  • We had anticipated a generic single-region platform failure and had the capability to fail over out of an affected region. 
What went wrong 

  • Although the latency increase was detected quickly, we didn’t have accessible thru-stack monitoring that could show us that it was coming from platform storage-service rather than our own backends. 
  • Our decision to fail out of the affected region took nearly 30 minutes to complete because we had not practiced it for one year and our playbook instructions were out of date. 
Where we got lucky 

  • This happened during business hours so our development team was on hand to help diagnose the cause. 
Action items 

  • Add explicit dashboard monitoring for aggregate read and write latency to and from platform storage-service. 
  • Run periodic (at least once per quarter) test failovers out of a region to validate that the failover instructions still work and increase ops team confidence with the process. 

Prioritize and track your action items 


A postmortem isn’t complete until the root causes have been fixed 

Sharing the current status of your postmortem action items is tricky. It's unlikely that the customer will be using the same issue tracking system as you are, so neither side will have a “live” view of which action items from a postmortem have been resolved, and which are still open. Within Google we have automation which tracks this and “reminds” us of unclosed critical actions from postmortems, but customers can’t see those unless we surface them in the externally-visible part of our issue tracking system, which is not our normal practice.

Currently, we hold a monthly SLO review with each customer, where we list the major incidents and postmortem/incident report for each incident; we use that occasion to report on open critical bug statuses from previous months’ incidents, and check to see how the customer is doing on their actions.

Other benefits 

Opening up is an opportunity 

There are practical reliability benefits of sharing postmortems, but there are other benefits too. Customers who are evolving towards an SRE culture and adopting blameless postmortems can use the external postmortem as a model for their own internal write-ups. We’re the first to admit that it’s really hard to write your own first postmortem from scratch—having a collection of “known-good” postmortems as a reference can be very helpful.

At a higher level, shared postmortems give your customer a “glimpse behind the curtain.” When a customer moves from on-premises hardware to the cloud, it can be frightening; they're giving up a lot of control of and visibility into the platform on which their service runs. The cloud is expected to encapsulate the operational details of the services it offers, but unfortunately it can be guilty of hiding information that the customer really wants to see. A detailed external postmortem makes that information visible, giving the customer a timeline and deeper detail, which hopefully they can relate to.

Joint postmortems

If you want joint operations, you need joint postmortems 

The final step in the path to shared postmortems is creating a joint postmortem. Until this point, we’ve discussed how to externalize an existing document, where the action items, for example, are written by you and assigned to you. With some customers, however, it makes sense to do a joint postmortem where you both contribute to all sections of the document. It will not only reflect your thoughts from the event, but it will also capture the customer’s thoughts and reactions, too. It will even include action items that you assign to your customer, and vice-versa!

Of course, you can’t do joint postmortems with large numbers of your customers, but doing so with at least a few of them helps you (a) build shared SRE culture, and (b) keep the customer perspective in your debugging, design and planning work.

Joint postmortems are also one of the most effective tools you have to persuade your product teams to re-prioritize items on their roadmap, because they present a clear end-user story of how those items can prevent or mitigate future outages.


Summary 


Sharing your postmortems with your customers is not an easy thing to do; however, we have found that it helps:

  • Gain a better understanding of the impact and consequences of your outages
  • Increase the reliability of your customers’ service
  • Give customers confidence in continuing to run on your platform even after an outage.

To get you started, here's an example of an external postmortem for the aforementioned storage frontend outage, using the SRE Book postmortem template. (Note: Text relating to the customer (“JaneCorp”) is marked in purple for clarity.) We hope it sets you on the path to learning and growing from your outages. Happy shared postmortem writing!

How to get real-time, actionable insights from your Fastly logs with Looker and BigQuery


Editor’s note: Fastly, whose edge cloud platform offers content delivery, streaming, security and load-balancing, recently integrated its platform with Looker, a business intelligence tool. Using Google BigQuery as its analytics engine, you can use Fastly plus Looker to do things like improve your operations, analyze the effectiveness of marketing programs — even identify attack trends.

This past August we announced a deeper integration between Google Cloud Platform (GCP) and Fastly’s edge cloud. In addition to using Fastly to improve response times for applications built on GCP, Fastly customers can stream Fastly logs in real-time from the edge to a number of third parties for deeper analysis, including Google Cloud Storage and BigQuery. We're now expanding upon this partnership by integrating Looker, a powerful business intelligence tool, into our offering.

Looker can analyze Fastly log data on its own or combine it with other data sources in BigQuery such as Google Analytics, Google Ads data or security and firewall logs, allowing customers to run queries against these data sets and present findings in dashboards to facilitate better business decisions.

As part of this collaboration, we created a “Looker Block” for Fastly Log Analytics in BigQuery, to help you get up and running quickly with key visualizations and metrics. Think of Looker Blocks as analytical patterns that can be used as a starting point for modeling a data source. They include dashboards and key metrics that can be explored ad-hoc to build new customized reports. The Fastly Looker Block can be extended to account for specific Fastly logging use cases while also connecting to other data sources in BigQuery for more comprehensive analysis.

Looker runs all analytics in BigQuery — data is never moved from the source — leveraging BigQuery’s performance and features directly. This functionality is made possible via Looker’s modeling layer, LookML, which serves as an abstraction of SQL.

Here are some common use cases for GCP customers who wish to take advantage of both Fastly and Looker:

DevOps - Fastly streams 100% of logs from the edge to BigQuery in real time, providing insights into web and app usage. Using Looker dashboards, you can correlate the most popular URLs, website and app activity by country, and activity by client device. You can then use this information to see which content is gaining the most traction where, and what devices it’s being consumed on.

Leveraging BigQuery analytics, Looker can also analyze Fastly log data and create dashboards to use for troubleshooting. Here, Looker can illustrate failed requests by geo / datacenter, and country, or the slowest URLs. You can also use these dashboards to troubleshoot connectivity issues, pinpoint configuration areas that need tuning, and identify the cause of service disruptions.

Looker dashboard, troubleshooting using Fastly log data
Marketing/Digital Advertising - Looker can cross-reference Fastly log data with other data sources for broader insights. For example, by combining Fastly app activity by country with Google Ad data, marketers can discover where engagement is higher and which users are more likely to consume their ads.

Looker dashboard, analysis of user engagement with Google Ad data
Security - You can also use Looker to help visualize Fastly’s real-time logs for insights into live attack trends. Fastly’s Web Application Firewall (WAF) logs can be fed into Google BigQuery. Looker then pulls that data to create dashboards illustrating trends in attacks, breakdown of attacks over time, spikes in attacks from a given attacker, and more.

Looker dashboard, Fastly's WAF top offenders

Getting started with Fastly and Looker on GCP


If you haven’t yet signed up for Fastly, setting up a trial account is quick and easy. Once your applications are up and running, you can set up Google Cloud Storage for your Fastly streaming logs and establish BigQuery as a logging endpoint.

If you need to get started with Looker, you can request a demo. Once you’re using Looker, follow the documentation to connect BigQuery to your Looker instance. Make sure Looker has access to your Fastly data and any other data sources you’d like to explore (e.g., Google Analytics, Google Ads data, security or firewall log data).

Another way to get started with Looker and Fastly is to use the Log Analytics by Fastly Block. You can either download the entire block into Looker by following the directions, or selectively migrate pieces of the block by simply copying and pasting the block LookML into your Looker instance. Then customize your LookML model to account for any custom metrics relevant to your business within the Fastly logs data (or any other data you’ve made available to Looker in BigQuery).

Now that you are set up with Fastly, BigQuery and Looker you’re ready to get real-time insights into how your web and mobile traffic is performing and better understand users interactions with your applications. Have questions? Please contact us.

OAuth whitelisting can now control access to GCP services and data


As a Google Cloud Platform (GCP) customer, having control over who can access your resources is incredibly important. Last summer, we introduced OAuth apps whitelisting, giving you visibility and control into how third-party applications access your users’ G Suite data. And today, we’ve expanded our OAuth API access controls to let you control access to GCP resources as well.

OAuth apps whitelisting helps keep your data safe by letting admins specifically select which third-party apps are allowed to access users’ GCP data and resources. Once an app is part of a whitelist, users can choose to grant authorized access to their GCP apps and data. This prevents malicious apps from tricking users into accidentally granting access to corporate resources.

As a GCP administrator, you can whitelist applications via the Google Admin console (also known as the G Suite Admin console). With OAuth API access controls you have three GCP whitelisting options:
  1. Cloud Platform - a whitelist that covers GCP services like Google Cloud Storage and BigQuery, but excludes Cloud Machine Learning and Cloud Billing
  2. Machine Learning - a dedicated whitelist for machine learning services that includes Cloud Video Intelligence, Cloud Speech API, Cloud Natural Language API, Cloud Translation API, and Cloud Vision API 
  3. Cloud Billing - a dedicated whitelist for the Cloud Billing API 

OAuth API access controls

When you disable API access to any of these categories, you disallow third-party apps from accessing data or services in that category. Third-party applications that you have specifically vetted and deem trustworthy can be whitelisted, and users can choose to grant them authorized access to their GCP and G Suite apps. This helps prevent malicious apps from tricking users into accidentally granting access to their corporate data.
Whitelisting trusted applications (click to enlarge)
Disabling or whitelisting third-party access to GCP resources is easy. Click here for more info on how to get started.

With Google Kubernetes Engine regional clusters, master nodes are now highly available


We introduced highly available masters for Google Kubernetes Engine earlier this fall with our alpha launch of regional clusters. Today, regional clusters are in beta and ready to use at scale in Kubernetes Engine.

Regional clusters allow you to create a Kubernetes Engine cluster with a multi-master, highly available control plane that helps ensure higher cluster uptime. With regional clusters in Kubernetes Engine, you gain:
  • Resilience from single zone failure - Because your masters and nodes are available across a region rather than a single zone, your Kubernetes cluster is still fully functional if a zone goes down.
  • No downtime during master upgrades - Kubernetes Engine minimizes downtime during all Kubernetes master upgrades, but with a single master, some downtime is inevitable. By using regional clusters, the control plane remains online and available, even during upgrades.

How regional clusters work


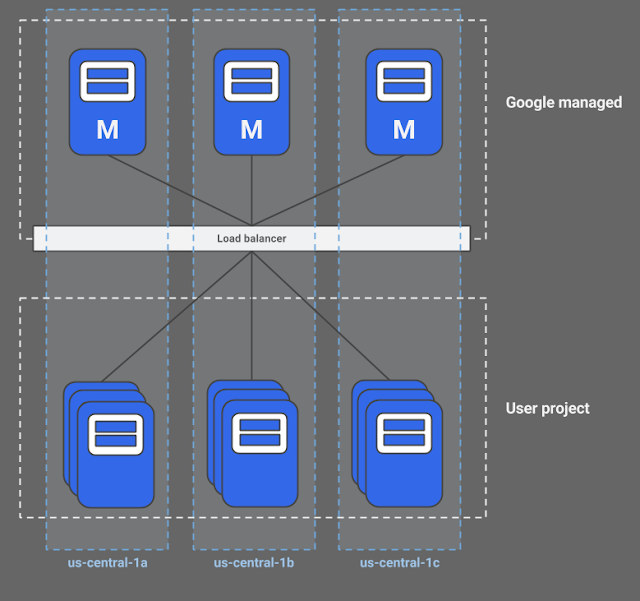
When you create a regional cluster, Kubernetes Engine spreads your masters and nodes across three zones in a region, ensuring that you can experience a zonal failure and still remain online.

By default, Kubernetes Engine creates three nodes in each zone (giving you nine total nodes), but you can change the number of nodes in your cluster with the --num-nodes flag.
Creating a Kubernetes Engine regional cluster is simple. Let’s create a regional cluster with two nodes in each zone.

$ gcloud beta container clusters create my-regional-cluster --region=us-central1 --num-nodes=2

Or you can use the Cloud Console to create a regional cluster:
For a more detailed explanation of the regional clusters feature along with additional flags you can use, check out the documentation.

Kubernetes Engine regional clusters are offered at no additional charge during the beta period. We will announce pricing as part of general availability. Until then, please send any feedback to [email protected].


Meet the Kubernetes Engine team at #KubeCon


This week the Kubernetes community gathers in Austin for the annual #KubeCon conference. The Google Cloud team will host various activities throughout the week. Join us for parties, workshops, and more than a dozen talks by experts. More info and ways to RSVP at g.co/kubecon.

Manage Google Kubernetes Engine from Cloud Console dashboard, now generally available


There are two main ways to manage Google Kubernetes Engine: the kubectl command line interface and Cloud Console, a web-based dashboard. Cloud Console for Kubernetes Engine is now generally available, and includes several new and exciting features to help you understand the state of your app, troubleshoot it and perform fixes.

Troubleshoot your app


To walk you through these new features, we’d like to introduce you to Alice, a DevOps admin running her environment on Kubernetes Engine. Alice logs into Cloud Console to see the status of her apps. She starts by looking at the unified Workloads view where she can inspect all her apps, no matter which cluster they run on. This is especially handy for Alice, as her team has different clusters for different environments. In this example she spots an issue with one of the frontends – its status is showing up red.
(click to enlarge)

By clicking on the name of the workload, Alice sees a detailed view where she can start debugging. Here she sees graphs for CPU, memory and disk utilization and spots a sudden spike in the resource usage.
(click to enlarge)

Before she starts to investigate the root cause, Alice decides to turn on Horizontal Pod Autoscaling to mitigate the application outage. The autoscale action is available from the menu at the top of the Cloud Console page. She increases the number of maximum replicas to 15 and enables autoscaling.
(click to enlarge)

Now that the service is scaling up and and can handle user traffic again, Alice decides to investigate the root cause of the increased CPU usage. She starts by investigating one of the pods and sees that it has high CPU usage. To look into this further she opens the Logs tab to browse the recent logs for the offending pod.
(click to enlarge)
The logs indicate that the problem is with the frontend’s http server. With this insight, Alice decides to connect to the running pod to debug it further. She opens Cloud Shell directly from Cloud Console and attaches to the selected pod. Alice does not need to worry about remembering the exact commands, finding the right credentials and setting kubectl context—the correct command is fully populated when Cloud Shell loads.

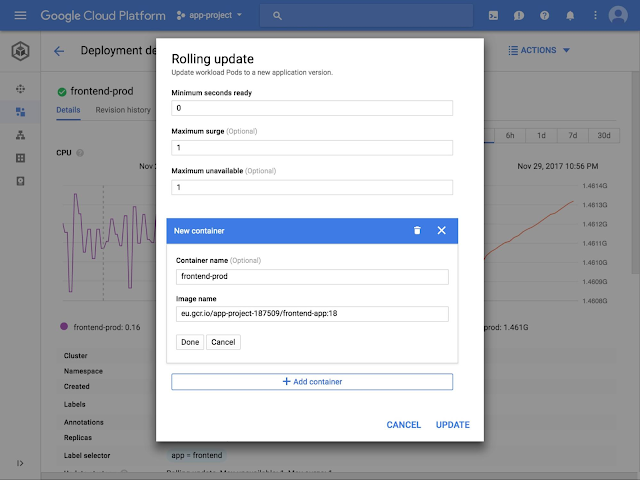
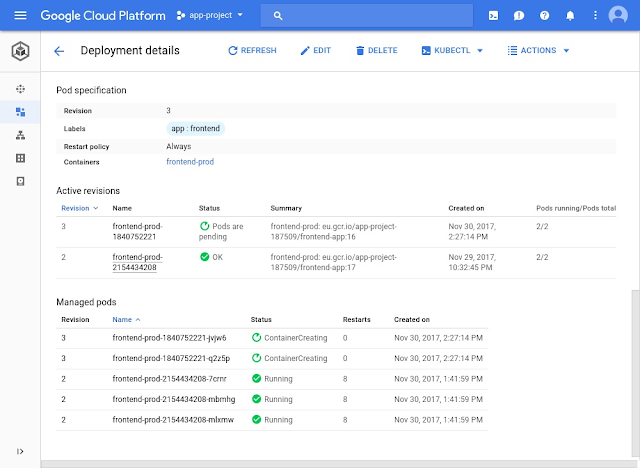
By running the linux "top" command, Alice can see that the http server process is the culprit behind the spiking CPU. She can now investigate the code, find the bug and fix it using her favorite tools. Once the new code is ready, Alice comes back to the UI to perform a rolling update. Again, she finds the rolling update action in the top of the UI, and updates the image version. Cloud Console then performs the rolling update, displays its progress and highlights any problems that might have occurred during the update.
(click to enlarge)
(click to enlarge)
Alice now inspects resource usage charts, status and logs for the frontend deployment to verify that it is working correctly. She can also perform the same rolling update action on a similar frontend deployment on a different cluster, without having to context-switch and provide new credentials.

Kubernetes Engine Cloud Console comes with other features to assist Kubernetes administrators with their daily routines. For example, it includes a YAML editor to modify Kubernetes objects, or service visualizations that aggregate its related resources like pods or load balancers. You can learn more about those features through the Kubernetes Engine dashboards documentation.

Manage Kubernetes Engine clusters


Kubernetes Engine’s new Cloud Console experience also offers improvements for cluster administrators. Bob works in the same company as Alice and is responsible for administering the cluster where the frontend app lives.

While investigating the the list of nodes in the cluster Bob notices that all the nodes are running close to full utilization and that there's not enough capacity left in the cluster to schedule other workloads. He clicks on one of the nodes to investigate what’s happening with the pods scheduled there. He quickly realizes that due to Alice turning on the Horizontal Pod Autoscaler there are now multiple replicas of the frontend pods that take up all the space in the cluster.

Bob decides to edit the the cluster right from Cloud Console and turn on cluster autoscaling. After a couple of minutes to scale up the cluster, everything starts to work again.

These are just some of the things that you can do from the Kubernetes Engine Cloud Console dashboard. To get started, simply login to Cloud Console and click on the Kubernetes Engine tab. Let us know how you like it by clicking on the feedback button in the upper righthand corner of the UI.

Meet the Kubernetes Engine team at #KubeCon


This week the Kubernetes community gathers in Austin for the annual #KubeCon conference. The Google Cloud team will host various activities throughout the week. Join us for parties, workshops, and more than a dozen talks by experts. More info and ways to RSVP at g.co/kubecon.

Precious cargo: Securing containers with Kubernetes Engine 1.8


With every new release of Kubernetes and Google Kubernetes Engine, we add new security features, strengthen existing security controls and move to stronger default configurations. We strive to improve Kubernetes security in general, and to make Kubernetes Engine more secure by default so that you don’t have to apply these configurations yourself.

With the speed of development in Kubernetes, there are often new features and security configurations for you to know about. This post will guide you through implementing our current guidance for hardening your Kubernetes Engine cluster. If you’re feeling adventurous, we’ll also discuss new security features that you can test on alpha clusters (which are not recommended for production use).

Security best practices for your Kubernetes cluster

When running a Kubernetes cluster, there are several best practices we recommend you follow:
  •  Use least privilege service accounts on your nodes
  •  Disable the Kubernetes web UI 
  •  Disable legacy authorization (now disabled by default for new clusters in Kubernetes 1.8) But before you can do that, you’ll need to set a few environment variables first:
#Your project ID
PROJECT_ID=
#Your Zone. E.g. us-west1-c
ZONE=
#New service account we will create. Can be any string that isn't an existing service account. E.g. min-priv-sa
SA_NAME=
#Name for your cluster we will create or modify. E.g. example-secure-cluster
CLUSTER_NAME=
#Name for a node-pool we will create. Can be any string that isn't an existing node-pool. E.g. example-node-pool
NODE_POOL=

Use least privilege service accounts on your nodes


The principle of least privilege helps to reduce the "blast radius" of a potential compromise, by granting each component only the minimum permissions required to perform its function. Should one component become compromised, least privilege makes it much more difficult to chain attacks together and escalate permissions.

Each Kubernetes Engine node has a Service Account associated with it. You’ll see the Service Account user listed in the IAM section of the Cloud Console as “Compute Engine default service account.” This account has broad access by default, making it useful to wide variety of applications, but has more permissions than you need to run your Kubernetes Engine cluster.

We recommend you create and use a minimally privileged service account to run your Kubernetes Engine Cluster instead of the Compute Engine default service account.

Kubernetes Engine requires, at a minimum, the service account to have the monitoring.viewer, monitoring.metricWriter, and logging.logWriter roles.

The following commands will create a GCP service account for you with the minimum permissions required to operate Kubernetes Engine:

gcloud iam service-accounts create "${SA_NAME}" \
  --display-name="${SA_NAME}"

gcloud projects add-iam-policy-binding "${PROJECT_ID}" \
  --member "serviceAccount:${SA_NAME}@${PROJECT_ID}.iam.gserviceaccount.com" \
  --role roles/logging.logWriter

gcloud projects add-iam-policy-binding "${PROJECT_ID}" \
  --member "serviceAccount:${SA_NAME}@${PROJECT_ID}.iam.gserviceaccount.com" \
  --role roles/monitoring.metricWriter

gcloud projects add-iam-policy-binding "${PROJECT_ID}" \
  --member "serviceAccount:${SA_NAME}@${PROJECT_ID}.iam.gserviceaccount.com" \
  --role roles/monitoring.viewer

#if your cluster already exists, you can now create a new node pool with this new service account.
gcloud container node-pools create "${NODE_POOL}" \
  --service-account="${SA_NAME}@${PROJECT_ID}.iam.gserviceaccount.com" \
  --cluster="${CLUSTER_NAME}"

If you need your Kubernetes Engine cluster to have access to other Google Cloud services, we recommend that you create an additional role and provision it to workloads via Kubernetes secrets, rather than re-use this one.

Note: We’re currently designing a system to make obtaining GCP credentials in your Kubernetes cluster much easier and will completely replace this workflow. Join the Kubernetes Container Identity Working Group to participate.

Disable the Kubernetes Web UI

We recommend you disable the Kubernetes Web UI when running on Kubernetes Engine. The Kubernetes Web UI (aka KubernetesDashboard) is backed by a highly privileged Kubernetes Service Account. The Cloud Console provides much of the same functionality, so you don't need these permissions if you're running on Kubernetes Engine.

The following command disables the Kubernetes Web UI:
gcloud container clusters update "${CLUSTER_NAME}" \
    --update-addons=KubernetesDashboard=DISABLED

Disable legacy authorization

Starting with Kubernetes 1.8, Attribute-Based Access Control (ABAC) is disabled by default in Kubernetes Engine. Role-Based Access Control (RBAC) was released as beta in Kubernetes 1.6, and ABAC was kept enabled until 1.8 to give users time to migrate. RBAC has significant security advantages and is now stable, so it’s time to disable ABAC. If you're still relying on ABAC, review the Prerequisites for using RBAC before continuing. If you upgraded your cluster from an older version and are using ABAC, you should update your access controls configuration:
gcloud container clusters update "${CLUSTER_NAME}" \
  --no-enable-legacy-authorization

To create a new cluster with all of the above recommendations, run:
gcloud container clusters create "${CLUSTER_NAME}" \
  --service-account="${SA_NAME}@${PROJECT_ID}.iam.gserviceaccount.com" \
  --no-enable-legacy-authorization \
  --disable-addons=KubernetesDashboard


Create a cluster network policy


In addition to the aforementioned best practices, we recommend you create network policies to control the communication between your cluster's Pods and Services. Kubernetes Engine's Network Policy enforcement, currently in beta, makes it much more difficult for attackers to propagate inside your cluster. You can also use the Kubernetes Network Policy API to create Pod-level firewall rules in Kubernetes Engine. These firewall rules determine which Pods and Services can access one another inside your cluster.

To enable network policy enforcement when creating a new cluster, specify the --enable-network-policy flag using gcloud beta:

gcloud beta container clusters create "${CLUSTER_NAME}" \
  --project="${PROJECT_ID}" \
  --zone="${ZONE}" \
  --enable-network-policy

Once Network Policy has been enabled, you'll have to actually define a policy. Since this is specific to your exact topology, we can’t provide a detailed walkthrough. The Kubernetes documentation, however, has an excellent overview and walkthrough for a simple nginx deployment.

Note: Alpha and beta features such as Kubernetes Engine’s Network Policy API represent meaningful security improvements in the GKE APIs. Be aware that alpha and beta features are not covered by any SLA or deprecation policy, and may be subject to breaking changes in future releases. We don't recommend you use these features for production clusters.

Closing thoughts


Many of the same lessons we learned from traditional information security apply to Containers, Kubernetes, and Kubernetes Engine; we just have new ways to apply them. Adhere to least privilege, minimize your attack surface by disabling legacy or unnecessary functionality, and the most traditional of all: write good firewall policies. To learn more, visit the Kubernetes Engine webpage and documentation. If you’re just getting started with containers and Google Cloud Platform (GCP), be sure to sign up for a free trial.