Category Archives: Google Cloud Platform Blog

Product updates, customer stories, and tips and tricks on Google Cloud Platform

Announcing Google Cloud Spanner as a Vault storage backend


HashiCorp Vault is a powerful open source tool for secrets management, popular with many Google Cloud Platform (GCP) customers today. Vault provides "secret management as a service," acting as a static secret store for encrypted key-value pairs; a secret generation tool to dynamically generate on-the-fly credentials; and pass-through encryption service so applications do not need to roll their own encryption. We strive to make Google Cloud an excellent platform on which to operationalize Vault.

Using Vault will require up-front configuration choices such as which Vault storage backend to use for data persistence. Some storage backends support high availability while others are single tenant; some operate entirely in your own datacenter while others require outbound connections to third-party services; some require operational knowledge of the underlying technologies, while others work without configuration. These options required you to consider tradeoffs across issues such as consistency, availability, scalability, replication, operationalization and institutional knowledge . . . until now.

Today we're pleased to announce Cloud Spanner as a storage backend for HashiCorp Vault. Building on the scalability and consistency of Google Cloud Spanner, Vault users gain all the benefits of a traditional relational database, the scalability of a globally-distributed data store and the availability (99.999% SLA for multi-region configurations) of a fully managed service.

With support for high-performance transactions and global consistency, using Cloud Spanner as a Vault storage backend brings a number of features and benefits:
  • High availability - In addition to Cloud Spanner's built-in high availability for data persistence, the Vault storage backend also supports running Vault in high availability mode. By default, Vault runs as a single tenant, relying on the storage backend to provide distributed locking and leader election. Cloud Spanner's global distribution and strong, consistent transactions allow for a highly available Vault cluster with just a single line of configuration.
  • Transactional support - Vault backends optionally support batch transactions for update and delete operations. Without transactional support, large operations—such as deleting an entire prefix or bootstrapping a cluster—can result in hundreds of requests. This can bottleneck the system or overload the underlying storage backend. The Cloud Spanner Vault storage backend supports Vault's transactional interface, meaning it collects a batch of related update/delete operations and issues a single API call to Spanner. Not only does this reduce the number of HTTP requests and networking overhead, but it also ensures a much speedier experience for bulk operations.
  • Enterprise-grade security - Cloud Spanner follows the same security best practices as other Google products. Data stored at rest in Cloud Spanner is encrypted by default, and Cloud Spanner uses IAM to provide granular permission management. Google’s infrastructure has many security differentiators, including backing by Google’s custom-designed security chip Titan, and Google’s private network backbone.
  • Google supported - This backend was designed and developed by Google developers, and is available through the Google open-source program. It's open for collaboration to the entire Vault community with the added benefit of support from the Google engineering teams.

Getting started


To get started, download and install the latest version of HashiCorp Vault. The Google Cloud Spanner Vault storage backend was added in Vault 0.9.4 (released on February 20, 2018), so ensure you're running Vault 0.9.4 or later before you continue.

Next, create a Cloud Spanner instance and schema for storing our Vault data using the gcloud CLI tool. You can also create the instance and the schema using the web interface or API directly:

$ gcloud spanner instances create my-instance \
  --config=nam3 \
  --description=my-instance \
  --nodes=3

$ gcloud spanner databases create my-database --instance=my-instance

$ gcloud spanner databases ddl update my-database --instance=my-instance --ddl="$(cat <

Next, create a Vault configuration file with the Google Cloud Spanner storage backend configuration:

# config.hcl
storage "spanner" {
  database   = "projects/my-default-project/instances/my-instance/databases/my-database"
}

Start Vault with the configuration file. This example uses Vault's built-in development mode, which does not represent best practices or a production installation, but it's the fastest way to try the new Cloud Spanner Vault storage backend.

$ export VAULT_ADDR=http://127.0.0.1:8200
$ sudo vault server -dev -config=config.hcl

During this process, Vault authenticates and connects to Cloud Spanner to populate the data storage layer. After a few seconds, you can view the table data in the web interface and see that data has been populated. Vault is now up-and-running. Again, this is not a production-grade Vault installation. For more details on a production-grade Vault installation, please read the Vault production hardening guide. You can now create, read, update and delete secrets:

$ vault write secret/my-secret foo=bar

To learn more about the backend configuration options, read the HashiCorp Vault Google Cloud Spanner storage backend documentation. To learn more about Google Cloud Spanner, check out the Google Cloud Spanner documentation.


Toward a great Vault experience on GCP


The Cloud Spanner Vault storage backend enables organizations to leverage the consistency, availability, scalability, replication and security of Cloud Spanner while also supporting Vault's own high availability requirements. In addition to supporting our customers, we're delighted to continue our long-standing relationship with HashiCorp as part of our ongoing partnership. We're excited to see how this new storage backend enables organizations to be more successful with Vault on GCP. Be sure to follow us on Twitter and open a GitHub issue if you have any questions.

How Google Cloud Storage offers strongly consistent object listing thanks to Spanner


Here at Google Cloud, we're proud of the fact that, all of our listing operations are consistent across Google Cloud Storage. They're consistent across all Cloud Storage bucket locations, including regional and multi-regional buckets. They're consistent whether you're listing buckets in a project or listing objects within a bucket. If you create a Cloud Storage bucket or object, and then you follow that up with a request to fetch a list of resources, your resource will be in that response.

Why is this important? Strong list consistency is a big deal when you run data and analytics workloads. Here's an explanation from Johannes Fabian Rußek, Technical Product Owner at Spotify on why strongly consistent listing operations are so important to his business:
When you do not have consistent listings, there is a possibility of missing files. You cannot rely on the consistency of the data being read as you develop your products. Even worse, inconsistent listings lead to unforeseen issues. For example, our processing tooling will succeed reading partial data and may potentially produce seemingly valid outputs. Problems like these have a tendency to quickly propagate throughout the dependency tree. 
When that happens, in the best-case we notice the failure and recompute all datasets produced within the dependency tree. In the worst-case, the failure goes unnoticed and we create invalid reports and statistics. Considering the large amount of data pipelines we run, even with a low probability of that happening, a lack of list-consistency in cloud storage offerings was a major blocker for data-processing at Spotify.
Not all cloud storage services provide list-after-write consistency, which can cause challenges for some common use cases. Typically, when a user uploads an object to a cloud storage bucket, an unpredictable and unbounded amount of time passes before that object shows up in that bucket’s list of contents. This is a very weak consistency model called “eventual consistency.” In practice, if a user uploads a new object and then tries to find it from a browser on another computer, they might not see the object that they just uploaded. Similar issues impact workloads distributed across multiple compute nodes. By offering strong list consistency across all Google Cloud Storage objects, you avoid having to wrangle with these sorts of problems. Again, here’s Spotify’s Johannes Fabian Rußek:
We considered multiple workarounds, such as using a global consistency cache based on NFS, porting Netflix’s s3mper as well as persisting listings in a manifest file stored alongside the data. All of the considered solutions were suboptimal as they either introduced a single point of failure or required us to put significant resources into developing our own solution and adjusting our tooling. Strong list consistency in Cloud Storage means we can continue using our existing data-processing stack without modifications and without worrying that data may be corrupted.

List consistency on Cloud Storage is an essential feature for data processing at Spotify. We use a Hadoop-based data processing stack built on top of the Hadoop Distributed File System, which means we rely on its filesystem-like guarantees. Consistency is critical to running our business, and its absence creates many challenges.

Spanner: the secret to Cloud Storage strong list consistency 

Up until last year, Cloud Storage stored information about its buckets and objects (metadata) in a group of technologies powered by an internal Google technology called “Megastore." Megastore enabled Cloud Storage to provide important features like read-after-write consistency quickly and at very high volumes. But as is typical for object storage, Cloud Storage only provided eventual consistency for list-after-write operations.

Last year we migrated all of Cloud Storage metadata to Spanner, Google’s globally distributed and strongly consistent relational database. Spanner’s specialty is scaling horizontally while providing strong consistency guarantees and high availability. The same technology is available to Google Cloud customers today as Cloud Spanner.

Migrating to Spanner afforded Cloud Storage some key new features, including strong listing consistency. Other beneficiaries of strong listing consistency are MapReduce or Hadoop tasks, in which many workers need to produce separate work that will later be collected by some other processor. With strong listing consistency, workers can separately upload their results to a bucket, confident that a collecting job will always be able to collate all of the results with no exceptions. This is another example of how strong or external consistency makes application development more efficient.

Summary


Cloud Storage now provides strong consistency for the following operations in all types of buckets in all regions:

  • Read-after-write consistency: Reading an object after writing it has completed, for both new objects and overwrites of existing objects 
  • Read-after-update consistency: Reading an object’s metadata after updating its metadata 
  • Read-after-delete consistency: Reading an object will fail with a 404 immediately after it has been deleted 
  • List-after-write consistency: Fetching a list of buckets and objects will always reflect any changes that have previously completed 
  • Granting additional permissions for access to resources: For example, when you grant a new user permission to read an object, that user can immediately read the object
  • Some operations or permissions changes provide bounded consistency. Such as read operations on public cached objects, designed to achieve top cache performance. Details can be found here.

We’re excited by the new functionality that hosting Cloud Storage metadata on Spanner brings to the table. You can learn more about Cloud Storage’s consistency model in our documentation: https://cloud.google.com/storage/docs/consistency.

Managing your Compute Engine instances just got easier


If you use Compute Engine, you probably spend a lot of time creating, cloning and managing VM instances. We recently added new management features that will make performing those tasks much easier.

More ways to create instances and use instance templates


With the recent updates to Compute Engine instance templates, now you can create instances from existing instance templates, and create instance templates based on existing VM instances. These features are available independently of Managed Instance Groups, giving you more power (and flexibility) in creating (and managing) your VM instances.

Imagine you're running a VM instance as part of your web-based application, and are moving from development to production. You can now configure your instance exactly the way you want it and then save your golden config as an instance template. You can then use the template to launch as many instances as you need, configured exactly the way you want. In addition, you can tweak VMs launched from an instance template using the override capability.

You can create instance templates using the Cloud Console, CLI or the API. Let’s look at how to create an instance template and instance from the console. Select a VM instance, click on the “Create instance” drop down button, and choose “From template.” Then select the template you would like to use to create the instance.

Create multiple disks when you launch a VM instance


Creating a multiple disk configuration for a VM instance also just got easier. Now you can create multiple persistent disks as part of the virtual machine instance creation workflow. Of course, you can still attach disks later to existing VM instances—that hasn’t changed.

This feature is designed to help you when you want to create data disks and/or application disks that are separate from your operating system disk. You can also use the ability to create multiple disks on launch for instances within a managed instance group by defining multiple disks in the instance template, which makes the MIG a scalable way to create a group of VMs that all have multiple disks.

To create additional disks in the Google Cloud SDK (gcloud CLI), use the --create-disk flag.

Create an image from a running VM instance


When creating an image of a VM instance for cloning, sharing or backup purposes, you may not want to disrupt the services running on that instance. Now you can create images from a disk that's attached to a running VM instance. From the Cloud Console, check the “Keep instance running” checkbox, or from the API, set the force-create flag to true.


Protect your virtual machines from accidental deletion


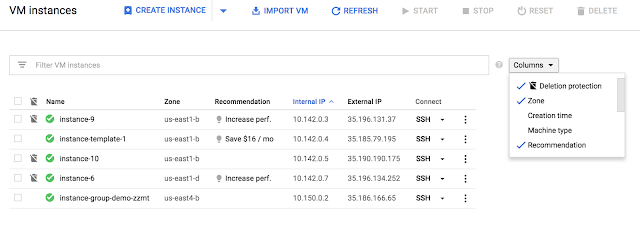
Accidents happen from time to time, and sometimes that means you delete a VM instance and interrupt key services. You can now protect your VMs from accidental deletion by setting a simple flag. This is especially important for VM instances running critical workloads and applications such as SQL Server instances, shared file system nodes, license managers, etc.

You can enable (and disable) the flag using the Cloud Console, SDK or the API. The screenshot below shows how to enable it through the UI; and how to view the deletion protection status of your VM instances from the list view.

Conclusion


If you already use Compute Engine, you can start using these new features right away from the console, Google Cloud SDK or through APIs. If you aren’t yet using Compute Engine, be sure to sign up for a free trial to get $300 in free cloud credits. To learn more, please visit the instance template, instance creation, custom images and deletion protection product documentation pages.

Creating a single pane of glass for your multi-cloud Kubernetes workloads with Cloudflare


[Editor’s note: As much as we’d love to host all your workloads on Google Cloud Platform (GCP), sometimes it’s not in the cards. Today we hear from Cloudflare about how to enable a multi-cloud configuration using its load balancer to front Kubernetes-based workloads in both Google Kubernetes Engine and Amazon Web Services (AWS).]

One of the great things about container technology is that it delivers the same experience and functionality across different platforms. This frees you as a developer from having to rewrite or update your application to deploy it on a new cloud provider—or lets you run it across multiple cloud providers. With a containerized application running on multiple clouds, you can avoid lock-in, run your application on the cloud for which it’s best suited, and lower your overall costs.

If you’re using Kubernetes, you probably manage traffic to clusters and services across multiple nodes using internal load-balancing services, which is the most common and practical approach. But if you’re running an application on multiple clouds, it can be hard to distribute traffic intelligently among them. In this blog post, we show you how to use Cloudflare Load Balancer in conjunction with Kubernetes so you can start to achieve the benefits of a multi-cloud configuration.

The load balancers offered by most cloud vendors are often tailored to a particular cloud infrastructure. Load balancers themselves can also be single points of failure. Cloudflare’s Global Anycast Network comprises 120 data centers worldwide and offer all Cloudflare functions, including Load Balancing, to deliver speed and high availability regardless of which clouds your origin servers are hosted on. Users are directed to the closest and most suitable data center to the user, maximizing availability and minimizing latency. Should there be any issue connecting to a given datacenter, user traffic is automatically rerouted to the next best available option. It also health-checks your origins, notifying you via email if one of them is down, while automatic failover capabilities keep your services available to the outside world.

By running containerized applications across multiple clouds, you can be platform-agnostic and resilient to major outages. Cloudflare represents a single pane of glass to:
  • Apply and monitor security policies (DDoS mitigation, WAF, etc.)
  • Manage routing across multiple regions or cloud vendors, using our Load Balancer
  • Tweak performance settings from a single location. This reduces the time you spend managing configurations as well as the possibility of a misconfiguration
  • Add and modify additional web applications as you migrate services from on-premise to cloud or between different cloud providers

Load balancing across AWS and GCP with Cloudflare


To give you a better sense of how to do this, we created a guide on how to deploy an application using Kubernetes on GCP and AWS along with our Cloudflare Load Balancer.

The following diagram shows how the Cloudflare Load Balancer distributes traffic between Google Cloud and another cloud vendor for an application deployed on Kubernetes. In this example, the GCP origin server uses an ingress controller and an HTTP load balancer, while another cloud vendor origin its uses own load balancer. The key takeaway is that Cloudflare Load Balancer works with any of these origin configurations.
Here's an overview of how to set up a load-balanced application across multiple clouds with Cloudflare.

Step 1: Create a container cluster


GCP provides built-in support for running Kubernetes containers with Google Kubernetes Engine. You can access it with Google Cloud Shell, which is preinstalled with gcloud, docker and kubectl command-line tools. Running the following command creates a three-node cluster:

$gcloud container clusters create camilia-cluster --num-nodes=3 

Now you have a pool of Compute Engine VM instances running Kubernetes.

AWS


AWS recently announced support for the Kubernetes container orchestration system on top of its Elastic Container Service (ECS). Click Amazon EKS to sign up for the preview.

Until EKS is available, here’s how to create a Kubernetes cluster on AWS:
  • Install the following tools on your local machine: Docker, AWS CLI with an AWS account, Kubectl and Kops (a tool provided by Kubernetes that simplifies the creation of the cluster) 
  • Have a domain name, e.g. mydomain.com
  • In the AWS console have a policy for your user to access the AWS Elastic Container Registry
In addition, you need to have two additional AWS resources in order to create a Kubernetes cluster:
  • An S3 bucket to store information about the created cluster and its configuration 
  • A Route53 domain (hosted zone) on which to run the container, e.g., k8s.mydomain.com. Kops uses DNS for discovery, both inside the cluster and so that you can reach the Kubernetes API server from clients
Once you’ve set up the S3 bucket and created a hosted zone using Kops, you can create the configuration for the cluster and save it on S3:

$kops create cluster --zones us-east-1a k8saws.usualwebsite.com

Then, run the following command to create the cluster in AWS:

$kops update cluster k8saws.usualwebsite.com --yes

Kops then creates one master node and two slaves. This is the default config for Kops.

Step 2: Deploy the application

This step is the same across both Kubernetes Engine and AWS. After you create a cluster, use kubectl to deploy applications to the cluster. You can usually deploy them from a docker image.

$kubectl run camilia-nginx --image=nginx --port 80

This creates a pod that is scheduled to one of the slave nodes.

Step 3 - Expose your application to the internet 


On AWS, exposing an application to traffic from the internet automatically assigns an external IP address to the service and creates an AWS Elastic Load Balancer.

On GCP, however, containers that run on Kubernetes Engine are not accessible from the internet by default, because they do not have external IP addresses by default. With Kubernetes Engine, you must expose the application as a service internally and create an ingress resource with the ingress controller, which creates an HTTP(S) load balancer.

To expose the application as a service internally, run the following command:

$kubectl expose deployment camilia-nginx --target-port=80  
--type=NodePort

In order to create an ingress resource so that your HTTP(S) web server application is publicly accessible, you'll need to create the yaml configuration file. This file defines an ingress resource that directs traffic to the service.

Once you’ve deployed the ingress resource, the ingress controller that's running in your cluster creates an HTTP(S) Load Balancer to route all external HTTP traffic to the service.

Step 4 - Scale up your application 


Adding additional replicas (pods) is the same for both Kubernetes Engine and AWS. This step ensures there are identical instances running the application.

$kubectl scale deployment camilia-nginx --replicas=3

The Load Balancer that was provisioned in the previous step now starts routing traffic to these new replicas automatically.

Setting up Cloudflare Load Balancer

Now, you’re ready to set up Cloudflare Load Balancer, a very straightforward process:
  • Create a hostname for Load Balancer, for example lb.mydomain.com 
  • Create Origin Pools, for example, a first pool for GCP, and a second pool for AWS 
  • Create Health Checks 
  • Set up Geo Routing, for example all North America East traffic routes to AWS instance, etc.

Please see our documentation for detailed instructions how to set up the Cloudflare Load Balancer.

Introducing Cloudflare Warp


Working with StackPointCloud we also developed a Cloudflare WARP Ingress Controller, which makes it very easy to launch Kubernetes across multiple cloud vendors and uses Cloudflare controller to tie them together. Within StackPointCloud, adding the Cloudflare Warp Ingress Controller requires just a single click. One more click and you've deployed a Kubernetes cluster. Behind the scenes, it implements an ingress controller using a Cloudflare Warp tunnel to connect a Cloudflare-managed URL to a Kubernetes service. The Warp controller manages ingress tunnels in a single namespace of the cluster. Multiple controllers can exist in different namespaces, with different credentials for each namespace.

Kubernetes in a multi-cloud world


With the recent announcement of native Kubernetes support in AWS, as well as existing native support in GCP and Microsoft Azure, it’s clear that Kubernetes is emerging as the leading technology for managing heterogeneous cloud workloads, giving you a consistent way to deploy and manage your applications regardless of which cloud provider they run on. Using Cloudflare Load Balancer in these kinds of multi-cloud configurations lets you direct traffic between clouds, while avoiding vendor-specific integrations and lock-in. To learn more about Cloudflare, visit our website, or reach out to us with any questions — we’d love to hear from you!

The thing is . . . Cloud IoT Core is now generally available


Today, we’re excited to announce that Cloud IoT Core, our fully managed service to help securely connect and manage IoT devices at scale, is now generally available.

With Cloud IoT Core, you can easily connect and centrally manage millions of globally dispersed connected devices. When used as part of the broader Google Cloud IoT solution, you can ingest all your IoT data and connect to our state-of-the-art analytics and machine learning services to gain actionable insights.

Already, Google Cloud Platform (GCP) customers are using connected devices and Cloud IoT Core as the foundation of their IoT solutions. Whether it’s smart cities, the sharing economy or next-generation seismic research, we’re thrilled that Cloud IoT Core is helping innovative companies build the future.


Customers share feedback


Schlumberger is the world's leading provider of technology for reservoir characterization, drilling, production, and processing to the oil and gas industry.
"As part of our IoT integration strategy, Google Cloud IoT Core has helped us focus our engineering efforts on building oil and gas applications by leveraging existing IoT services to enable fast, reliable and economical deployment. We have been able to build quick prototypes by connecting a large number of devices over MQTT and perform real-time monitoring using Cloud Dataflow and BigQuery."  
 Chetan Desai, VP Digital Technology, Schlumberger Limited

Smart Parking is a New Zealand-based company that has used Cloud IoT Core from its earliest days to build out a smart city platform, helping direct traffic, parking and city services.
"Using Google Cloud IoT Core, we have been able to completely redefine how we manage the deployment, activation and administration of sensors and devices. Previously, we needed to individually set up each sensor/device. Now we allocate manufactured batches of devices into IoT Core for site deployments and then, using a simple activation smartphone app, the onsite installation technician can activate the sensor or device in moments. Job done!" 
  John Heard, Group CTO, Smart Parking Limited
Bike-sharing pioneer Blaze uses Cloud IoT Core to manage its Blaze Future Data Platform, which uses a combination of GPS, accelerometers and atmospheric sensing for its smart bikes. Its capabilities include air pollution sensing, pothole detection, recording accidents and near misses, and capturing insights around journeys.
"Blaze is able to rapidly build the technology platform our customers and cyclists require on Google Cloud by more securely connecting our products and fleets of bikes to Cloud IoT Core and then run demand forecasting using BigQuery and Machine Learning." 
 Philip Ellis, Co-Founder & COO, Blaze

Grupo ADO is the largest bus operator in Latin America. It operates inter-city routes as well as short routes and tourist charters.
"Agosto, a Google Cloud Premier partner, performed business and technical reviews of MOBILITY ADO’s existing architecture, applications and core data workflows which had been in place for about 12 years. These systems were originally very robust, but over time, we faced challenges with innovating on the existing technology stack, as well as with the optimization of operational costs. Agosto created a proof-of-concept which showcased that a Cloud IoT Core-based architecture was a viable path to modernization and functional optimization of many of our existing, core components. MOBILITY ADO now has real time access to bus diagnostic data via Google Cloud data and analytics services and a clear path to future-proof our platform."  
 Humberto Campos, IT Director, MOBILITY ADO


Enabling the Cloud IoT Core partner ecosystem

At the same time, we continue to grow our ecosystem of partners, providing companies with the insight and staff to build custom IoT solution that best fits their needs. On the device side, we have a variety of partners whose hardware works seamlessly with IoT Core. Application partners, meanwhile, help customers build solutions using IoT Core and other Google Cloud services.
(click to enlarge)

Improving the Cloud IoT Core experience


Since we announced the public beta of Cloud IoT Core last fall, we’ve been actively listening to your feedback. This general availability release incorporates an important new feature: You can now publish data streams from the IoT Core protocol bridge to multiple Cloud Pub/Sub topics, simplifying deployments.

For example, imagine you have a device that publishes multiple types of data, such as temperature, humidity and logging data. By directing these data streams to their own individual Pub/Sub topics, you can eliminate the need to separate the data into different categories after publishing.

And that’s just the beginning—watch this space as we build out Cloud IoT Core with additional features and enhancements. We look forward to helping you scale your production IoT deployments. To get started check out this quick-start tutorial on Cloud IoT Core, and provide us with your feedback—we’d love to hear from you!

96 vCPU Compute Engine instances are now generally available


Today we're happy to announce the general availability of Compute Engine machine types with 96 vCPUs and up to 624 GB of memory. Now you can take advantage of the performance improvements and increased core count provided by the new Intel Xeon Scalable Processors (Skylake). For applications that can scale vertically, you can leverage all 96 vCPUs to decrease the number of VMs needed to run your applications, while reducing your total cost of ownership (TCO).

You can launch these high-performance virtual machines (VMs) as three predefined machine types, and as custom machine types. You can also adjust your extended memory settings to create a machine with the exact amount of memory and vCPUs you need for your applications.

These new machine types are available in GCP regions globally. You can currently launch 96 vCPU VMs in us-central1, northamerica-northeast1, us-east1, us-west1, europe-west1, europe-west4, and asia-east1, asia-south1 and asia-southeast1. Stay up-to-date on additional regions by visiting our available regions and zones page.

Customers are doing exciting things with the new 96 vCPU machine types including running in-memory databases such as SAP HANA, media rendering and production, and satellite image analysis.
"When preparing petabytes of global satellite imagery to be calibrated, cleaned up, and "science-ready" for our machine learning models, we do a tremendous amount of image compression. By leveraging the additional compute resources available with 96 vCPU machine types, as well as Advanced Vector Extensions such as AVX-512 with Skylake, we have seen a 38% performance improvement in our compression and a 23% improvement in our imagery expansions. This really adds up when working with petabytes of satellite and aerial imagery." 
- Tim Kelton, Co-Founder, Descartes Labs
The 96 vCPU machine types enable you to take full advantage of the performance improvements available through the Intel Xeon Scalable Processor (Skylake), and the supported AVX-512 instruction set. Our partner Altair demonstrated how you can achieve up to 1.8X performance improvement using the new machine types for HPC workloads. We also worked with Intel to support your performance and scaling efforts by providing the Intel Performance libraries freely on Compute Engine. You can take advantage of these components across all machine types, but they're of particular interest for applications that can exploit the scale of 96 vCPU instances on Skylake-based servers.

The following chart shows an example of the performance improvements delivered by using the Intel Distribution for Python: scikit-learn on Compute Engine with 96 vCPUs.

Visit the GCP Console to create a new instance. To learn more, you can read the documentation for instructions on creating new virtual machines with the gcloud command line tool. 


At Google Cloud, we’re committed to helping customers access state-of-the-art compute infrastructure on GCP. To get started, sign up for a free trial today and get $300 in free cloud credits to get started! 

Get the most out of Google Kubernetes Engine with Priority and Preemption


Wouldn’t it be nice if you could ensure that your most important workloads always get the resources they need to run in a Kubernetes cluster? Now you can. Kubernetes 1.9 introduces an alpha feature called “priority and preemption” that allows you to assign priorities to your workloads, so that more important pods evict less important pods when the cluster is full.

Before priority and preemption, Kubernetes pods were scheduled purely on a first-come-first-served basis, and ran to completion (or forever, in the case of pods created by something like a Deployment or StatefulSet). This meant less important workloads could block more important, later-arriving, workloads from running—not the desired effect. Priority and preemption solves this problem.

Priority and preemption is valuable in a number of scenarios. For example, imagine you want to cap autoscaling to a maximum cluster size to control costs, or you have clusters that you can’t grow in real-time (e.g., because they are on-premises and you need to buy and install additional hardware). Or you have high-priority cloud workloads that need to scale up faster than the cluster autoscaler can add nodes. In short, priority and preemption lead to better resource utilization, lower costs and better service levels for critical applications.


Predictable cluster costs without sacrificing safety


In the past year, the Kubernetes community has made tremendous strides in system scalability and support for multi-tenancy. As a result, we see an increasing number of Kubernetes clusters that run both critical user-facing services (e.g., web servers, application servers, back-ends and other microservices in the direct serving path) and non-time-critical workloads (e.g., daily or weekly data analysis pipelines, one-off analytics jobs, developer experiments, etc.). Sharing a cluster in this way is very cost-effective because it allows the latter type of workload to partially or completely run in the “resource holes” that are unused by the former, but that you're still paying for. In fact, a study of Google’s internal workloads found that not sharing clusters between critical and non-critical workloads would increase costs by as much as almost 60 percent. In the cloud, where node sizes are flexible and there's less resource fragmentation, we don’t expect such dramatic results from Kubernetes priority and preemption, but the general premise still holds.

The traditional approach to filling unused resources is to run less important workloads as BestEffort. But because the system does not explicitly reserve resources for BestEffort pods, they can be starved of CPU or killed if the node runs out of memory—even if they're only consuming modest amounts of resources.

A better alternative is to run all workloads as Burstable or Guaranteed, so that they receive a resource guarantee. That, however, leads to a tradeoff between predictable costs and safety against load spikes. For example, consider a user-facing service that experiences a traffic spike while the cluster is busy with non-time-critical analytics workloads. Without the priority and preemption capabilities, you might prioritize safety, by configuring the cluster autoscaler without an upper bound or with a very high upper bound. That way, it can handle the spike in load even while it’s busy with non-time-critical workloads. Alternately, you might pick predictability by configuring the cluster autoscaler with a tight bound, but that may prevent the service from scaling up sufficiently to handle unexpected load.

With the addition of priority and preemption, on the other hand, Kubernetes evicts pods from the non-time-critical workload when the cluster runs out of resources, allowing you to set an upper bound on cluster size without having to worry that the serving pipeline might not scale sufficiently to handle the traffic spike. Note that evicted pods receive a termination grace period before being killed, which is 30 seconds by default.

Even if you don’t care about the predictability vs. safety tradeoff, priority and preemption are still useful, because preemption evicts a pod faster than a cloud provider can usually provision a Kubernetes node. For example, imagine there's a load spike to a high-priority user-facing service, so the Horizontal Pod Autoscaler creates new pods to absorb the load. If there are low-priority workloads running in the cluster, the new, higher-priority pods can start running as soon as pod(s) from low-priority workloads are evicted; they don’t have to wait for the cluster autoscaler to create new nodes. The evicted low-priority pods start running again once the cluster autoscaler has added node(s) for them. (If you want to use priority and preemption this way, a good practice is to set a low termination grace period for your low-priority workloads, so the high-priority pods can start running quickly.)

Enabling priority and preemption on Kubernetes Engine


We recently made Kubernetes 1.9 available in Google Kubernetes Engine, and made priority and preemption available in alpha clusters. Here’s how to get started with this new feature:

  1. Create an alpha cluster—please note the cited limitations. 
  2. Follow the instructions to create at least two PriorityClasses in your Kubernetes cluster. 
  3. Create workloads (using Deployment, ReplicaSet, StatefulSet, Job, or whatever you like) with the priorityClassName field filled in, matching one of the PriorityClasses you created.

If you wish, you can also enable the cluster autoscaler and set a maximum cluster size. In that case your cluster will not grow above the configured maximum number of nodes, and higher-priority pods will evict lower-priority pods when the cluster reaches its maximum size and there are pending pods from the higher priority classes. If you don’t enable the cluster autoscaler, the priority and preemption behavior is the same, except that the cluster size is fixed.

Advanced technique: enforcing “filling the holes”


As we mentioned earlier, one of the motivations for priority and preemption is to allow non-time-critical workloads to “fill the resource holes” between important workloads on a node. To enforce this strictly, you can associate a workload with a PriorityClass whose priority is less than zero. Then the cluster autoscaler does not add the nodes necessary for that workload to run, even if the cluster is below the maximum size configured for the autoscaler.

Thus you can create three tiers of workloads of decreasing importance:

  • Workloads that can access the entire cluster up to the cluster autoscaler maximum size 
  • Workloads that can trigger autoscaling but that will be evicted if the cluster has reached the configured maximum size and higher-priority work needs to run
  • Workloads that will only “fill the cracks” in the resource usage of the higher-priority workloads, i.e., that will wait to run if they can’t fit into existing free resources.

And because PriorityClass maps to an integer, you can of course create many sub-tiers within these three categories.

Let us know what you think!


Priority and preemption are welcome additions in Kubernetes 1.9, making it easier for you to control your resource utilization, establish workload tiers and control costs. Priority and preemption is still an alpha feature. We’d love to know how you are using it, and any suggestions you might have for making it better. Please contact us at [email protected].

To explore this new capability and other features of Kubernetes Engine, you can quickly get started using our 12-month free trial.

Cloud TPU machine learning accelerators now available in beta


Starting today, Cloud TPUs are available in beta on Google Cloud Platform (GCP) to help machine learning (ML) experts train and run their ML models more quickly.
Cloud TPUs are a family of Google-designed hardware accelerators that are optimized to speed up and scale up specific ML workloads programmed with TensorFlow. Built with four custom ASICs, each Cloud TPU packs up to 180 teraflops of floating-point performance and 64 GB of high-bandwidth memory onto a single board. These boards can be used alone or connected together via an ultra-fast, dedicated network to form multi-petaflop ML supercomputers that we call “TPU pods.” We will offer these larger supercomputers on GCP later this year.

We designed Cloud TPUs to deliver differentiated performance per dollar for targeted TensorFlow workloads and to enable ML engineers and researchers to iterate more quickly. For example:

  • Instead of waiting for a job to schedule on a shared compute cluster, you can have interactive, exclusive access to a network-attached Cloud TPU via a Google Compute Engine VM that you control and can customize. 
  • Rather than waiting days or weeks to train a business-critical ML model, you can train several variants of the same model overnight on a fleet of Cloud TPUs and deploy the most accurate trained model in production the next day. 
  • Using a single Cloud TPU and following this tutorial, you can train ResNet-50 to the expected accuracy on the ImageNet benchmark challenge in less than a day, all for well under $200! 

ML model training, made easy

Traditionally, writing programs for custom ASICs and supercomputers has required deeply specialized expertise. By contrast, you can program Cloud TPUs with high-level TensorFlow APIs, and we have open-sourced a set of reference high-performance Cloud TPU model implementations to help you get started right away:


To save you time and effort, we continuously test these model implementations both for performance and for convergence to the expected accuracy on standard datasets.

Over time, we'll open-source additional model implementations. Adventurous ML experts may be able to optimize other TensorFlow models for Cloud TPUs on their own using the documentation and tools we provide.

By getting started with Cloud TPUs now, you’ll be able to benefit from dramatic time-to-accuracy improvements when we introduce TPU pods later this year. As we announced at NIPS 2017, both ResNet-50 and Transformer training times drop from the better part of a day to under 30 minutes on a full TPU pod, no code changes required.

Two Sigma, a leading investment management firm, is impressed with the performance and ease of use of Cloud TPUs.
"We made a decision to focus our deep learning research on the cloud for many reasons, but mostly to gain access to the latest machine learning infrastructure. Google Cloud TPUs are an example of innovative, rapidly evolving technology to support deep learning, and we found that moving TensorFlow workloads to TPUs has boosted our productivity by greatly reducing both the complexity of programming new models and the time required to train them. Using Cloud TPUs instead of clusters of other accelerators has allowed us to focus on building our models without being distracted by the need to manage the complexity of cluster communication patterns." 
Alfred Spector, Chief Technology Officer, Two Sigma

A scalable ML platform


Cloud TPUs also simplify planning and managing ML computing resources:

  • You can provide your teams with state-of-the-art ML acceleration and adjust your capacity dynamically as their needs change. 
  • Instead of committing the capital, time and expertise required to design, install and maintain an on-site ML computing cluster with specialized power, cooling, networking and storage requirements, you can benefit from large-scale, tightly-integrated ML infrastructure that has been heavily optimized at Google over many years.
  • There’s no more struggling to keep drivers up-to-date across a large collection of workstations and servers. Cloud TPUs are preconfigured—no driver installation required!
  • You are protected by the same sophisticated security mechanisms and practices that safeguard all Google Cloud services.

“Since working with Google Cloud TPUs, we’ve been extremely impressed with their speed—what could normally take days can now take hours. Deep learning is fast becoming the backbone of the software running self-driving cars. The results get better with more data, and there are major breakthroughs coming in algorithms every week. In this world, Cloud TPUs help us move quickly by incorporating the latest navigation-related data from our fleet of vehicles and the latest algorithmic advances from the research community.
Anantha Kancherla, Head of Software, Self-Driving Level 5, Lyft
Here at Google Cloud, we want to provide customers with the best cloud for every ML workload and will offer a variety of high-performance CPUs (including Intel Skylake) and GPUs (including NVIDIA’s Tesla V100) alongside Cloud TPUs.

Getting started with Cloud TPUs


Cloud TPUs are available in limited quantities today and usage is billed by the second at the rate of $6.50 USD / Cloud TPU / hour.

We’re thrilled to see the enthusiasm that customers have expressed for Cloud TPUs. To help us manage demand, please sign up here to request Cloud TPU quota and describe your ML needs. We’ll do our best to give you access to Cloud TPUs as soon as we can.

To learn more about Cloud TPUs, join us for a Cloud TPU webinar on February 27th, 2018.

GPUs in Kubernetes Engine now available in beta


Last year we introduced our first GPU offering for Google Kubernetes Engine with the alpha launch of NVIDIA Tesla GPUs and received an amazing customer response. Today, GPUs in Kubernetes Engine are in beta and ready to be used widely from the latest Kubernetes Engine release.

Using GPUs in Kubernetes Engine can turbocharge compute-intensive applications like machine learning (ML), image processing and financial modeling. By packaging your CUDA workloads into containers, you can benefit from the massive processing power of Kubernetes Engine’s GPUs whenever you need it, without having to manage hardware or even VMs.

With its best-in-class CPUs, GPUs, and now TPUs, Google Cloud provides the best choice, flexibility and performance for running ML workloads in the cloud. The ride-sharing pioneer Lyft, for instance, uses GPUs in Kubernetes Engine to accelerate training of its deep learning models.
"GKE clusters are ideal for deep learning workloads, with out-of-the box GPU integration, autoscaling clusters for our spiky training workloads, and integrated container logging and monitoring." 
— Luc Vincent, VP of Engineering at Lyft

Both the NVIDIA Tesla P100 and K80 GPUs are available as part of the beta—and V100s are on the way. Recently, we also introduced Preemptible GPUs as well as new lower prices to unlock new opportunities for you. Check out the latest prices for GPUs here.

Getting started with GPUs in Kubernetes Engine


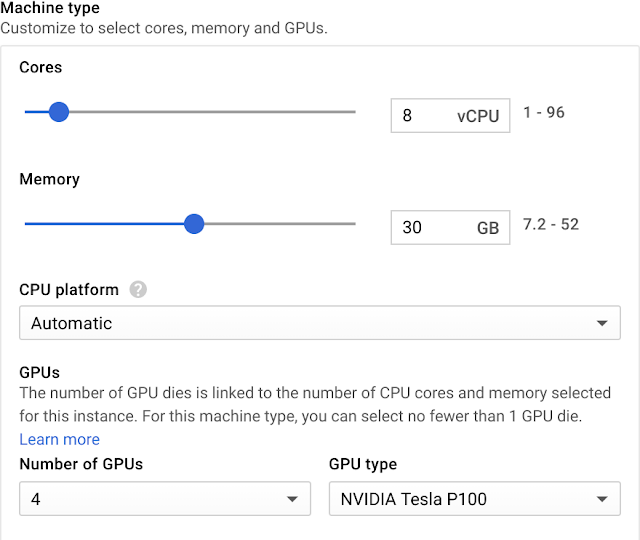
Creating a cluster with GPUs in Kubernetes Engine is easy. From the Cloud Console, you can expand the machine type on the "Creating Kubernetes Cluster" page to select the types and the number of GPUs.
And if you want to add nodes with GPUs to your existing cluster, you can use the Node Pools and Cluster Autoscaler features. By using node pools with GPUs, your cluster can use GPUs whenever you need them. Autoscaler, meanwhile, can automatically create nodes with GPUs whenever pods requesting GPUs are scheduled, and scale down to zero when GPUs are no longer consumed by any active pods.

The following command creates a node pool with GPUs that can scale up to five nodes and down to zero nodes.

gcloud beta container node-pools create my-gpu-node-pool 
--accelerator=type=nvidia-tesla-p100,count=1 
--cluster=my-existing-cluster --num-nodes 2 
--min-nodes 0 --max-nodes 5 --enable-autoscaling

Behind the scenes, Kubernetes Engine applies taint and toleration techniques to ensure only pods requesting GPUs will be scheduled on the nodes with GPUs, and prevent pods that don't require GPUs from running on them.

While Kubernetes Engine does a lot of things behind the scenes for you, we also want you to understand how your GPU jobs are performing. Kubernetes Engine exposes metrics for containers using GPUs, such as how busy the GPUs are, how much memory is available, and how much memory is allocated. You can also visualize these metrics by using Stackdriver.

Figure 1: GPU duty cycle for three different jobs

For a more detailed explanation of Kubernetes Engine with GPUs, for example installing NVIDIA drivers and how to configure a pod to consume GPUs, check out the documentation.

Tackling new workloads with Kubernetes


In 2017, Kubernetes Engine core-hours grew 9X year over year, and the platform is gaining momentum as a premier deployment platform for ML workloads. We’re very excited about open source projects like Kubeflow that make it easy, fast and extensible to run ML stacks in Kubernetes. We hope that the combination of these open-source ML projects and GPUs in Kubernetes Engine will help you innovate in business, engineering and science.

Try it today


To get started using GPUs with Kubernetes Engine using our free-trial of $300 credits, you’ll need to upgrade your account and apply for a GPU quota for the credits to take effect.

Thanks for the support and feedback in shaping our roadmap to better serve your needs. Keep the conversation going, and connect with us on the Kubernetes Engine Slack channel.

Applying the Escalation Policy — CRE life lessons


In past posts, we’ve discussed the importance of creating an explicit policy document describing how to escalate SLO violations, and given a real-world example of a document from an SRE team at Google. This final post is an exercise in hypotheticals, to provide some scenarios that exercise the policy and illustrate edge cases. The following scenarios all assume a "three nines" availability SLO for a service that burns half its error budget on background errors, i.e., our error budget is 0.1% errors, and serving 0.05% errors is "normal."

First, let's recap the policy thresholds:

  • Threshold 1: Automated alerts notify SRE of an at-risk SLO 
  • Threshold 2: SREs conclude they need help to defend SLO and escalate to devs 
  • Threshold 3: The 30-day error budget is exhausted and the root cause has not been found; SRE blocks releases and asks for more support from the dev team 
  • Threshold 4: The 90-day error budget is exhausted and the root cause has not been found; SRE escalates to executive leadership to commandeer more engineering time for reliability work

With that refresher in mind, let’s dig in to these SLO violations.

Scenario 1: A short but severe outage is quickly root-caused to a dependency problem

Scenario: A bad push of a critical dependency causes a 50% outage for an hour as the team responsible for the dependency rolls back the bad release. The error rate returns to previous levels when the rollback completes, and the team identifies the commit that is the root cause and reverts it. The team responsible for the dependency writes a postmortem to which SREs for the service contribute some AIs to prevent recurrence.

Error budget: Assuming three nines, the service burned 70% of a 30-day error budget during this outage alone. It has exceeded the 7-day budget, and, given background errors, the 30-day budget as well.

Escalation: SRE was alerted to deal with the impact to production (Threshold 1). If SRE judges the class of issue (bad config or binary push) to be sufficiently rare or adequately mitigated, then the service is "brought back into SLO", and the policy requires no other escalation. This is by design—the policy errs on the side of development velocity, and blocking releases solely because the 30-day error budget is exhausted goes against that.

If this is a recurring issue (e.g., occurring two weeks in a row, burning most of a quarter's error budget) or is otherwise judged likely to recur, then it’s time to escalate to Threshold 2 or 3.

Scenario 2: A short but severe outage has no obvious root cause


Scenario: The service has a 50% outage for an hour, cause unknown.

Error budget: Same as previous scenario: the service has exceeded both its 7-day and 30-day error budgets.

Escalation: SRE is alerted to deal with the impact to production (Threshold 1). SRE escalates quickly to the dev team. They may request new metrics to provide additional visibility of the problem, install fallback alerting, and the SRE and dev oncall prioritize investigating the issue for the next week (Threshold 2).

If the root cause continues to evade understanding, SRE pauses feature releases after the first week until the outage passes out of the 30-day SLO measurement window. More of the SRE and dev teams are pulled from their project work to debug or try to reproduce the outage—this is their number-one priority until the service is back within SLO or they find the root cause. As the investigation continues, SRE and dev teams shift towards mitigation, work-arounds and building defense-in-depth. Ideally, by the time the outage passes over the SLO horizon, SRE is confident that any recurrence will be easier to root-cause and will not have the same impact. In this situation, they can justify resuming release pushes even without having identified a concrete root cause.

Scenario 3: A slow burn of error budget with a badly attributed root cause


Scenario: A regression makes it into prod at time T, and the service begins serving 0.15% errors. The root cause of the regression eludes both SRE and developers for weeks; they attempt multiple fixes but don’t reduce the impact.

Error budget: If left unresolved, this burns 1.5 months' error budget per month.

Escalation: The SRE oncall is notified via ticket at around T+5 days, when the 7-day budget is burned. SRE triggers Threshold 2 and escalates to the dev team at about T+7 days. Because of some correlations with increased CPU utilization, the SRE and dev oncall hypothesize that the root cause of the errors is a performance regression. The dev oncall finds some simple optimizations and submits them; these get into production at T+16 days as part of the normal release process. The fixes don't resolve the problem, but now it is impractical to roll back two weeks of daily code releases for the affected service.

At T+20 days, the service exceeds its 30-day error budget, triggering Threshold 3. SRE stops releases and escalates for more dev engagement. The dev team agrees to assemble a working party of two devs and one SRE, whose priority is to root-cause and remedy the problem. With no good correlation between code changes and the regression, they start doing in-depth performance profiling and removing more bottlenecks. All the fixes are aggregated into a weekly patch on top of the current production release. The efficiency of the service increases noticeably, but it still serves an elevated rate of errors.

At T+60 days, the service expends its 90-day error budget, triggering Threshold 4. SRE escalates to executive leadership to ask for a significant quantity of development effort to address the ongoing lack of reliability. The dev team does a deep dive and finds some architectural problems, eventually reimplementing some features to close out an edge-case interaction between server and client. Error rates revert to their previous state and blocked features roll out in batches once releases begin again.

Scenario 4: Recurring, transient SLI excursions


Scenario: Binary releases cause transient error spikes that occur with the daily or weekly release.

Error budget: If the errors don’t threaten the long term SLO, it's entirely SRE's responsibility to ensure the alert is properly tuned. So, for the sake of this scenario, assume that the error spikes don’t threaten the SLO over any window longer than a few hours.

Escalation: SLO-based alerting initially notifies SREs, and the escalation path proceeds as in the slow-burn case. In particular, the issue should not be considered "resolved" simply because the SLI returns to normal between releases, since the bar for bringing a service back into SLO is set higher than that. SRE may tune the alert so that a longer or faster burn of error budget triggers a page, and may decide to investigate the issue as part of their ongoing work on the service’s reliability.

Summary


It's important to “war-game” any escalation policy with hypothetical scenarios to make sure there are no unexpected edge cases and to check that the wording is clear. Circulate draft policies widely and address concerns that are raised in appendices, but don't clutter the policy itself with justifications of the chosen inflection points. Expect to have an extended discussion if your peers find your proposals contentious. Remember that the example shared here is just thata real-life SRE team looking to meet a high availability target would likely structure their escalation policy quite differently.