Category Archives: Google Cloud Platform Blog

Product updates, customer stories, and tips and tricks on Google Cloud Platform

Network policies for Kubernetes are generally available


We're pleased to announce the GA of network policies for Kubernetes, which we originally announced into beta last September. Network policies are fully tested and supported for production workloads on Google Kubernetes Engine, and, as a community, we recommend users enable them.

Network policies are sets of constraints that allow Kubernetes admins to designate how groups of Pods can communicate with each other, allowing the creation of a hierarchy of network controls. For example, if you have a multi-tier application, you can create a network policy that ensures a compromised front-end service doesn’t communicate with a back-end service such as billing.

Network policies for Kubernetes Engine was implemented in close collaboration with our partner Tigera, the company that’s driving Project Calico.

With GA, the community has added the following additional features:

  • Test support for up to 2,000 Kubernetes Engine nodes 
  • Support for the latest network policies API, currently at Kubernetes 1.9 
  • Calico version 2.6.7, which implements the network policies feature 
  • Calico Kubernetes Engine images on Google Container Registry 
What’s next for Kubernetes network policies?

  • Upgrading to Calico 3.0. For the purposes of this release, we adopted Calico 2.6, but will move to Calico 3.0 soon, giving you the ability to apply Calico network policies and extend base Kubernetes policies with advanced capabilities.
  • Application Layer Policy, which integrates with Istio to enable enforcement of security rules at multiple layers in the stack, and extend the existing network policies definition with layer 5-7 rules, for fine-grained control of application connectivity. Tigera recently shared a tech preview of this Calico feature, and we’re excited to see how Kubernetes Engine users will adopt this additional capability.

The pace of Kubernetes development comes fast and furious, particularly in the area of network security. To learn how to get started with and make the most of network policies in Kubernetes, check out this recent blog post by Google developer experience engineer Ahmet Alp Balkan, then try out network policies for yourself.

If you haven’t tried GCP and Kubernetes Engine before, you can quickly get started with our $300 free credits.

Introducing the ability to connect to Cloud Shell from any terminal


If you develop or administer apps running on Google Cloud Platform (GCP), you’re probably familiar with Cloud Shell, an on-demand interactive shell environment that contains a wide variety of pre-installed developer tools. Up until now, you could only access Cloud Shell from your browser. Today, we're introducing the ability to connect to Cloud Shell directly from your terminal using the gcloud command-line tool.

Starting an SSH session is a single command:

erik@localhost:~$ ls
Desktop
erik@localhost:~$ gcloud alpha cloud-shell ssh
Welcome to Cloud Shell! Type "help" to get started.
erik@cloudshell:~$ ls
server.py  README-cloudshell.txt

You can also use gcloud to copy files between your Cloud Shell and your local machine:

erik@localhost:~$ gcloud alpha cloud-shell scp cloudshell:~/data.txt localhost:~
data.txt                                           100% 1897    28.6KB/s   00:00
erik@localhost:~$
If you're using Mac or Linux, you can even mount your Cloud Shell home directory onto your local file system after installing sshfs. This allows you to edit the files in your Cloud Shell home directory using whatever local tools you want! All the data in your remotely mounted file system is stored on a Persistent Disk, so it's fast, strongly consistent and retained across sessions and regions.

erik@localhost:~$ gcloud alpha cloud-shell get-mount-command ~/my-cloud-shell
sshfs [email protected]: /home/ekuefler/my-cloud-shell -p 6000 -oIdentityFile=/home/ekuefler/.ssh/google_compute_engine
erik@localhost:~$ sshfs [email protected]: /home/ekuefler/my-cloud-shell -p 6000 -oIdentityFile=/home/ekuefler/.ssh/google_compute_engine
erik@localhost:~$ cd my-cloud-shell
erik@localhost:~$ ls
server.py  README-cloudshell.txt
erik@localhost:~$ vscode server.py

We're sure you'll find plenty of uses for these features, but here are a few to get you started:
  • Use it as a playground — take advantage of the tools and language runtimes installed in Cloud Shell to do quick experiments without having to install software on your machine.
  • Use it as a sandbox — install or run untrusted programs in Cloud Shell without the risk of them damaging your local machine or reading your data, or to avoid polluting your machine with programs you rarely need to run.
  • Use it as a portable development environment — store your files in your Cloud Shell home directory and edit them using your favorite IDEs when you're at your desk, then keep working on the same files later from a Chromebook using the web terminal and editor.
The full documentation for the command-line interface is available here. The cloud-shell command group is currently in alpha, so we're still making changes to it and welcome your feedback and suggestions via the feedback link at the bottom of the documentation page.

Introducing Skaffold: Easy and repeatable Kubernetes development


As companies on-board to Kubernetes, one of their goals is to provide developers with an iteration and deployment experience that closely mirrors production. To help companies achieve this goal, we recently announced Skaffold, a command line tool that facilitates continuous development for Kubernetes applications. With Skaffold, developers can iterate on application source code locally while having it continually updated and ready for validation or testing in their local or remote Kubernetes clusters. Having the development workflow automated saves time in development and increases the quality of the application through its journey to production.

Kubernetes provides operators with APIs and methodologies that increase their agility and facilitates reliable deployment of their software. Kubernetes takes bespoke deployment methodologies and provides programmatic ways to achieve similar if not more robust procedures. Kubernetes’ functionality helps operations teams apply common best practices like infrastructure as code, unified logging, immutable infrastructure and safer API-driven deployment strategies like canary and blue/green. Operators can now focus on the parts of infrastructure management that are most critical to their organizations, supporting high release velocity with a minimum of risk to their services.

But in some cases, developers are the last people in an organization to be introduced to Kubernetes, even as operations teams are well versed in the benefits of its deployment methodologies. Developers may have already taken steps to create reproducible packaging for their applications with Linux containers, like Docker. Docker allows them to produce repeatable runtime environments where they can define the dependencies and configuration of their applications in a simple and repeatable way. This allows developers to stay in sync with their development runtimes across the team, however, it doesn’t introduce a common deployment and validation methodology. For that, developers will want to use the Kubernetes APIs and methodologies that are used in production to create a similar integration and manual testing environment.

Once developers have figured out how Kubernetes works, they need to actuate Kubernetes APIs to accomplish their tasks. In this process they'll need to:
  1. Find or deploy a Kubernetes cluster 
  2. Build and upload their Docker images to a registry that's enabled in their cluster 
  3. Use the reference documentation and examples to create their first Kubernetes manifest definitions 
  4. Use the kubectl CLI or Kubernetes Dashboard to deploy their application definitions 
  5. Repeat steps 2-4 until their feature, bug fix or changeset is complete 
  6. Check in their changes and run them through a CI process that includes:
    • Unit testing
    • Integration testing
    • Deployment to a test or staging environment

Steps 2 through 5 require developers to use many tools via multiple interfaces to update their applications. Most of these steps are undifferentiated for developers and can be automated, or at the very least guided by a set of tools that are tailored to a developer’s experience.

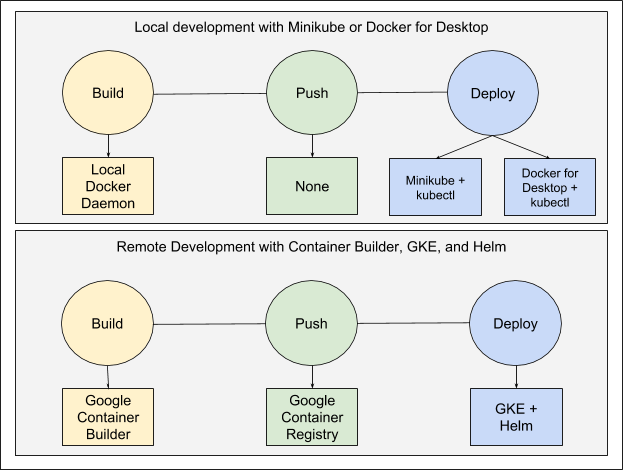
Enter Skaffold, which automates the workflow for building, pushing and deploying applications. Developers can start Skaffold in the background while they're developing their code, and have it continually update their application without any input or additional commands. It can also be used in an automated context such as a CI/CD pipeline to leverage the same workflow and tooling when moving applications to production.

Skaffold features


Skaffold is an early phase open-source project that includes the following design considerations and capabilities:
  • No server-side components mean no overhead to your cluster. 
  • Allows you to detect changes in your source code and automatically build/push/deploy. 
  • Image tag management. Stop worrying about updating the image tags in Kubernetes manifests to push out changes during development. 
  • Supports existing tooling and workflows. Build and deploy APIs make each implementation composable to support many different workflows. 
  • Support for multiple application components. Build and deploy only the pieces of your stack that have changed. 
  • Deploy regularly when saving files or run one off deployments using the same configuration.

Pluggability


Skaffold has a pluggable architecture that allows you to choose the tools in the developer workflow that work best for you.
Get started with Skaffold on Kubernetes Engine by following the Getting Started guide or use Minikube by following the instructions in the README. For discussion and feedback join the mailing list or open an issue on GitHub.

If you haven’t tried GCP and Kubernetes Engine before, you can quickly get started with our $300 free credits.

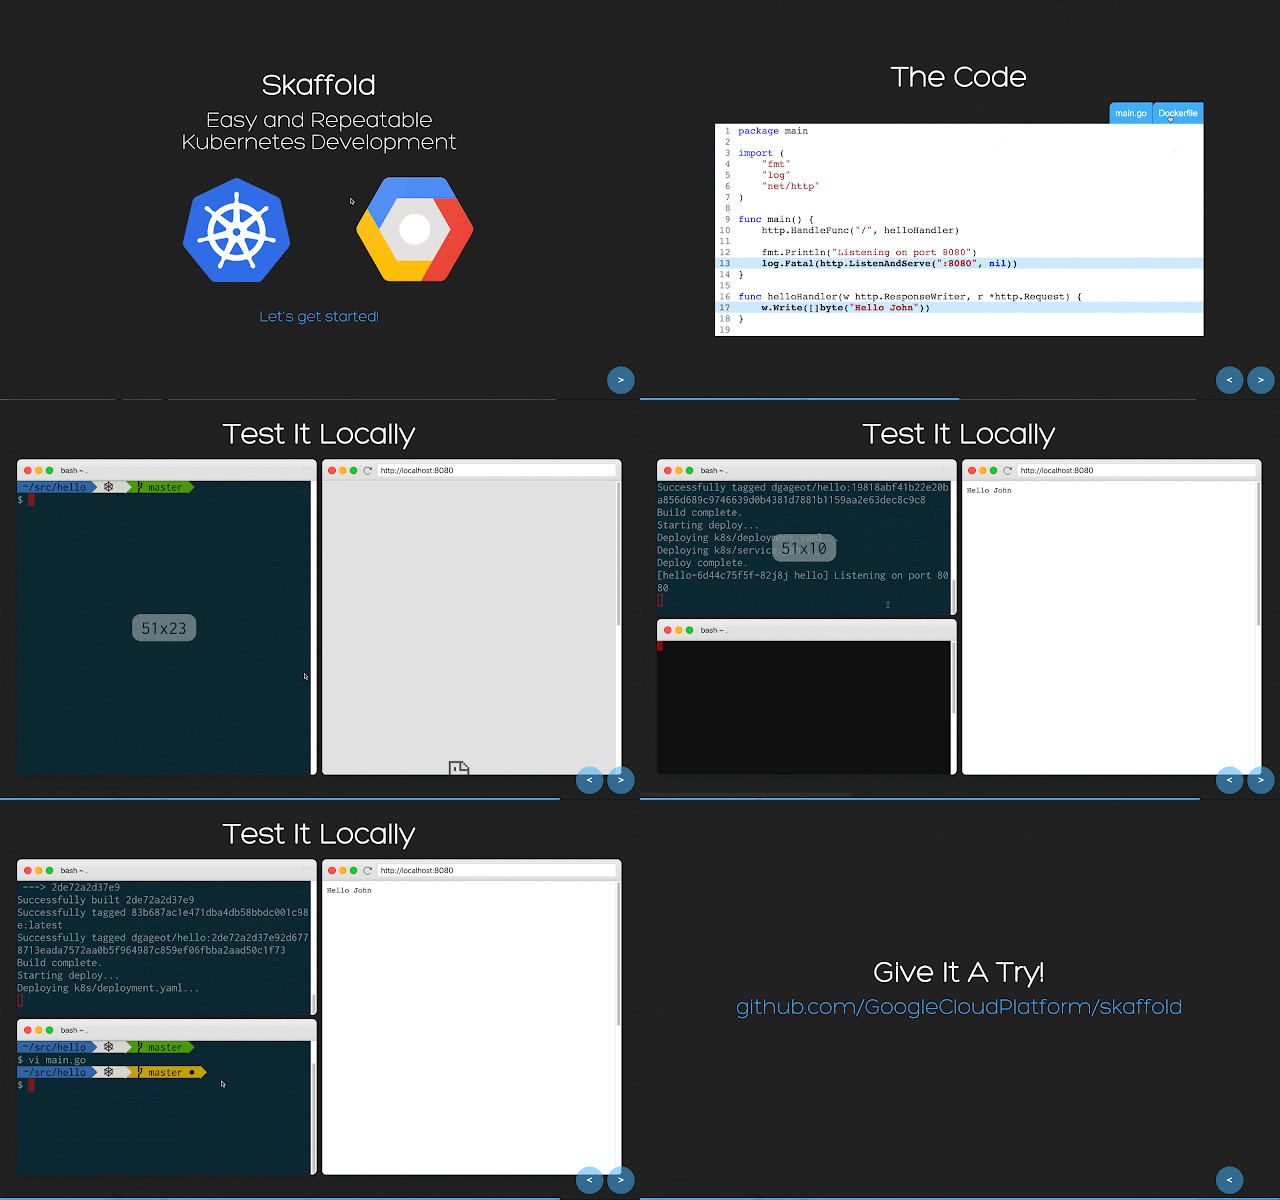
Demo


8 DevOps tools that smoothed our migration from AWS to GCP: Tamr


Editor’s note: If you recently migrated from one cloud provider to another—or are thinking about making the move—you understand the value of avoiding vendor lock-in by using third-party tools. Tamr, a data unification provider, recently made the switch from AWS to Google Cloud Platform, bringing with them a variety of DevOps tools to help with the migration and day-to-day operations. Check out their recommendations for everything from configuration management to storage to user management.

Here at Tamr, we recently migrated from AWS to Google Cloud Platform (GCP), for a wide variety of reasons, including more consistent compute performance, cheaper machines, preemptible machines and better committed usage stories, to name a few. The larger story of our migration itself is worth its own blog post, which will be coming in the future, but today, we’d like to walk through the tools that we used internally that allowed us to make the switch in the first place. Because of these tools, we migrated with no downtime and were able to re-use almost all of the automation/management code we’d developed internally over the past couple of years.

We attribute a big part of our success to having been a DevOps shop for the past few years. When we first built out our DevOps department, we knew that we needed to be as flexible as possible. From day one, we had a set of goals that would drive our decisions as a team, and which technologies we would use. Those goals have proved themselves as they have held up over time, and more recently allowed us to seamlessly migrate our platform from AWS to GCP and Google Compute Engine.

Here were our goals. Some you’ll recognize as common DevOps mantras, others were more specific to our organization:

  • Automate everything, and its corollary, "everything is code"
  • Treat servers as cattle, not pets
  • Scale our devops team sublinearly in relation to the number of servers and services we support 
  • Don’t be tied into one vendor/cloud ecosystem. Flexibility matters, as we also ship our entire stack and install it on-prem at our customers sites
Our first goal was well defined and simple. We wanted all operation tasks to be fully automated. Full stop. Though we would have to build our own tooling in some cases, for the most part there's a very rich set of open source tools out there that can solve 95% of our automation problems with very little effort. And by defining everything as code, we could easily review each change and version everything in git.

Treating servers as cattle, not pets is core to the DevOps philosophy. Server "pets" have names like postgres-master, and require you to maintain them by hand. That is, you run commands on it via a shell and upgrade settings and packages yourself. Instead, we wanted to focus on primitives like the amount of cores and RAM that our services need to run. We also wanted to kill any server in the cluster at any time without having to notify anyone. This makes doing maintenance much easier and streamlined, as we would be able to do rolling restarts of every server in our fleet. It also ties into our first goal of automating everything.

We also wanted to keep our DevOps team in check. We knew from the get-go that to be successful, we would be running our platform across large fleets of servers. Doing things by hand requires us to hire and train a large number of operators just to run through set runbooks. By automating everything and investing in tooling we can scale the number of systems we maintain without having to hire as many people.

Finally, we didn’t want to get tied into one single vendor cloud ecosystem, for both business reasons—we deploy our stack at customer sites—and because we didn’t want to be held hostage by any one cloud provider. To avoid getting locked into a cloud’s proprietary services, we would have to run most things ourselves on our own set of servers. While you may choose to use equivalent services from their cloud provider, we like the independence of this go-it-alone approach.

Our DevOps toolbox


1. Server/Configuration management: Ansible 

Picking a configuration management system should be the very first thing you do when building out your DevOps toolbox, because you’ll be using it on every server that you have. For configuration management, we chose to use Ansible; it’s one of the simpler tools to get started with, and you can use it on just about any Linux machine.

You can use Ansible in many different ways: as a scripting language, as a parallel ssh client, and as a traditional configuration management tool. We opted to use it as a configuration management tool and set up our code base following Ansible best practices. In addition to the best practices layed out in the documentation, we went one step further and made all of our Ansible code fully idempotent—that is, we expect to be able to run Ansible at any time, and as long as everything is already up-to-date, for it to not have to make any changes. We also try and make sure that any package upgrades in Ansible have the correct handlers to ensure a zero downtime deployment.

We were able to use our entire Ansible code base in both the AWS and GCP environments without having to change any of our actual code. The only things that we needed to change were our dynamic inventory scripts, which are just Python scripts that Ansible executes to find the machines in your environment. Ansible playbooks allow you to use multiple of these dynamic inventory scripts simultaneously, allowing us to run Ansible across both clouds at once.

That said, Ansible might not be the right fit for everyone. It can be rather slow for some things and isn’t always ideal in an autoscaling environment, as it's a push-based system, not pull-based (like Puppet and Chef). Some alternatives to Ansible are the afore-mentioned Puppet and Chef, as well as Salt. They all solve the same general problem (automatic configuration of servers) but are optimized for specific use cases.

2. Infrastructure configuration: Terraform

When it comes to setting up infrastructure such as VPCs, DNS and load balancers, administrators sometimes set up cloud services by hand, then forget they are there, or how they configured them. (I’m guilty of this myself.) The story goes like this: we need a couple of machines to test an integration with a vendor. The vendor wants shell access to the machines to walk us through problems and requests an isolated environment. A month or two goes by and everything is running smoothly, and it’s time to set up a production environment based on the development environment. Do you remember what you did to set it up? What settings you customized? That is where infrastructure-as-code configuration tools can be a lifesaver.

Terraform allows you to codify the settings and infrastructure in your cloud environments using its domain specific language (DSL). It handles everything for you (cloud integrations, and ordering of operations for creating resources) and allows you to provision resources across multiple cloud platforms. For example, in Terraform, you can create DNS records in Google DNS that reference a resource in AWS. This allows you to easily link resources across multiple environments and provision complex networking environments as code. Most cloud providers have a tool for managing resources as code: AWS has CloudFormation, Google has Cloud Deployment Manager, and Openstack has Heat Orchestration Templates. Terraform effectively acts as a superset of all these tools and provides a universal format across all platforms.

3. Server imaging: Packer 

One of the basic building blocks of a cloud environment is a Virtual Machine (VM) image. In AWS, there’s a marketplace with AMI images for just about anything, but we often needed to install tools onto our servers beyond the basic services included in the AMI. For example, think Threatstack agents that monitor the activity on the server and scan packages on the server for CVEs. As a result, it was often easier to just build our own images. We also build custom images for our customers and need to share them into their various cloud accounts. These images need to be available to different regions, as do our own base images that we use internally as the basis for our VMs. Having a consistent way to build images independent of a specific cloud provider and a region is a huge benefit.

We use Packer, in conjunction with our Ansible code base, to build all of our images. Packer provides the framework to spin up machines, runs our Ansible code, then saves a copy of the snapshot of the machine into our account. Because Packer is integrated with configuration management tools, it allowed us to define everything in the AMIs as source code. This allows us to easily version images and have confidence that we know exactly what’s in our images. It made reproducing problems that customers had with our images trivial, and allowed us to easily generate changelogs for images.

The bigger benefit that we experienced was that when we switched to Compute Engine, we were able to reuse everything we had in AWS. All we needed to change was a couple of lines in Packer to tell it to use Compute Engine instead of AWS. We didn’t have to change anything to our base images that developers use day-to-day or the base images that we use in our compute clusters.

4. Containers: Docker

When we first started building out our infrastructure at Tamr, we knew that we wanted to use containers as I had used them at my previous company and seen how powerful and useful they can be at scale. Internally we have standardized on Docker as our primary container format. It allows us to build a single shippable artifact for a service that we can run on any Linux system. This gives us portability between Linux operating systems without significant effort. In fact, we’ve been able to Dockerize most of our system dependencies throughout the stack, to simplify bootstrapping from a vanilla Linux system.

5 and 6. Container and service orchestration: Mesos + Marathon

Containers in and of themselves don’t inherently provide scale or high availability on their own. Docker itself is just a piece of the puzzle. To fully leverage containers you need something to manage them and provide management hooks. This is where a container orchestration comes in. It allows you to link together your containers and use them to build up services in a consistent, fault-tolerant way.

For our stack we use Apache Mesos as the basis of our compute clusters. Mesos is basically a distributed kernel for scheduling tasks on servers. It acts as a broker for requests from frameworks to resources (cpu, memory, disk, gpus) available on machines in the Mesos cluster. One of the most common frameworks for Mesos is Marathon, which ships as part Mesosphere’s commercial DC/OS (Data Center Operating System), the main interface for launching tasks onto a Mesos cluster. Internally we deploy all of our services and dependencies on top of a custom Mesos cluster. We spent a fair amount of time building our own deployment/packaging tool on top of Marathon for shipping releases and handling deployments. (Down the road we hope to open source this tool, in addition to writing a few blog posts about it).

The Mesos + Marathon approach for hosting services is so flexible that during our migration from AWS to GCP, we were able to span our primary cluster across both clouds. As a result, we were able to slowly switch services running on the cluster from one cloud to another using Marathon constraints. As we were switching over, we simply spun up more Compute Engine machines and then deprecated machines on the AWS side. After a couple of days, all of our services were running on Compute Engine machines, and off of AWS.

However, if we were building our infrastructure from scratch today, we would heavily consider building on top of Kubernetes rather than Mesos. Kubernetes has come a long way since we started building out our infrastructure, but it just wasn’t ready at the time. I highly recommend Google Kubernetes Engine as a starting point for organizations starting to dip their toes into the container orchestration waters. Even though it's a managed service, the fact that it's based on open-source Kubernetes ensures minimized the risk of cloud lock-in.

7. User management: JumpCloud 

One of the first problems we dealt with in our AWS environment was how to provide ssh access to our servers to our development team. Before we automated server provisioning, developers often created a new root key every time they spun up an instance. We soon consolidated to one shared key. Then we upgraded to running an internal LDAP instance. As the organization grew, managing that LDAP server became a pain—we were definitely treating it as a pet. So we went looking for a hosted LDAP/Active Directory offering, which led us JumpCloud. After working with them, we ended up using their agent on our servers instead of an LDAP connector, even though they have a hosted LDAP endpoint that we do use for other things. The JumpCloud agent syncs with JumpCloud and provisions users and groups and ssh keys onto the server automatically for us. JumpCloud also provides a self-service portal for developers updating their ssh keys. This means that we now spend almost no time actually managing access to our servers; it’s all fully automated.

It’s worth noting that access to machines on Compute Engine is completely different than AWS. With GCP, users can use the gcloud command line interface (CLI) to gain access to a machine. The CLI generates a ssh key, and provisions it onto the server and creates a user account on the machine (for example, here's a sample command is `gcloud compute --project "gce-project" ssh --zone "us-east1-b" "my-machine-name"`). In addition, users can upload their ssh-keys/users pairs in the console and new machines will have those users accounts set up on launch of a machine. In other words, the problem of how to provide ssh access to developers that we ran into in on AWS doesn’t exist on Compute Engine.

JumpCloud solved a specific problem with AWS, but provides a portable solution across both GCP and AWS. Using it with GCP works great, however if you're 100% on GCP, you don’t need to rely on an additional external service such as JumpCloud to manage your users.

8. Storage: RexRay 

Given that we run a large amount of services on top of a Mesos cluster we needed a way to provide persistent storage to Docker containers running there. Since we treat servers as cattle not pets (we expect to be able to kill any one server at any time), using Mesos local persistent storage wasn’t an option for us. We ended up using RexRay as an interface for provisioning/mounting disks into containers. RexRay acts as the bridge on a server between disks and a remote storage provider. Its main interface is a Docker storage driver plugin that can make API calls to a wide variety of sources (AWS, GCP, EMC, Digital Ocean and many more) and mount the provisioned storage into a Docker container. In our case, we were using EBS volumes on AWS and persistent disks on Compute Engine. Because RexRay is implemented as a Docker plugin, the only thing we had to change between the environments was the config file with the Compute Engine vs. AWS settings. We didn’t have to change any of our upstream invocations for disk resources.


DevOps = Freedom 


From the viewpoint of our DevOps team, these tools enabled a smooth migration, without much manual effort. Most things only required updating a couple of config files to be able to talk to Compute Engine APIs. At the top layers in our stack that our developers use, we were able to switch to Compute Engine with no development workflow changes, and zero downtime. Going forward, we see being able to span across and between clouds at will as a competitive advantage, and this would not be possible without the investment we made into our tooling.

Love our list of essential DevOps tools? Hate it? Leave us a note in the comments—we’d love to hear from you. To learn more about Tamr and our data unification service, visit our website.

GCP grows in the Netherlands region


When we launched the Netherlands region earlier this year, we said the third zone would be along shortly. We opened up the region with two zones as soon as we could to fulfill the growing demand from our customers in Benelux. Now, we’re happy to announce the launch of a third zone (europe-west4-a) in the region. This is the 45th GCP zone globally and now, like other GCP regions, this third zone enables developers to build highly available services that meet the needs of their business.

Services


The third zone includes all standard GCP services and we’re announcing the availability of the following new services in the region: Cloud Spanner, Cloud Bigtable, Managed Instance Groups, and Cloud SQL.

Partners in Benelux


We’ve got partners in Benelux ready to assist customers with design, deployment, migration and maintenance needs. Partners include: Rackspace, Xebia, ML6, PWC, Accenture, incentro, qlouder, fourcast, godatadriven and g-company.

As an official training partner, g-company is dedicated to helping companies organize their processes more intelligently by offering highly interactive Google Cloud Platform (GCP) training and supporting companies as they build tailor-made applications on GCP to transform their businesses. g-company led the implementation of the Netherlands-based online travel company, Travix, in a company-wide migration to Google Cloud.

Resources


For the latest on availability of services from this region as well as additional regions and services, visit our locations page. For guidance on how to build and create highly available applications, take a look at our zones and regions page. Watch this webinar to learn more about how we bring GCP closer to you. Give us a shout to request early access to new regions and help us prioritize what we build next.

We’re excited to see what you’ll build next on GCP!

Best practices for working with Google Cloud Audit Logging


As an auditor, you probably spend a lot of time reviewing logs. Google Cloud Audit Logging is an integral part of the Google Stackdriver suite of products, and understanding how it works and how to use it is a key skill you need to implement an auditing approach for systems deployed on Google Cloud Platform (GCP). In this post, we’ll discuss the key functionality of Cloud Audit Logging and call out some best practices.

The first thing to know about Cloud Audit Logging is that each project consists of two log streams: admin activity and data access. GCP services generate these logs to help you answer the question of "who did what, where, and when?" within your GCP projects. Further, these logs are distinct from your application logs.

Admin activity logs contain log entries for API calls or other administrative actions that modify the configuration or metadata of resources. Admin activity logs are always enabled. There's no charge for admin activity audit logs, and they're retained for 13 months/400 days.

Data access logs, on the other hand, record API calls that create, modify or read user-provided data. Data access audit logs are disabled by default because they can grow to be quite large.

For your reference, here’s the full list of GCP services that produce audit logs.


Configure and view audit logs


Getting started with Cloud Audit Logging is simple. Some services are on by default, and others are just a few clicks away from being operational. Here’s how to set up, configure and use various Cloud Audit Logging capabilities.

Configuring audit log collection 

Admin activity logs are enabled by default; you don’t need to do anything to start collecting them. With the exception of BigQuery, however, data Access audit logs are disabled by default. Follow the guidance detailed in Configuring Data Access Logs to enable them.

One best practice for data access logs is to use a test project to validate the configuration for your data access audit collection before you propagate it to developer and production projects. If you configure your IAM controls incorrectly, your projects may become inaccessible.

Viewing audit logs 

You can view audit logs from two places in the GCP Console: via the activity feed, which provides summary entries, and via the Stackdriver Logs viewer page, which gives full entries.

Permissions

You should consider access to audit log data as sensitive and configure appropriate access controls. You can do this by using IAM roles to apply access controls to logs.

To view logs, you need to grant the IAM role logging.viewer (Logs Viewer) for the admin activity logs, and logging.privateLogViewer (Private Logs viewer) for the data access logs.

When configuring roles for Cloud Audit Logging, this how to guide describes some typical scenarios and provides guidance on configuring IAM policies that address the need to control access to audit logs. One best practice is to ensure that you’ve applied the appropriate IAM controls, to restrict who can access the audit logs.

Viewing the activity feed

You can see a high-level overview of all your audit logs on the Cloud Console Activity page. Click on any entry to display a detailed view of that event, as shown below.

By default, this feed does not display data access logs. To enable them, go to the Filter configuration panel and select the “Data Access” field under Categories. (Please note, you also need to have the Private Logs Viewer IAM permission in order to see data access logs).

Viewing audit logs via the Stackdriver Logs viewer 

You can view detailed log entries from the audit logs in the Stackdriver Logs Viewer. With Logs Viewer, you can filter or perform free text search on the logs, as well as select logs by resource type and log name (“activity” for the admin activity logs and “data_access” for the data access logs).

The example below displays some log entries in their JSON format, and highlights a few important fields.

Filtering Audit Logs 

Stackdriver provides both basic and advanced logs filters. Basic log filters allows you to filter the results displayed in the feed by user, resource type and date/time.

An advanced logs filter is a Boolean expression that specifies a subset of all the log entries in your project. You can use to it choose the log entries:
  • from specific logs or log services 
  • within a given time range
  • that satisfy conditions on metadata or user-defined fields 
  • that represent a sampling percentage of all log entries 
The following filter shows a filter on all calls made to the Cloud IAM API that calls the SetIamPolicy method.

resource.type="project"
logName="projects/a-project-id-here/logs/cloudaudit.googleapis.com%2Factivity"
protoPayload.methodName="SetIamPolicy"

Below is a snippet of the log entry that shows that the SetIamPolicy call was made to grant the BigQuery dataviewer IAM role to Alice.

resourceName: "projects/a-project-id-here"  
 response: {
  @type: "type.googleapis.com/google.iam.v1.Policy"   
  bindings: [
   0: {
    members: [
     0: "user:[email protected]"      
    ]
    role: "roles/bigquery.dataViewer"     
   }

Exporting logs

Log entries are held in Stackdriver Logging for a limited time known as the retention period. After that, the entries are deleted. To keep log entries longer, you need to export them outside of Stackdriver Logging by configuring log sinks.

A sink includes a destination and a filter that selects the log entries to export, and consists of the following properties:
  • Sink identifier: A name for the sink 
  • Parent resource: The resource in which you create the sink. This can be a project, folder, billing account, or an organization 
  • Logs filter: Selects which log entries to export through this sink, giving you the flexibility to export all logs or specific logs 
  • Destination: A single place to send the log entries matching your filter. Stackdriver Logging supports three destinations: Google Cloud Storage buckets, BigQuery datasets, and Cloud Pub/Sub topics. 
  • Writer identity: A service account that has been granted permissions to write to the destination.
You need to configure log sinks before you can receive any logs, and you can’t retroactively export logs that were written before the sink was created.

Another feature for working with logs is Aggregated Exports, which allows you to set up a sink at the Cloud IAM organization or folder level, and export logs from all the projects inside the organization or folder. For example, the following gcloud command sends all admin activity logs from your entire organization to a single BigQuery sink:

gcloud logging sinks create my-bq-sink 
bigquery.googleapis.com/projects/my-project/datasets/my_dataset 
--log-filter='logName: "logs/cloudaudit.googleapis.com%2Factivity"' 
--organization=1234 --include-children

Be aware that an aggregated export sink sometimes exports very large numbers of log entries. When designing your aggregated export sink to export the data you need to store, here are some best practices to keep in mind:

  • Ensure that logs are exported for longer term retention 
  • Ensure that appropriate IAM controls are set against the export sink destination 
  • Design aggregated exports for your organization to filter and export the data that will be useful for future analysis 
  • Configure log sinks before you start receiving logs 
  • Follow the best practices for common logging export scenarios 

Managing exclusions


Stackdriver Logging provides exclusion filters to let you completely exclude certain log messages for a specific product or messages that match a certain query. You can also choose to sample certain messages so that only a percentage of the messages appear in Stackdriver Logs Viewer. Excluded log entries do not count against the Stackdriver Logging logs allotment provided to projects.

It’s also possible to export log entries before they're excluded. For more information, see Exporting Logs. Excluding this noise will not only make it easier to review the logs but will also allow you to minimize any charges for logs over your monthly allotment.

Best practices:

  • Ensure you're using exclusion filters to exclude logging data that will not be useful. For example, you shouldn’t need to log data access logs in development projects. Storing data access logs is a paid service (see our log allotment and coverage charges), so recording superfluous data incurs unnecessary overhead


Cloud Audit Logging best practices, recapped

Cloud Audit Logging is a powerful tool that can help you manage and troubleshoot your GCP environment, as well as demonstrate compliance. As you start to set up your logging environment, here are some best practices to keep in mind:

  • Use a test project to validate the configuration of your data-access audit collection before propagating to developer and production projects 
  • Be sure you’ve applied appropriate IAM controls to restrict who can access the audit logs 
  • Determine whether you need to export logs for longer-term retention 
  • Set appropriate IAM controls against the export sink destination 
  • Design aggregated exports on which your organization can filter and export the data for future analysis 
  • Configure log sinks before you start receiving logs 
  • Follow the best practices for common logging export scenarios 
  • Make sure to use exclusion filters to exclude logging data that isn’t useful.

We hope you find these best practices helpful when setting up your audit logging configuration. Please leave a comment if you have any best practice tips of your own.

Automatic serverless deployments with Cloud Source Repositories and Container Builder


There are many reasons to automate your deployments: consistency, safety, and timeliness. These increase in value as your software becomes more critical to your business. In this post, I'll demonstrate how easy it is to start automating deployments with Google Cloud Platform (GCP) tools, and refer you to additional resources to help make your deployment process more robust.

Suppose you have a Google Cloud Functions, Firebase or Google App Engine application. Today, you probably deploy your function or app via gcloud commands from your local workstation. Let's look at a lightweight workflow that takes advantage of two Google Cloud products: Cloud Source Repositories and Cloud Container Builder.
This simple pipeline uses build triggers in Cloud Container Builder to deploy a function to Cloud Functions when source code is pushed to a "prod" branch.

The first step is to get your code under revision control. If you're already using a provider like GitHub or Bitbucket, it's trivial to mirror your code to a Cloud Source Repository. Cloud Source Repositories is offered at no charge for up to five project-users, so it's perfect for small teams.

Commands for the command-line are captured below, but you can find more detailed guides in the documentation.

Create and clone your repository:

$ gcloud source repos create my-function
Created [my-function].

$ gcloud source repos clone my-function
Cloning into 'my-function'...

Now, create a simple function (include a package.json if you have third-party dependencies):

index.js
exports.f = function(req, res) {
  res.send("hello, gcf!");
};

Then, create a Container Builder build definition:

deploy.yaml
steps:
- name: gcr.io/cloud-builders/gcloud
  args:
  - beta
  - functions
  - deploy
  - --trigger-http
  - --source=.
  - --entry-point=f
  - hello-gcf # Function name

This is equivalent to running the command:

gcloud beta functions deploy --trigger-http --source=. --entry-point=f hello-gcf

Before you start your first build, set up your project for Container Builder. First, enable two APIs: Container Builder API and Cloud Functions API. To allow Container Builder to deploy, you need to give it access to your project. The build process uses the credentials of a service account associated with those builds. The address for that service account is {numerical-project-id}@cloudbuild.gserviceaccount.com. You'll need to add an IAM role to that service account: Project Editor. If you use this process to deploy other resources, you might need to add other IAM roles.

Now, test your deployment configuration and permissions by running:

gcloud container builds submit --config deploy.yaml .

Your function is now being deployed via Cloud Container Builder.

Creating a build trigger is easy: choose your repository, the trigger condition (in this case, pushing to the "prod" branch), and the build to run (in this case, the build specified in "deploy.yaml").
Now, update the "prod" branch, bring it up-to-date with "master", push it to Cloud Source Repositories, and your function will be deployed!

$ git checkout prod
$ git pull origin prod
$ git merge master
$ git push origin prod

If the deployment failed, it will show up as a failed build in the build history screen. Check the logs to investigate what went wrong. You can also configure e-mail or other notifications using Pub/Sub and Cloud Functions.

This is a simplified deployment pipeline—just enough to demonstrate the power of deployment automation. At some point, you'll probably find that this process doesn't meet your needs. For example, you might want to get a manual approval before you update production. If that happens, check out Spinnaker, an open-source deployment automation system that can handle more complex workflows.

And that’s just the beginning! As you get further down the road toward automating your deployments, here are some other tools and techniques for you to try:
We hope this gets you excited about automating your software deployments. Let us know what you think of this guide—we’d love to hear from you.

Introducing Agones: Open-source, multiplayer, dedicated game-server hosting built on Kubernetes


In the world of distributed systems, hosting and scaling dedicated game servers for online, multiplayer games presents some unique challenges. And while the game development industry has created a myriad of proprietary solutions, Kubernetes has emerged as the de facto open-source, common standard for building complex workloads and distributed systems across multiple clouds and bare metal servers. So today, we’re excited to announce Agones (Greek for "contest" or "gathering"), a new open-source project that uses Kubernetes to host and scale dedicated game servers.

Currently under development in collaboration with interactive gaming giant Ubisoft, Agones is designed as a batteries-included, open-source, dedicated game server hosting and scaling project built on top of Kubernetes, with the flexibility you need to tailor it to the needs of your multiplayer game.

The nature of dedicated game servers


It’s no surprise that game server scaling is usually done by proprietary software—most orchestration and scaling systems simply aren’t built for this kind of workload.

Many of the popular fast-paced online multiplayer games such as competitive FPSs, MMOs and MOBAs require a dedicated game server—a full simulation of the game world—for players to connect to as they play within it. This dedicated game server is usually hosted somewhere on the internet to facilitate synchronizing the state of the game between players, but also to be the arbiter of truth for each client playing the game, which also has the benefit of safeguarding against players cheating.

Dedicated game servers are stateful applications that retain the full game simulation in memory. But unlike other stateful applications, such as databases, they have a short lifetime. Rather than running for months or years, a dedicated game server runs for a few minutes or hours.

Dedicated game servers also need a direct connection to a running game server process’ hosting IP and port, rather than relying on load balancers. These fast-paced games are extremely sensitive to latency, which a load balancer only adds more of. Also, because all the players connected to a single game server share the in-memory game simulation state at the same time, it’s just easier to connect them to the same machine.

Here’s an example of a typical dedicated game server setup:


  1. Players connect to some kind of matchmaker service, which groups them (often by skill level) to play a match. 
  2. Once players are matched for a game session, the matchmaker tells a game server manager to provide a dedicated game server process on a cluster of machines.
  3. The game server manager creates a new instance of a dedicated game server process that runs on one of the machines in the cluster. 
  4. The game server manager determines the IP address and the port that the dedicated game server process is running on, and passes that back to the matchmaker service.
  5. The matchmaker service passes the IP and port back to the players’ clients.
  6. The players connect directly to the dedicated game server process and play the multiplayer game against one another. 

Building Agones on Kubernetes and open-source 

Agones replaces the bespoke cluster management and game server scaling solution we discussed above, with a Kubernetes cluster that includes a custom Kubernetes Controller and matching GameServer Custom Resource Definitions.
With Agones, Kubernetes gets native abilities to create, run, manage and scale dedicated game server processes within Kubernetes clusters using standard Kubernetes tooling and APIs. This model also allows any matchmaker to interact directly with Agones via the Kubernetes API to provision a dedicated a game server.

Building Agones on top of Kubernetes has lots of other advantages too: it allows you to run your game workloads wherever it makes the most sense, for example, on game developers’ machines via platforms like minikube, in-studio clusters for group development, on-premises machines and on hybrid-cloud or full-cloud environments, including Google Kubernetes Engine.

Kubernetes also simplifies operations. Multiplayer games are never just dedicated game servers—there are always supporting services, account management, inventory, marketplaces etc. Having Kubernetes as a single platform that can run both your supporting services as well as your dedicated game servers drastically reduces the required operational knowledge and complexity for the supporting development team.

Finally, the people behind Agones aren’t just one group of people building a game server platform in isolation. Agones, and the developers that use it, leverages the work of hundreds of Kubernetes contributors and the diverse ecosystem of tools that have been built around the Kubernetes platform.

Founding contributor to the Agones project, Ubisoft brought their deep knowledge and expertise in running top-tier, AAA multiplayer games for a global audience.
“Our goal is to continually find new ways to provide the highest-quality, most seamless services to our players so that they can focus on their games. Agones helps by providing us with the flexibility to run dedicated game servers in optimal datacenters, and by giving our teams more control over the resources they need. This collaboration makes it possible to combine Google Cloud’s expertise in deploying Kubernetes at scale with our deep knowledge of game development pipelines and technologies.”  
Carl Dionne, Development Director, Online Technology Group, Ubisoft. 


Getting started with Agones 


Since Agones is built with Kubernetes’ native extensions, you can use all the standard Kubernetes tooling to interact with it, including kubectl and the Kubernetes API.

Creating a GameServer 

Authoring a dedicated game server to be deployed on Kubernetes is similar to developing a more traditional Kubernetes workload. For example, the dedicated game server is simply built into a container image like so:

Dockerfile
FROM debian:stretch
RUN useradd -m server

COPY ./bin/game-server /home/server/game-server
RUN chown -R server /home/server && \
    chmod o+x /home/server/game-server

USER server
ENTRYPOINT ["/home/server/game-server"]

By installing Agones into Kubernetes, you can add a GameServer resource to Kubernetes, with all the configuration options that also exist for a Kubernetes Pod.

gameserver.yaml
apiVersion: "stable.agon.io/v1alpha1"
kind: GameServer
metadata:
  name: my-game-server
spec:
  containerPort: 7654
  # Pod template
  template:
    spec:
      containers:
      - name: my-game-server-container
        image: gcr.io/agon-images/my-game-server:0.1

You can then apply it through the kubectl command or through the Kubernetes API:

$ kubectl apply -f gamesever.yaml
gameserver "my-game-server" created

Agones manages starting the game server process defined in the yaml, assigning it a public port, and retrieving the IP and port so that players can connect to it. It also tracks the lifecycle and health of the configured GameServer through an SDK that's integrated into the game server process code.

You can query Kubernetes to get details about the GameServer, including its State, and the IP and port that player game clients can connect to, either through kubectl or the Kubernetes API:

$ kubectl describe gameserver my-game-server
Name:         my-game-server
Namespace:    default
Labels:       
Annotations:  
API Version:  stable.agones.dev/v1alpha1
Kind:         GameServer
Metadata:
  Cluster Name:
  Creation Timestamp:  2018-02-09T05:02:18Z
  Finalizers:
    stable.agones.dev
  Generation:        0
  Initializers:      
  Resource Version:  13422
  Self Link:         /apis/stable.agones.dev/v1alpha1/namespaces/default/gameservers/my-game-server
  UID:               6760e87c-0d56-11e8-8f17-0800273d63f2
Spec:
  Port Policy:     dynamic
  Container:       my-game-server-container
  Container Port:  7654
  Health:
    Failure Threshold:      3
    Initial Delay Seconds:  5
    Period Seconds:         5
  Host Port:                7884
  Protocol:                 UDP
  Template:
    Metadata:
      Creation Timestamp:  
    Spec:
      Containers:
        Image:  gcr.io/agones-images/my-game-server:0.1
        Name:   my-game-server-container
        Resources:
Status:
  Address:    192.168.99.100
  Node Name:  agones
  Port:       7884
  State:      Ready
Events:
  Type    Reason    Age   From                   Message
  ----    ------    ----  ----                   -------
  Normal  PortAllocation  3s    gameserver-controller  Port allocated
  Normal  Creating        3s    gameserver-controller  Pod my-game-server-q98sz created
  Normal  Starting        3s    gameserver-controller  Synced
  Normal  Ready           1s    gameserver-controller  Address and Port populated

What’s next for Agones


Agones is still in very early stages, but we’re very excited about its future! We’re already working on new features like game server Fleets, planning a v0.2 release and working on a roadmap that includes support for Windows, game server statistic collection and display, node autoscaling and more.

If you would like to try out a v0.1 alpha release of Agones, you can install it directly on a Kubernetes cluster such as GKE or minikube and take it for a spin. We have a great installation guide that will take you through getting setup!

And we would love your help! There are multiple ways to get involved:

Thanks to everyone has been involved in the project so far across Google Cloud Platform and Ubisoft, we're very excited for the future of Agones!

Announcing new Stackdriver pricing — visibility for less


Today we're introducing simplified pricing for Stackdriver Monitoring and Logging, and bringing advanced functionality that was limited to a premium pricing tier to all Stackdriver users.

Starting June 30, 2018, you get the advanced alerting and notification options you need to monitor your cloud applications, as well as the flexibility to create monitoring dashboards and alerting policies—without having to opt-in to premium pricing.

Stackdriver Monitoring


Stackdriver Monitoring provides visibility into the performance, uptime and overall health of cloud-powered applications. A hybrid service, Stackdriver Monitoring integrates with GCP, AWS and a variety of common application components.

Highlights of the new Stackdriver Monitoring pricing model include:

  • Flexible pay-as-you-go pricing model that optimizes your spend—pay only for the monitoring data you send, not by the number of resources you have in your projects.
  • Permanent free allocation replaces free trials — all GCP metrics and the first 150 MB of non-GCP metrics per month are available at no cost. 
  • Automatic volume-based discounts — for non-GCP metrics including agent metrics, AWS metrics, logs based metrics, and custom metrics, this volume-based pricing of $.258 down to $.061 per MB ingested represents an up to 80% discount over previously announced prices.


Stackdriver Logging


The key to a well-managed application is to retain meaningful quantities of logging data. Stackdriver Logging allows you to store, search, analyze, monitor and alert on log data and events from GCP, AWS, or ingest custom log data from any source. Beginning today, we’re increasing the retention of logs from seven days to 30 days for all users regardless of tier. In addition, we’re delaying enforcement of log pricing until June 30 from our previously announced date of March 31.

The pricing model for logs is:

  • 50 GB per month free allocation of logs ingested
  • Logs over the free allocation are billed based on volume ingested at $.50 per GB
  • Stackdriver Monitoring and Logging are priced independently


In order to help you control costs, we also provide exclusion filters that enable you to pay only for the logs you want to keep—or even to turn off log ingestion to Stackdriver completely while still allowing logs to be exported to GCS, PubSub or BigQuery.

Here at Google Cloud, we believe that monitoring, logging and performance management are the foundation of any well-managed application—in our cloud, on another cloud, or on-premises. We hope that this new pricing model will enable you to use the Stackdriver family of tools widely and freely. Thank you for your continued feedback—it helps us make our products better. To learn more about Stackdriver, check out our documentation or join in the conversation in our discussion group.

Introducing GCP’s new interactive CLI


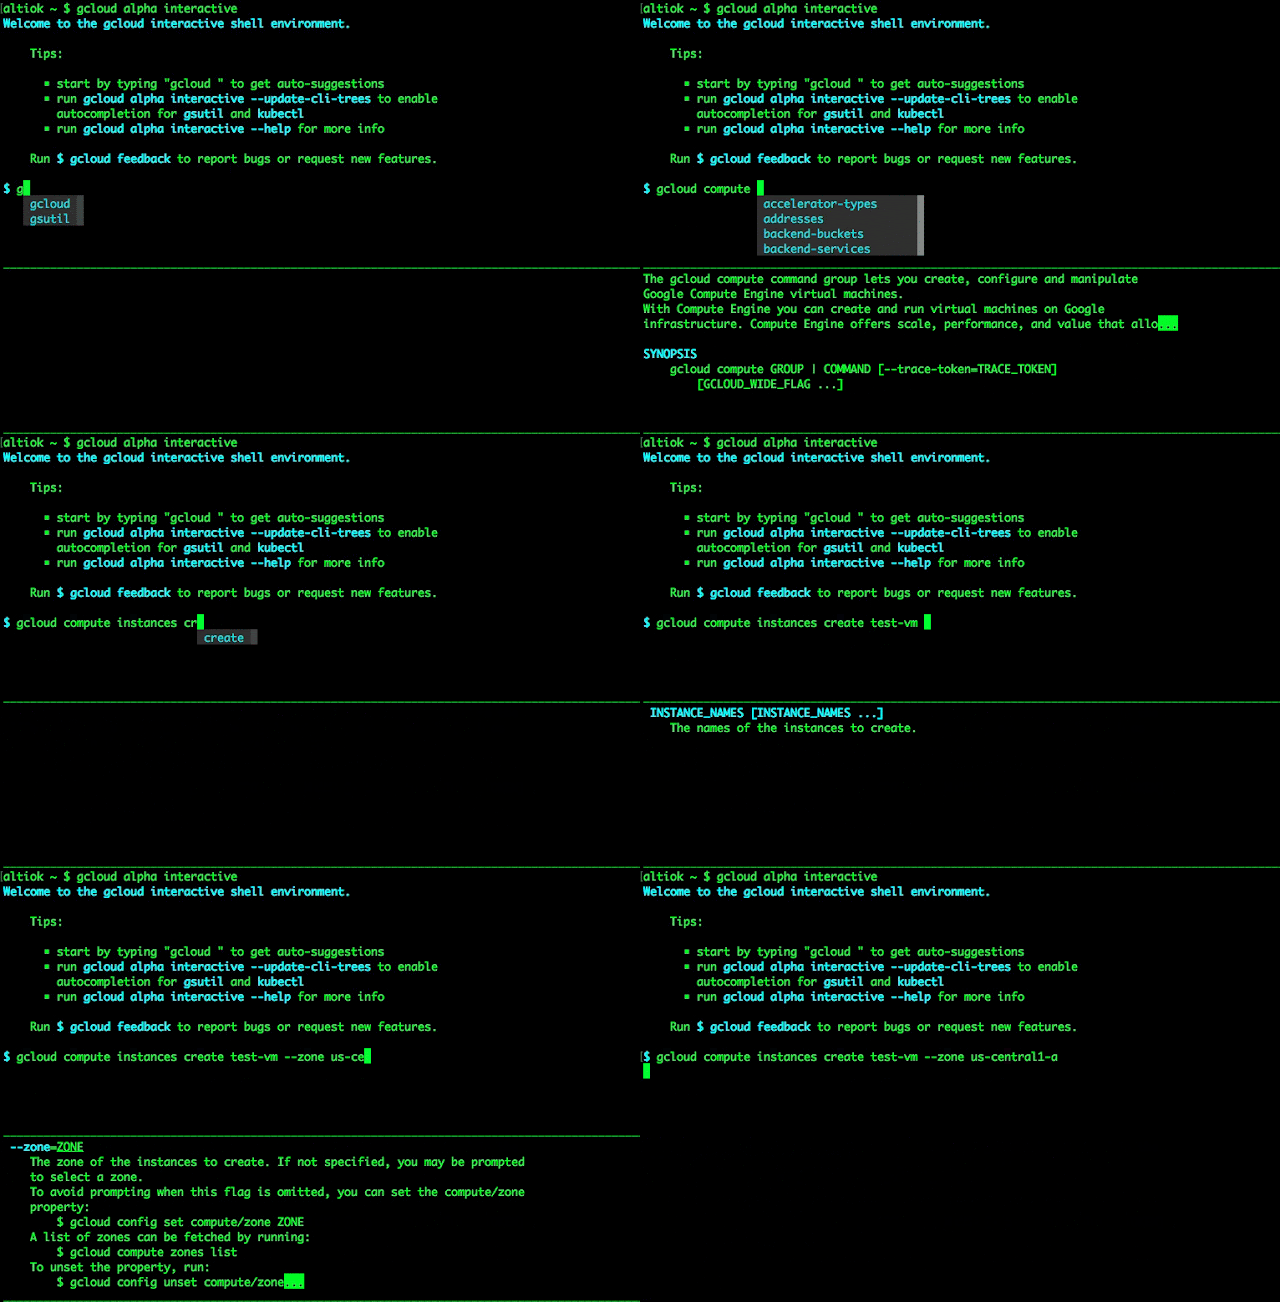
If you develop applications on Google Cloud Platform (GCP), you probably spend a lot of time in the GCP command line. But as we grow our GCP services, the number of commands and flags is growing by leaps and bounds. So today, we’re introducing a new command line interface (CLI) that lets you discover—and use—all these commands more efficiently: gcloud interactive.

The Google Cloud SDK offers a variety of command line tools to interact with GCP, namely:

  • gcloud — GCP’s primary CLI 
  • gsutil — CLI to interact with Google Cloud Storage 
  • bq — CLI to interact with Google BigQuery 
  • kubectl — Kubernetes Engine’s CLI

Currently in public alpha, the new interactive CLI environment provides auto-prompts and in-line help for gcloud, gsutil, bq and kubectl commands. No more context-switching as you search for command names, required flags or argument types in help pages. Now all of this information is included as part of the interactive environment as you type!
The interactive environment also supports standard bash features like:

  • intermixing gcloud and standard bash commands 
  • running commands like cd and pwd, and set/use shell variables across command executions 
  • running and controlling background processes 
  • TAB-completing shell variables, and much more!

For example, you can assign the result of the command to a variable and later call this variable as an input to a different command:

$ active_vms=$(gcloud compute instances list --format="value(NAME)" --filter="STATUS=RUNNING")
$ echo $active_vms

You can also create and run bash scripts while you're in the interactive environment.
For example, the following script iterates all compute instances and restarts the ones that have been TERMINATED.

#!/bin/bash
terminated_vms=$(gcloud compute instances list --format="value(NAME)" --filter="STATUS=terminated")
for name in $terminated_vms
do
  echo "Instance $name will restart."
  zone=$(gcloud compute instances list --format="value(ZONE)" --filter="NAME=$name")
  gcloud compute instances start $name --zone $zone 
done