To perform continuous delivery at any scale, you need to be able to release software changes not just at high velocity, but safely as well. Today, Google and Netflix are pleased to announce Kayenta, an open-source automated canary analysis service that allows teams to reduce risk associated with rolling out deployments to production at high velocity.
Developed jointly by Google and Netflix, Kayenta is an evolution of Netflix’s internal canary system, reimagined to be completely open, extensible and capable of handling more advanced use cases. It gives enterprise teams the confidence to quickly push production changes by reducing error-prone, time-intensive and cumbersome manual or ad-hoc canary analysis.
Kayenta is integrated with Spinnaker, an open-source multi-cloud continuous delivery platform.
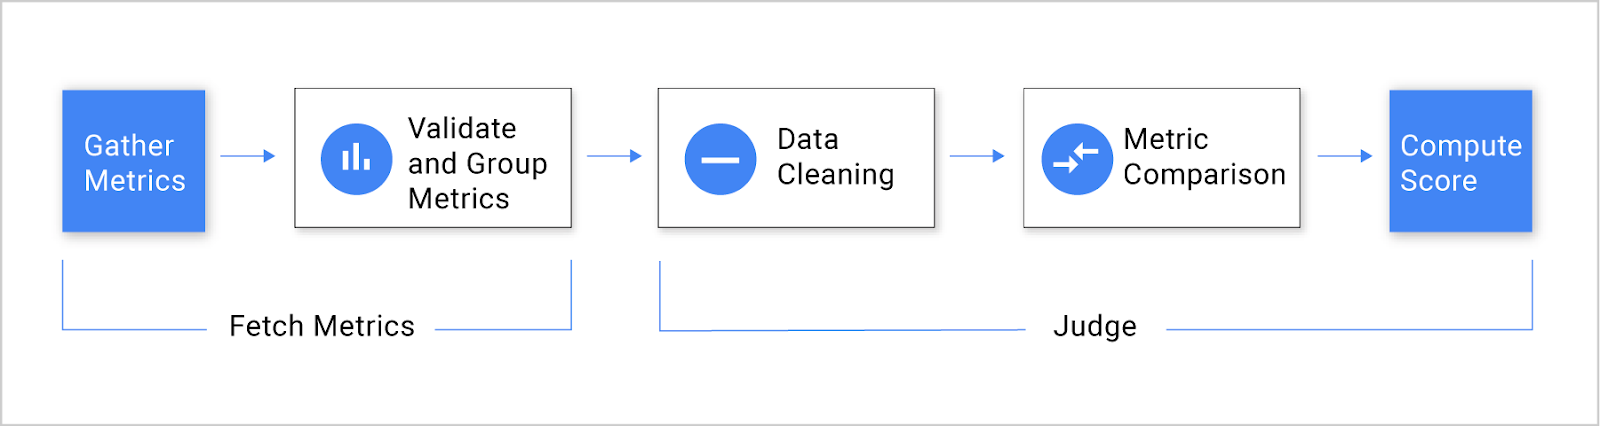
This allows teams to easily set up an automated canary analysis stage within a Spinnaker pipeline. Kayenta fetches user-configured metrics from their sources, runs statistical tests, and provides an aggregate score for the canary. Based on the score and set limits for success, Kayenta can automatically promote or fail the canary, or trigger a human approval path.
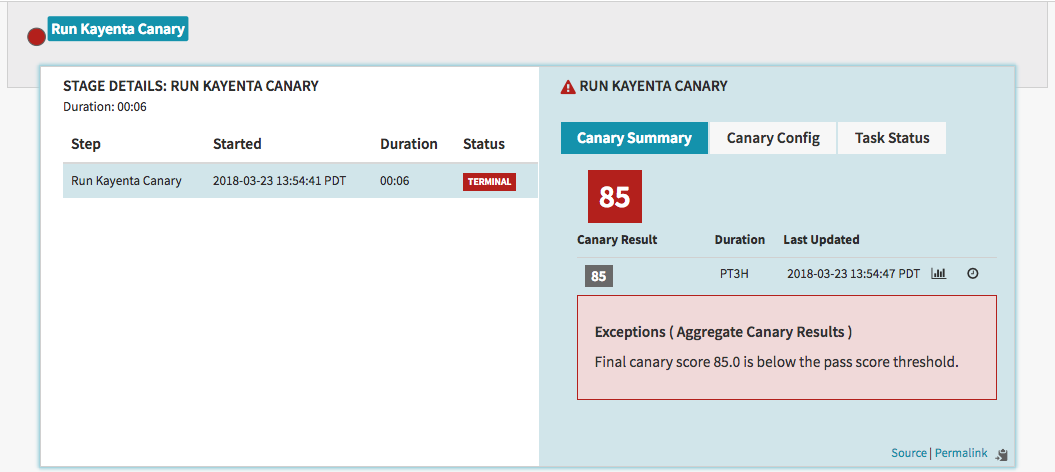
"Automated canary analysis is an essential part of the production deployment process at Netflix and we are excited to release Kayenta. Our partnership with Google on Kayenta has yielded a flexible architecture that helps perform automated canary analysis on a wide range of deployment scenarios such as application, configuration and data changes. Spinnaker’s integration with Kayenta allows teams to stay close to their pipelines and deployments without having to jump into a different tool for canary analysis. By the end of the year, we expect Kayenta to be making thousands of canary judgments per day. Spinnaker and Kayenta are fast, reliable and easy-to-use tools that minimize deployment risk, while allowing high velocity at scale."A final result summary from Kayenta looks something like the following:
— Greg Burrell, Senior Reliability Engineer at Netflix (read more in Netflix’s blog post)
“Canary analysis along with Spinnaker deployment pipelines enables us to automatically identify bad deployments. With 1000+ pipelines running in production, any form of human intervention as a part of canary analysis can be a huge blocker to our continuous delivery efforts. Automated canary deployment, as enabled by Kayenta, has allowed our team to increase development velocity by detecting anomalies faster. Additionally, being open source, standardizing on Kayenta helps reduce the risk of vendor lock-in. We look forward to working closely with Google and Netflix to further integrate Kayenta into our development cycle and get rid of our self-developed Jenkins job canary”
— Tom Feiner, Systems Operations Engineer at Waze
Continuous delivery challenges at scale
Canary analysis is a good way to reduce the risk associated with introducing new changes to end users in production. The basic idea is to route a small subset of production traffic, for example 1%, through a deployment that reflects the changes (the canary) and a newly deployed instance that has the same code and configuration as production (the baseline). The production instance is not modified in any way. Typically three instances are created each for baseline and canary, while production has multiple instances. Creating a new baseline helps minimize startup effects and limit the system variations between it and the canary. The system then compares the key performance and functionality metrics between the canary and the baseline, as chosen by the system owner. To continue with deployment, the canary should behave as well or better than the baseline.

- Speed and scalability bottlenecks: For organizations like Google and Netflix that run at scale and that want to perform comparisons many times over multiple deployments in a single day, manual canary analysis isn't really an option. Even for other organizations, a manual approach to canary analysis can’t keep up with the speed and shorter delivery time frame of continuous delivery. Configuring dashboards for each canary release can be a significant manual effort, and manually comparing hundreds of different metrics across the canary and baseline is tiresome and laborious.
- Accounting for human error: Manual canary analysis requires subjective assessment and is prone to human bias and error. It can be hard for people to separate real issues from noise. Humans often make mistakes while interpreting metrics and logs and deciding whether to promote or fail the canary. Collecting, monitoring and then aggregating multiple canary metrics for analysis in a manual manner further adds to the areas where an error can be made because of human judgement.
- Risk of incorrect decisions: Comparing short-term metrics of a new deployment to the long-running production instances in a manual or ad-hoc fashion is an inaccurate way to identify the health of the canary. Mainly because it can be hard to distinguish whether the performance deviations you see in the canary are statistically relevant or simply random. As a result, you may end up pushing bad deployments to production.
- Poor support for advanced use cases: To optimize the continuous delivery cycle with canary analysis, you need a high degree of confidence about whether to promote or fail the canary. But gaining the confidence to make go/no-go decisions based on manual or ad-hoc processes is time-consuming, primarily because a manual or ad-hoc canary analysis can’t handle advanced use cases such as adjusting boundaries and parameters in real-time.
The Kayenta approach
Compared to manual or ad-hoc analysis, Kayenta runs automatic statistical tests on user-specified metrics and returns an aggregate score (success, marginal, failure). This rigorous analysis helps better inform rollout or rollback decisions and identify bad deployments that might go unnoticed with traditional canary analysis. Other benefits of Kayenta include:- Open: Enterprise teams that want to perform automated canary analysis with commercial offerings must provide confidential metrics to the provider, resulting in vendor lock-in.
- Built for hybrid and multi-cloud: Kayenta provides a consistent way to detect problems across canaries, irrespective of the target environment. Given its integration to Spinnaker, Kayenta lets teams perform automated canary analysis across multiple environments, including Google Cloud Platform (GCP), Kubernetes, on-premise servers or other cloud providers.
- Extensible: Kayenta makes it easy to add new metric sources, judges, and data stores. As a result, you can configure Kayenta to serve more diverse environments as your needs change.
- Gives confidence quickly: Kayenta lets you adjust boundaries and parameters while performing automatic canary analysis. This lets you move fast and decide whether to promote or fail the canary as soon as you’ve collected enough data.
- Low overhead: It's easy to get started with Kayenta. No need to write custom scripts or manually fetch canary metrics, merge these metrics or perform statistical analysis to decide whether to either deploy or rollback the canary. Deep links are provided by Kayenta within canary analysis results for in-depth diagnostic purposes.
- Insight: For advanced use cases, Kayenta can help perform retrospective canary analysis. This gives engineering and operations teams insights into how to refine and improve canary analysis over time.
Integration with Spinnaker
Join us!
With Kayenta, you now have an open, automated way to perform canary analysis and quickly deploy changes to production with confidence. By open-sourcing Kayenta, our goal is to build a community where metric stores and judges are provided both by the open source community and via proprietary systems. Here are some ways you can learn more about Kayenta and contribute to the project:
- Register for the Google-Netflix webinar
- Read more about Kayenta in Netflix’s blog
- Find instructions for upgrading your Spinnaker installation to include Kayenta: https://www.spinnaker.io/setup/canary/
- Access user guide: https://www.spinnaker.io/guides/user/canary/
- Try Kayenta now and join the Kayenta project: https://github.com/spinnaker/kayenta
- Find us on slack: http://join.spinnaker.io/
- Attend Spinnaker meetup in Bay Area
- Attend “Large-Scale Continuous Delivery at Netflix and Waze Using Spinnaker” talk at Google Cloud Next 2018
We hope you will join us!


