Today, we are introducing regional replication for Google Cloud Bigtable, our low latency, massively scalable NoSQL database for analytical and operational workloads. You can now easily replicate your Cloud Bigtable data set asynchronously across zones within a Google Cloud Platform (GCP) region, for additional read throughput, higher durability, and resilience in the face of zonal failures.
Cloud Bigtable is a great database service when you need low latency, random data access and scalability. Cloud Bigtable separates compute from storage, allowing its clusters to seamlessly scale and increase read/write throughput as needed. Common use cases for Cloud Bigtable with replication include storing data for ad-tech, monitoring, IoT, time series, user analytics, and recommendation workloads.
MessageBird is a communications platform company that connects enterprises to their global customers via SMS, Voice and Chat APIs. MessageBird uses Cloud Bigtable to store and retrieve text messages to support its SMS functionality, and is an early adopter of Cloud Bigtable replication:
“Cloud Bigtable replication helps us simplify replication setup where we don't have to do the dirty work ourselves. Most importantly, it saves us development time and gives us peace of mind that our data is safely and correctly replicated.”
— Aleksandar Aleksandrov, Data Engineer, MessageBird
Getting started
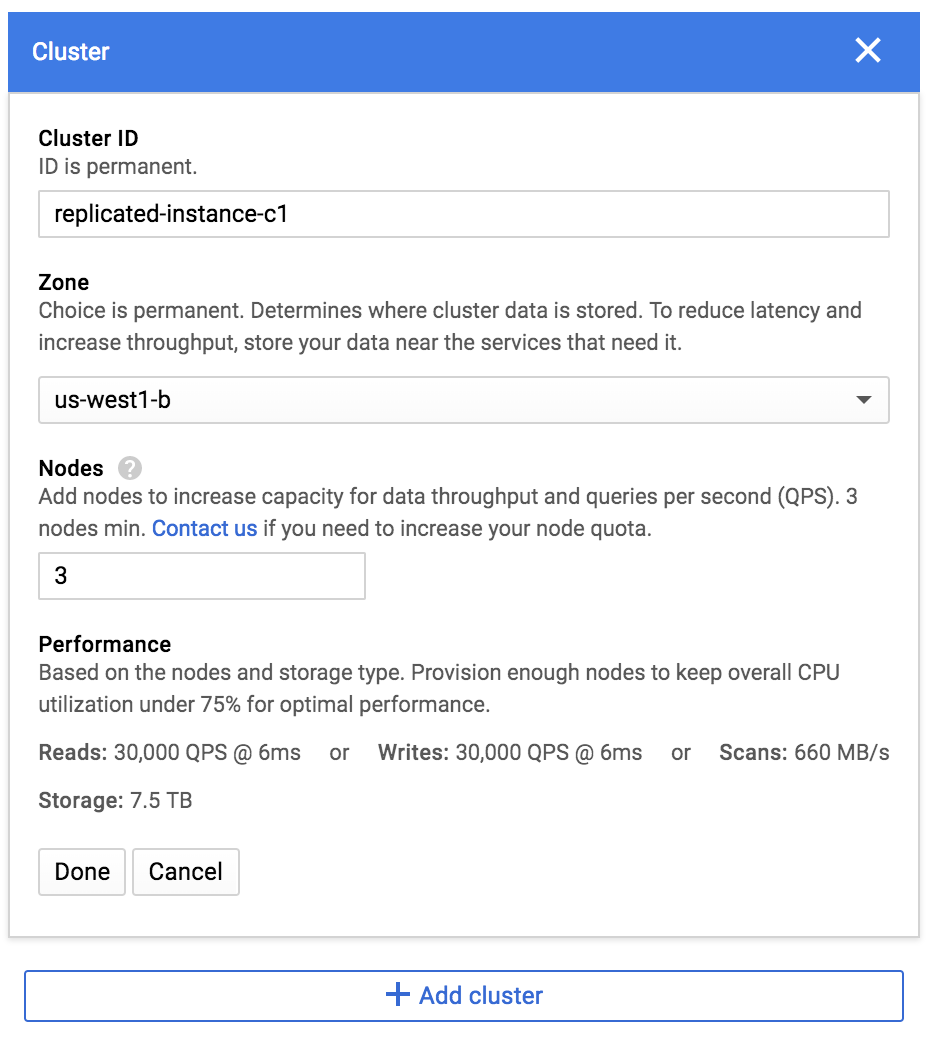
To get started with replication, create a Cloud Bigtable instance with two clusters. First, make sure the first cluster is in a region that offers Cloud Bigtable in at least two zones. In this example, we've chosen us-west1-b:
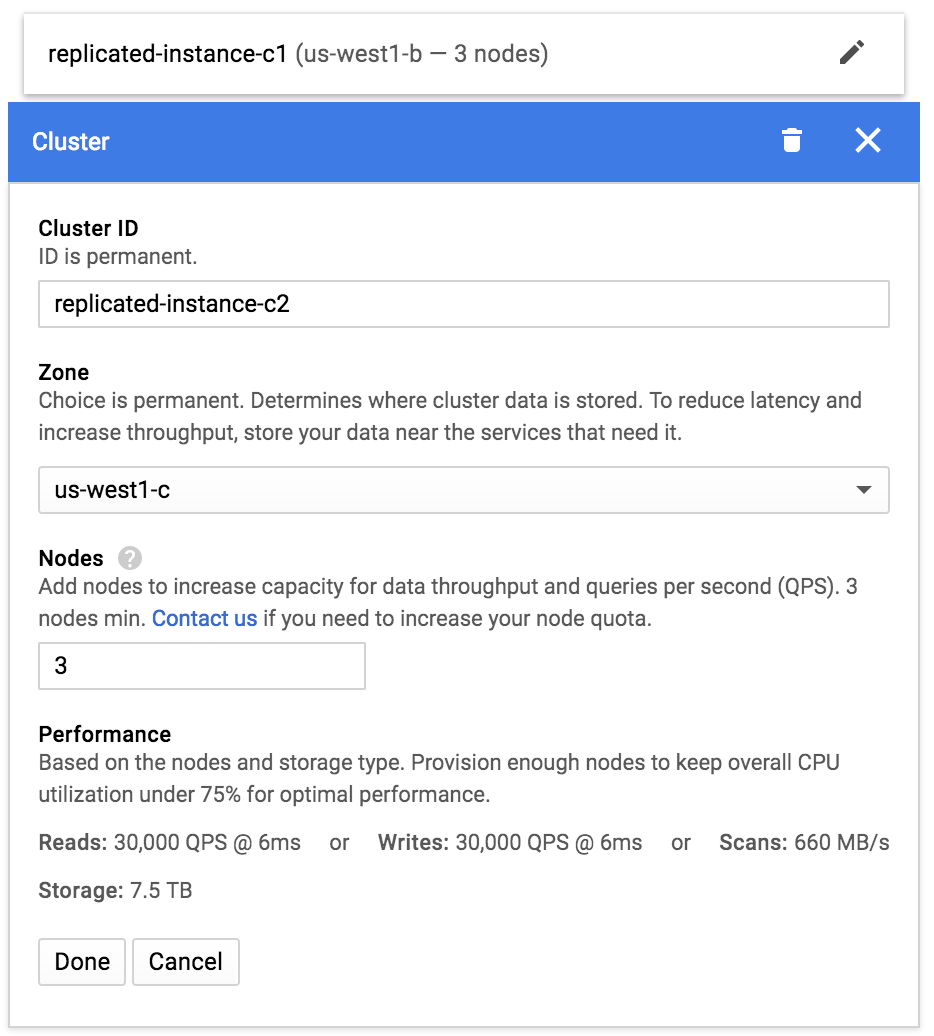
Next, click Add cluster and set up your second cluster. We'll put this one in us-west1-c:
After you set up your clusters, click Create. Cloud Bigtable creates your instance and automatically enables bidirectional asynchronous replication between the two clusters.
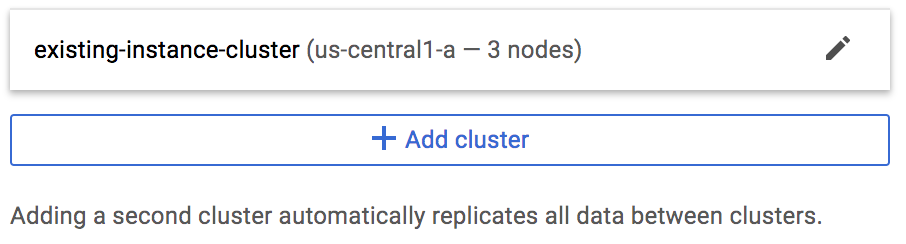
You can also add replication to an existing instance, as long as it's in a region that offers Cloud Bigtable in at least two zones. Start by opening your list of instances and clicking the instance you want to update, then clicking Edit instance. You'll see your existing cluster, with an Add cluster button underneath:
Click Add cluster and configure your second cluster, then click Save. Cloud Bigtable adds the cluster and immediately starts bidirectional replication between the two clusters.
If you've already stored a lot of data in Cloud Bigtable, it may take a little while to replicate all of your data to the new cluster. You can keep track of the status of the initial bulk copy by opening your list of instances and clicking the instance you're interested in, then looking at the "Tables available" metric in the Overview tab:
Once all of your tables are available in both clusters, you can keep track of the ongoing replication latency by clicking the Monitoring tab to view graphs for the instance:
Then, in the View metrics for drop-down list, select Replication to see the current replication latency:
Next steps
Now that you've gotten started with replication, you'll probably want to make some configuration changes to make sure you're using it effectively. We've provided detailed instructions to show you the right settings to use for common use cases, such as increasing availability and separating different kinds of traffic.
Here are a few other documentation links that might be useful:
Overview of Replication walks through the core concepts behind replication for Cloud Bigtable
Application Profiles explains what app profiles are, what they do, and how they work
Creating an Instance provides detailed instructions for creating an instance with the GCP Console or from the command line
Adding a Cluster describes how to enable replication by adding a second cluster to an existing instance
If you’re building applications that need to support high availability, you know how important it is to be able to replicate data between zones, and we’re thrilled to bring that capability to Cloud Bigtable customers.
By Mani Doraisamy, founder at Guesswork.co and Google Developer Expert
[Editor’s note: Mani Doraisamy built two products—Guesswork.co and CommerceDNA—on top of Google Cloud Platform. In this blog post he shares insights into how his application architecture evolved to support the changing needs of his growing customer base while still staying cost-effective.]
Guesswork is a machine learning startup that helps e-commerce companies in emerging markets recommend products for first-time buyers on their site. Large and established e-commerce companies can analyze their users' past purchase history to predict what product they are most likely to buy next and make personalized recommendations. But in developing countries, where e-commerce companies are mostly focused on attracting new users, there’s no history to work from, so most recommendation engines don’t work for them. Here at Guesswork, we can understand users and recommend them relevant products even if we don’t have any prior history about them. To do that, we analyze lots of data points about where a new user is coming from (e.g., did they come from an email campaign for t-shirts, or a fashion blog about shoes?) to find every possible indicator of intent. Thus far, we’ve worked with large e-commerce companies around the world such as Zalora (Southeast Asia), Galeries Lafayette Group (France) and Daraz (South Asia).
Building a scalable system to support this workload is no small feat. In addition to being able to process high data volumes per each customer, we also need to process hundreds of millions of users every month, plus any traffic spikes that happen during peak shopping seasons.
As a bootstrapped startup, we had three key goals while designing the system:
Stay small. As a small team of three developers, we didn’t want to add any additional personnel even if we needed to scale up for a huge volume of users.
Stay profitable. Our revenue is based on the performance of our recommendation engine. Instead of a recurring fee, customers pay us a commission on sales to their users that come from our recommendations. This business model made our application architecture and infrastructure costs a key factor in our ability to turn a profit.
Embrace constraints. In order to increase our development velocity and stay flexible, we decided to trade off control over our development stack and embrace constraints imposed by managed cloud services.
These three goals turned into our motto: "I would rather optimize my code than fundraise." By turning our business goals into a coding problem, we also had so much more fun. I hope you will too, as I recount how we did it.
Choosing a database: The Three Musketeers
The first stack we focused was the database layer. Since we wanted to build on top of managed services, we decided to go with Google Cloud Platform (GCP)—a best-in-class option when it comes to scaling, in our opinion.
But, unlike traditional databases, cloud databases are not general purpose. They are specialized. So we picked three separate databases for transactional, analytical and machine learning workloads. We chose:
Cloud Datastore for our transactional database, because it can support high number of writes. In our case, the user events are in the billions and are updated in real time into Cloud Datastore.
BigQuery to analyze user behaviour. For example, we understand from BigQuery that users coming from a fashion blog usually buy a specific type of formal shoes.
Vision API to analyze product images and categorize products. Since we work with e-commerce companies across different geographies, the product names and descriptions are in different languages, and categorizing products based on images is more efficient than text analysis. We use this data along with user behaviour data from BigQuery and Cloud Datastore to make product recommendations.
First take: the App Engine approach
Once we chose our databases, we moved on to selecting the front-end service to receive user events from e-commerce sites and update Cloud Datastore. We chose App Engine, since it is a managed service and scales well at our volumes. Once App Engine updates the user events in Cloud Datastore, we synchronized that data into BigQuery and our recommendation engine using Cloud Dataflow, another managed service that orchestrates different databases in real time (i.e., streaming mode).
This architecture powered the first version of our product. As our business grew, our customers started asking for new features. One feature request was to send alerts to users when the price of a product changed. So, in the second version, we began listening to price changes in our e-commerce sites and triggered events to send alerts. The product’s price is already recorded as a user event in Cloud Datastore, but to detect change:
We compare the price we receive in the user event with the product master and determine if there is a difference.
If there is a difference, we propagate it to the analytical and machine learning databases to trigger an alert and reflect that change in the product recommendation.
There are millions of user events every day. Comparing each user event data with product master increased the number of reads on our datastore dramatically. Since each Cloud Datastore read counts toward our GCP monthly bill, it increased our costs to an unsustainable level.
Take two: the Cloud Functions approach
To bring down our costs, we had two options for redesigning our system:
Use memcache to load the product master in memory and compare the price/stock for every user event. With this option, we had no guarantee that memcache would be able to hold so many products in memory. So, we might miss a price change and end up with inaccurate product prices.
Use Cloud Firestore to record user events and product data. Firestore has an option to trigger Cloud Functions whenever there’s a change in value of an entity. In our case, the price/stock change automatically triggers a cloud function that updates the analytical and machine learning databases.
During our redesign, Firestore and Cloud Functions were in alpha, but we decided to use them as it gave us a clean and simple architecture:
With Firestore, we replaced both App Engine and Datastore. Firestore was able to accept user requests directly from a browser without the need for a front-end service like App Engine. It also scaled well like Datastore.
We used Cloud Functions not only as a way to trigger price/stock alerts, but as an orchestration tool to synchronize data between Firestore, BigQuery and our recommendation engine.
It turned out to be a good decision, as Cloud Functions scaled extremely well, even in alpha. For example, we went from one to 20 million users on Black Friday. In this new architecture, Cloud Functions replaced Dataflow’s streaming functionality with triggers, while providing a more intuitive language (JavaScript) than Dataflow’s pipeline transformations. Eventually, Cloud Functions became the glue that tied all the components together.
What we gained
Thanks to the flexibility of our serverless microservice-oriented architecture, we were able to replace and upgrade components as the needs of our business evolved without redesigning the whole system. We achieved the key goal of being profitable by using the right set of managed services and keeping our infrastructure costs well below our revenue. And since we didn't have to manage any servers, we were also able to scale our business with a small engineering team and still sleep peacefully at night.
Additionally, we saw some great outcomes that we didn't initially anticipate:
We increased our sales commissions by improving recommendation accuracy
The best thing that happened in this new version was the ability to A/B test new algorithms. For example, we found that users who browse e-commerce sites with an Android phone are more likely to buy products that are on sale. So, we included user’s device as a feature in the recommendation algorithm and tested it with a small sample set. Since, Cloud Functions are loosely coupled (with Cloud Pub/Sub), we could implement a new algorithm and redirect users based on their device and geography. Once the algorithm produced good results, we rolled it out to all users without taking down the system. With this approach, we were able to continuously improve the accuracy of our recommendations, increasing revenue.
We reduced costs by optimizing our algorithm
As counter intuitive it may sound, we also found that paying more money for compute didn't improve accuracy. For example, we analyzed a month of a user’s events vs. the latest session’s events to predict what the user was likely to buy next. We found that the latest session was more accurate even though it had less data points. The simpler and more intuitive the algorithm, the better it performed. Since Cloud Functions are modular by design, we were able to refactor each module and reduce costs without losing accuracy.
We reduced our dependence on external IT teams and signed more customers
We work with large companies and depending on their IT team, it can take a long time to integrate our solution. Cloud Functions allowed us to implement configurable modules for each of our customers. For example, while working with French e-commerce companies, we had to translate the product details we receive in the user events into English. Since Cloud Functions supports Node.js, we enabled scriptable modules in JavaScript for each customer that allowed us to implement translation on our end, instead of waiting for the customer’s IT team. This reduced our go-live time from months to days, and we were able to sign up new customers who otherwise might not have been able to invest the necessary time and effort up-front.
Since Cloud Functions was alpha at the time, we did face challenges while implementing non-standard functionality such as running headless Chrome. In such cases, we fell back on App Engine flexible environment and Compute Engine. Over time though, the Cloud Functions product team moved most of our desired functionality back into the managed environment, simplifying maintenance and giving us more time to work on functionality.
Let a thousand flowers bloom
If there is one take away from this story, it is this: Running a bootstrapped startup that serves 100 million users with three developers was unheard of just five years ago. With the relentless pursuit of abstraction among cloud platforms, this has become a reality. Serverless computing is at the bleeding edge of this abstraction. Among the serverless computing products, I believe Cloud Functions has a leg up on its competition because it stands on the shoulders of GCP's data products and their near-infinite scale. By combining simplicity with scale, Cloud Functions is the glue that makes GCP greater than the sum of its parts.The day has come when a bootstrapped startup can build a large-scale application like Gmail or Salesforce. You just read one such story— now it’s your turn :)
With KubeCon in Copenhagen this week, it’s shaping up to be a busy week for Kubernetes news. Here’s another tidbit: Starting this week, we are launching the Kubernetes Podcast from Google, hosted by yours truly and Google Cloud Kubernetes advocacy lead, Craig Box. In this weekly conversation, we’ll focus on all the great things that are happening in the world of Kubernetes. From the news of the week to interviews with people in the community, we’re helping you stay up to date on everything Kubernetes.
In our first episode we spoke with Paris Pittman; Kubernetes Community Manager, about the community, how it’s different, and how to get involved (if you aren’t already). Next week, we’re talking about Kubeflow with David Aronchick.
We’re just getting started so we’d love for you to subscribe and give it a listen. You can check out the podcast on Google Play Music Podcasts, iTunes Podcasts, or your favorite podcast client (just search for Kubernetes Podcast and look for our logo). You can also subscribe by scanning the QR code for your platform below.
We hope you enjoy the podcast. Be sure to let us know if there are any particular topics you’d like us to discuss, guests you think we should interview, or technology/projects we should know about by email ([email protected]) or on Twitter (@KubernetesPod).
By Chris Kleban and Ari Liberman, Product Managers
Cloud-based hardware accelerators like Graphic Processing Units, or GPUs, are a great choice for computationally demanding workloads such as machine learning and high-performance computing (HPC). We strive to provide the widest selection of popular accelerators on Google Cloud to meet your needs for flexibility and cost. To that end, we’re excited to announce that NVIDIA Tesla V100 GPUs are now publicly available in beta on Compute Engine and Kubernetes Engine, and that NVIDIA Tesla P100 GPUs are now generally available.
Today’s most demanding workloads and industries require the fastest hardware accelerators. You can now select as many as eight NVIDIA Tesla V100 GPUs, 96 vCPU and 624GB of system memory in a single VM, receiving up to 1 petaflop of mixed precision hardware acceleration performance. The next generation of NVLink interconnects deliver up to 300GB/s of GPU-to-GPU bandwidth, 9X over PCIe, boosting performance on deep learning and HPC workloads by up to 40%. NVIDIA V100s are available immediately in the following regions: us-west1, us-central1 and europe-west4. Each V100 GPU is priced as low as $2.48 per hour for on-demand VMs and $1.24 per hour for Preemptible VMs. Like our other GPUs, the V100 is also billed by the second and Sustained Use Discounts apply.
Our customers often ask which GPU is the best for their CUDA-enabled computational workload. If you’re seeking a balance between price and performance, the NVIDIA Tesla P100 GPU is a good fit. You can select up to four P100 GPUs, 96 vCPUs and 624GB of memory per virtual machine. Further, the P100 is also now available in europe-west4 (Netherlands) in addition to us-west1, us-central1, us-east1, europe-west1 and asia-east1.
Our GPU portfolio offers a wide selection of performance and price options to help meet your needs. Rather than selecting a one-size-fits-all VM, you can attach our GPUs to custom VM shapes and take advantage of a wide selection of storage options, paying for only the resources you need.
* Maximum vCPU count and system memory limit on the instance might be smaller depending on the zone or the number of GPUs selected.
** GPU prices listed as hourly rate, per GPU attached to a VM that are billed by the second. Pricing for attaching GPUs to preemptible VMs is different from pricing for attaching GPUs to non-preemptible VMs. Prices listed are for US regions. Prices for other regions may be different. Additional Sustained Use Discounts of up to 30% apply to GPU on-demand usage only.
Google Cloud makes managing GPU workloads easy for both VMs and containers. On Google Compute Engine, customers can use instance templates and managed instance groups to easily create and scale GPU infrastructure. You can also use NVIDIA V100s and our other GPU offerings in Kubernetes Engine, where Cluster Autoscaler helps provide flexibility by automatically creating nodes with GPUs, and scaling them down to zero when they are no longer in use. Together with Preemptible GPUs, both Compute Engine managed instance groups and Kubernetes Engine’s Autoscaler let you optimize your costs while simplifying infrastructure operations.
LeadStage, a marketing automation provider, is impressed with the value and scale of GPUs on Google Cloud.
"NVIDIA GPUs work great for complex Optical Character Recognition tasks on poor quality data sets. We use V100 and P100 GPUs on Google Compute Engine to convert millions of handwritten documents, survey drawings, and engineering drawings into machine-readable data. The ability to deploy thousands of Preemptible GPU instances in seconds was vastly superior to the capacity and cost of our previous GPU cloud provider."
— Adam Seabrook, Chief Executive Officer, LeadStage
Chaos Group provides rendering solutions for visual effects, film, architectural, automotive design and media and entertainment, and is impressed with the speed of NVIDIA V100s on Google Cloud.
"V100 GPUs are great for running V-Ray Cloud rendering services. Among all possible hardware configurations that we've tested, V100 ranked #1 on our benchmarking platform. Thanks to V100 GPUs we can use cloud GPUs on-demand on Compute Engine to render our clients' jobs extremely fast." — Boris Simandoff, Director of Engineering, Chaos Group
If you have computationally demanding workloads, GPUs can be a real game-changer. Check our GPU page to learn more about how you can benefit from P100, V100 and other Google Cloud GPUs!
By Katie Richardson, Google Cloud Certified Program Manager
Mastering a discipline depends on learning the fundamentals of a craft before you can aspire to the next level.
To this point, we’ve developed a new certification exam, Associate Cloud Engineer, that identifies individuals who have the foundational skills necessary to use Google Cloud Console to deploy applications, monitor operations, and manage enterprise solutions. We are excited to announce that registration for the Associate Cloud Engineer beta exam is now open.
As businesses move in growing numbers to cloud-based environments, the need to hire or fill existing skills gaps with individuals proficient in cloud technology has skyrocketed. Unfortunately, there is a clear lack of people with the requisite skills to work with cloud technologies.
If you’re an aspiring cloud architect or data engineer who is technically proficient in the Google Cloud environment but don’t have years of experience designing cloud solutions, this certification is for you. The Associate Cloud Engineer is an entry point to our professional-level cloud certifications, Cloud Architect and Data Engineer, which recognize individuals who can use Google Cloud Platform (GCP) to solve more complex and strategic business problems.
Demonstrate that you have mastered the fundamental cloud skills as an Associate Cloud Engineer so you can take your next steps to become a Google Cloud Certified professional.
The beta exam is now open for registration. The testing period runs May 9-30, 2018
To earn this certification, you must successfully pass our Associate Cloud Engineer exam
Save 40% on the cost of certification by participating in this beta
The length of the exam is four hours
When you become an Associate Cloud Engineer, you show potential employers that you have the essential skills to work on GCP. So, what are you waiting for?
Editor’s note: Today is the second installment in a seven-part video and blog series from Google Developer Advocate Sandeep Dinesh on how to get the most out of your Kubernetes environment.
As you start to build more and more services on top of Kubernetes, simple tasks start to get more complicated. For example, teams can’t create Kubernetes Services or Deployments with the same name. If you have thousands of pods, just listing them all would take some time, let alone actually administering them! And these are just the tip of the iceberg.
In this episode of Kubernetes Best Practices, let’s take a look at how Kubernetes Namespaces can make managing your Kubernetes resources easier.
What is a Namespace?
You can think of a Namespace as a virtual cluster inside your Kubernetes cluster. You can have multiple namespaces inside a single Kubernetes cluster, and they are all logically isolated from each other. They can help you and your teams with organization, security, and even performance!
The “default” Namespace
In most Kubernetes distributions, the cluster comes out of the box with a Namespace called “default.” In fact, there are actually three namespaces that Kubernetes ships with: default, kube-system (used for Kubernetes components), and kube-public (used for public resources). kube-public isn’t really used for much right now, and it’s usually a good idea to leave kube-system alone, especially in a managed system like Google Kubernetes Engine. This leaves the default Namespace as the place where your services and apps are created.
There is absolutely nothing special about this Namespace, except that the Kubernetes tooling is set up out of the box to use this namespace and you can’t delete it. While it is great for getting started and for smaller production systems, I would recommend against using it in large production systems. This is because it is very easy for a team to accidentally overwrite or disrupt another service without even realizing it. Instead, create multiple namespaces and use them to segment your services into manageable chunks.
Creating Namespaces
Don’t be afraid to create namespaces. They don’t add a performance penalty, and in many cases can actually improve performance as the Kubernetes API will have a smaller set of objects to work with.
Creating a Namespace can be done with a single command. If you wanted to create a Namespace called ‘test’ you would run:
kubectl create namespace test
Or you can create a YAML file and apply it just like any other Kubernetes resource.
test.yaml:
kind: Namespace
apiVersion: v1
metadata:
  name: test
  labels:
    name: test
kubectl apply -f test.yaml
Viewing Namespaces
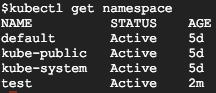
You can see all the Namespaces with the following command:
kubectl get namespace
You can see the three built-in Namespaces, as well as the new Namespace called ‘test.’
Creating Resources in the Namespace
Let’s take a look at a simple YAML to create a Pod:
You might notice that there is no mention of namespaces anywhere. If you run a `kubectl apply` on this file, it will create the Pod in the current active namespace. This will be the “default” namespace unless you change it.
There are two ways to explicitly tell Kubernetes in which Namespace you want to create your resources.
One way is to set the “namespace” flag when creating the resource:
kubectl apply -f pod.yaml --namespace=test
You can also specify a Namespace in the YAML declaration.
apiVersion: v1
kind: Pod
metadata:
  name: mypod
  namespace: test
  labels:
    name: mypod
spec:
  containers:
  - name: mypod
    image: nginx
If you specify a namespace in the YAML declaration, the resource will always be created in that namespace. If you try to use the “namespace” flag to set another namespace, the command will fail.
Viewing resources in the Namespace
If you try to find your Pod, you might notice you can’t!
$ kubectl get pods
No resources found.
This is because all commands are run against the currently active Namespace. To find your Pod, you need to use the “namespace” flag.
$ kubectl get pods --namespace=test
NAME      READY     STATUS    RESTARTS   AGE
mypod     1/1       Running   0          10s
This can get annoying quickly, especially if you are a developer working on a team that uses its own Namespace for everything and don’t want to use the “namespace” flag for every command. Let’s see how we can fix that.
Managing your active Namespace
Out of the box, your active namespace is the “default” namespace. Unless you specify a Namespace in the YAML, all Kubernetes commands will use the active Namespace.
Unfortunately, trying to manage your active Namespace with kubectl can be a pain. Fortunately, there is a really good tool called kubens (created by the wonderful Ahmet Alp Balkan) that makes it a breeze!
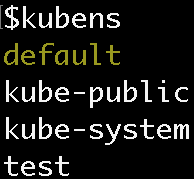
When you run the ‘kubens’ command, you should see all the namespaces, with the active namespace highlighted:
To switch your active namespace to the ‘test’ Namespace, run:
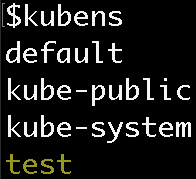
kubens test
Now you can see that the ‘test’ Namespace is active:
Now, if you run kubectl commands, the Namespace will be ‘test’ instead of ‘default’! This means you don’t need the namespace flag to see the pod in the test namespace.
$ kubectl get pods
NAME      READY     STATUS    RESTARTS   AGE
mypod     1/1       Running   0          10m
Cross Namespace communication
Namespaces are “hidden” from each other, but they are not fully isolated by default. A service in one Namespace can talk to a service in another Namespace. This can often be very useful, for example to have your team’s service in your Namespace communicate with another team’s service in another Namespace.
When your app wants to access a Kubernetes sService, you can use the built-in DNS service discovery and just point your app at the Service’s name. However, you can create a service with the same name in multiple Namespaces! Thankfully, it’s easy to get around this by using the expanded form of the DNS address.
Services in Kubernetes expose their endpoint using a common DNS pattern. It looks like this:
<Service Aame>.<Namespace Name>.svc.cluster.local
Normally, you just need the Service’s name and DNS will automatically resolve to the full address. However, if you need to access a Service in another Namespace just use the Service name plus the Namespace name.
For example, if you want to connect to the “database” service in the “test” namespace, you can use the following address:
database.test
If you want to connect to the “database” service in the “production” namespace, you can use the following address:
database.production
Warning: If you create a Namespace that maps to a TLD like “com” or “org”, and then create a Service that has the same name as a website, like “google” or “reddit”, Kubernetes will intercept requests to “google.com” or “reddit.com” and send them to your Service. This can often be very useful for testing and proxying, but can also easily break things in your cluster!
Note: If you do want to isolate Namespaces, you should use Network Policies to accomplish this. Stay tuned for more on this in a future episode!
Namespace granularity
A common question I get is how many Namespaces to create and for what purpose. What exactly are manageable chunks? Create too many Namespaces and they get in your way, but make too few and you miss out on the benefits.
I think the answer lies in what stage your project or company is in—from small team, to mature enterprise, each has its own organizational structure. Depending on your situation, you can adopt the relevant Namespace strategy.
The small team
In this scenario, you are part of a small team that is working on 5-10 microservices and can easily bring everyone into the same room. In this situation, it makes sense to launch all production services into the “default” Namespace. You might want to have a “production” and “development” namespace if you want to get fancy, but you are probably testing your development environment on your local machine using something like Minikube.
Rapidly growing team(s)
In this scenario, you have a rapidly growing team that is working on 10+ microservices. You are starting to split the team into multiple sub-teams that each own their own microservices. While everyone might know how the complete system works, it is getting harder to coordinate every change with everyone else. Trying to spin up the full stack on your local machine is getting more complicated every day.
It is necessary at this point to use multiple clusters or namespaces for production and development. Each team may choose to have their own namespace for easier manageability.
The large company
In a large company, not everyone knows everyone else. Teams are working on features that other teams might not know about. Teams are using services contracts to communicate with other microservices (e.g., gRPC) and service meshes to coordinate communication (e.g., istio). Trying to run the whole stack locally is impossible. Using a Kubernetes-aware Continuous Delivery system (e.g., Spinnaker) is highly recommended.
At this point, each team definitely needs its own namespace. Each team might even opt for multiple namespaces to run its development and production environments. Setting up RBAC and ResourceQuotas is a good idea as well. Multiple clusters start to make a lot of sense, but might not be necessary.
Note: I’ll deep dive into gRPC, Istio, Spinnaker, RBAC, and resources in future episodes!
Enterprise
At this scale, there are groups that don’t even know about the existence of other groups. Groups might as well be external companies, and services are consumed through well-documented APIs. Each group has multiple teams that have multiple microservices. Using all the tools I mentioned above are necessary; people should not be deploying services by hand and should be locked out of Namespaces they don’t own.
At this point, it probably makes sense to have multiple clusters to reduce the blast radius of poorly configured applications, and to make billing and resource management easier.
Conclusion
Namespaces can help significantly with organizing your Kubernetes resources and can increase the velocity of your teams. Stay tuned for future Kubernetes Best Practices episodes where I’ll show you how you can lock down resources in a Namespace and introduce more security and isolation to your cluster!
When an outage occurs in your cloud application, having fast insight into what’s going on is crucial to resolving the issue quickly. If you use Google Stackdriver, you probably rely on alerting policies to detect these issues and notify you with relevant information. To improve the organization and readability of the information contained in these alerts, we’ve added some new features to make our alerting notifications more descriptive, useful and actionable. We’ll gradually roll out these updates over the next few weeks.
One of these new features is the ability to add variables to your alerting notifications. You can use this to include more metadata in your notifications, for example information on Kubernetes clusters and other resources. You can also use this to construct specific playbook information and links using the variable substitution.
In addition, we’re transitioning to HTML-formatted emails that are easier to read and more clearly organized. We’re also adding the documentation field to Slack notifications, as well as webhook, so teams using these notification methods can utilize these new features.
New variable substitution in alerting policy documentation
You can now include variables in the documentation section of your alerting policies. The contents of this field are also now included in Slack and webhook notifications, in addition to email.
The following syntax:
${varname}
will be formatted by replacing the expression ${varname} with the value of varname. We support only simple variable substitutions; more complex expressions, for example ${varname1 + varname2}, are not. We also support the use of $$ as an escape sequence (so that the literal text "${" may be written using "$${").
Variable
Meaning
condition.name
The REST resource name of the condition (e.g. "projects/foo/alertPolicies/12345/conditions/5678")
condition.display_name
The display name for the triggering condition
metadata.user_label.key
The value of the metadata label "key" (replace "key" appropriately)
metric.type
The metric (e.g. "compute.googleapis.com/instance/cpu/utilization")
metric.display_name
The display name associated with this metric type
metric.label.key
The value of the metric label "key" (replace "key" appropriately)
policy.user_label.key
The value of the user label "key" (replace "key" appropriately)
policy.name
The REST resource name of the policy (e.g. "projects/foo/alertPolicies/12345")
policy.display_name
The display name associated with the alerting policy
project
The project ID of the Stackdriver host account
resource.project
The project ID of the monitored resource of the alerting policy.
resource.type
The type of the resource (e.g. "gce_instance")
resource.display_name
The display name of the resource
resource.label.key
The value of the resource label "key" (replace "key" appropriately)
Note: You can only set policy user labels via the Monitoring API.
@mentions for Slack
Slack notifications now include the alerting policy documentation. This means that you can include customized Slack formatting and control sequences for your alerts. For the various options, please refer to the Slack documentation.
One useful feature is linking to a user. So for example, including this line in the documentation field
@backendoncall policy ${policy.display_name} triggered an incident
notifies the user backend-oncall in addition to sending the message to the relevant Slack channel that was described in the policy’s notification options.
Notification examples
Now, when you look at a Stackdriver notification, all notification methods (with the exception of SMS) include the following fields:
Incident ID/link: the incident that triggered the notification along with a link to the incident page
Policy name: the name of the configured alerting policy
Condition name: the name of the alerting policy condition that is in violation
Email:
Email:
Slack:
Webhook:
{
   "incident":{
      "incident_id":"0.kmttg2it8kr0",
      "resource_id":"",
      "resource_name":"totally-new cassweb1",
      "started_at":1514931579,
      "policy_name":"Backend processing utilization too high",
      "condition_name":"Metric Threshold on Instance (GCE) cassweb1",
      "url":"https://app.google.stackdriver.com/incidents/0.kmttg2it8kr0?project=tot
ally-new",
      "documentation":{
         "content":"CPU utilization sample. This might affect our backend
processing.\u000AFollowing playbook here: https://my.sample.playbook/cassweb1",
         "mime_type":"text/markdown"
      },
      "state":"open",
      "ended_at":null,
      "summary":"CPU utilization for totally-new cassweb1 is above the threshold of
 0.8 with a value of 0.994."
   },
   "version":"1.2"
}
Next steps
We’ll be rolling out these new features in the coming weeks as part of the regular updating process. There’s no action needed on your part, and the changes will not affect the reliability or latency of your existing alerting notification pipeline. Of course, we encourage you to give meaningful names to your alerting policies and conditions, as well as add a “documentation” section to configured alerting policies to help oncall engineers understand the alert notification when they receive it. And as always, please send us your requests and feedback, and thank you for using Stackdriver!
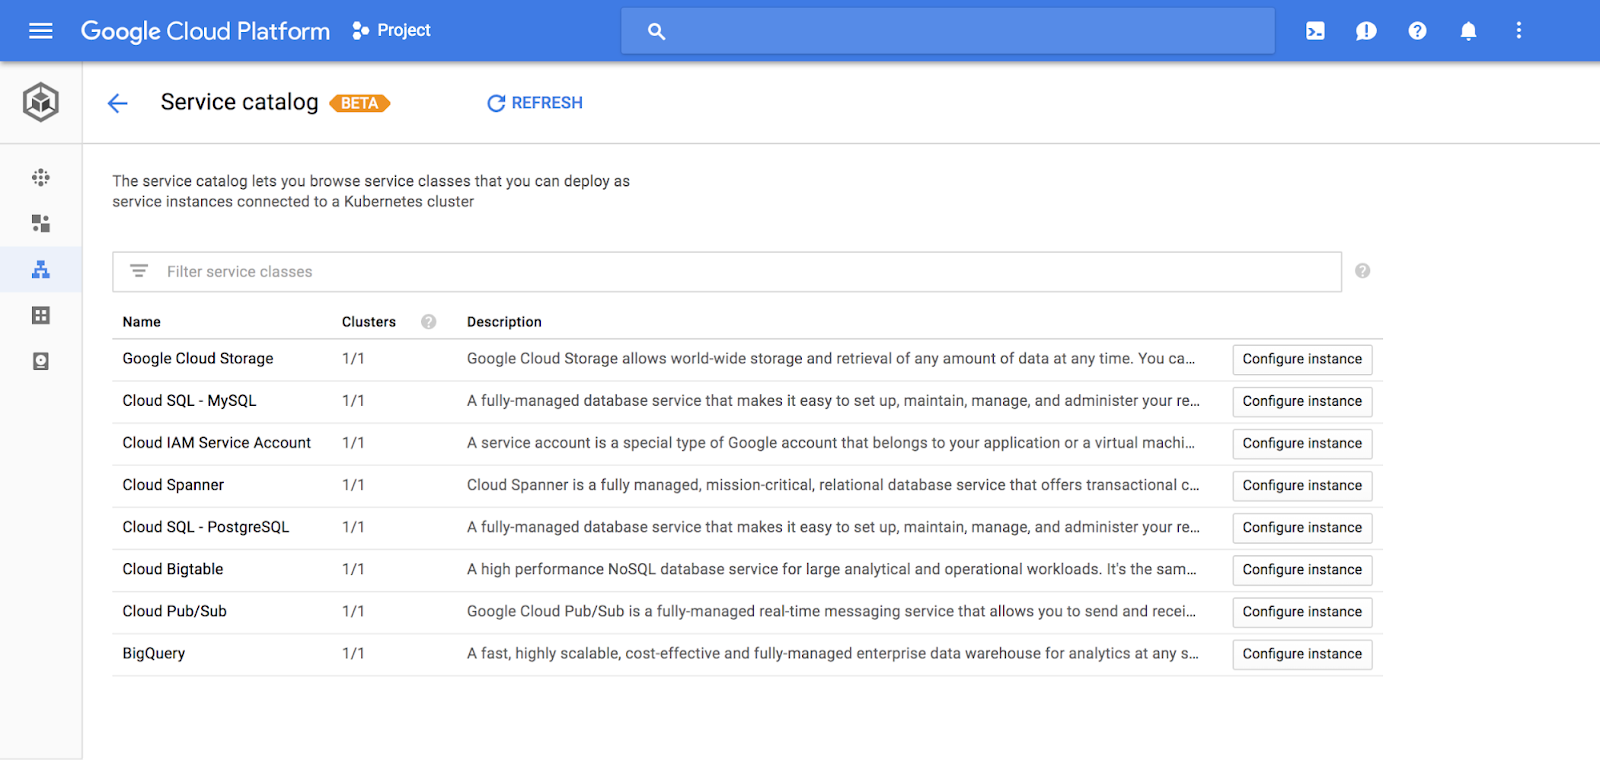
Kubernetes provides developers with an easy-to-use platform for building cloud-native applications, some of which need to use cloud-based services such as storage or messaging. In fact, there are whole catalogs of services that you may want to access from your cloud-native application, but setting them up and connecting to them from Kubernetes can be difficult and require specialized knowledge.
To make it easier to connect to Google Cloud Platform (GCP) services from either a GCP-hosted Kubernetes cluster or an on-premises Kubernetes cluster, we are releasing a new services framework: Kubernetes Service Catalog, a collection of services available to Kubernetes running on GCP, and the Google Cloud Platform Service Broker, a hosted service that connects to a variety of GCP services. These offerings are based on the Kubernetes Catalog SIG and the Open Service Broker API.
This design makes it easy for you to use the environment that you are familiar with (i.e., the kubectl command line) to create service instances and connect to them. With two commands you can create the service instance and set the security policy to give you application access to the resource. You don’t need to know how to create or manage the services to use them in your application.
Based on open-source APIs, Kubernetes Service Catalog and the Service Broker give you access to a rich ecosystem of services to incorporate into your applications. Brokers for Cloud Foundry and other environments are already available.
This beta release allows you to focus on the services you need to get your job done without the hassle of knowing how the services are built or worrying about the infrastructure you need to run them. Support for the Kubernetes Service Catalog will be rolling out in the Google Cloud Console UI over the next few days. We’ll add more GCP services to the Service Broker as we move forward, opening up a whole new range of services for your applications.
For more information on how you can get started using GCP services from your Kubernetes cluster, visit the documentation.
It’s only been a few months since we last spoke about securing Google Kubernetes Engine, but a lot has changed since then. Our security team has been working to further harden Kubernetes Engine, so that you can deploy sensitive containerized applications on the platform with confidence. Today we’ll walk through the latest best practices for hardening your Kubernetes Engine cluster, with updates for new features in Kubernetes Engine versions 1.9 and 1.10.
1. Follow the steps in the previous hardening guide
This new hardening guide assumes you’ve already completed the previous one. So go ahead and run though that guide real quick, and head on back over here.
2. Service Accounts and Access Scopes
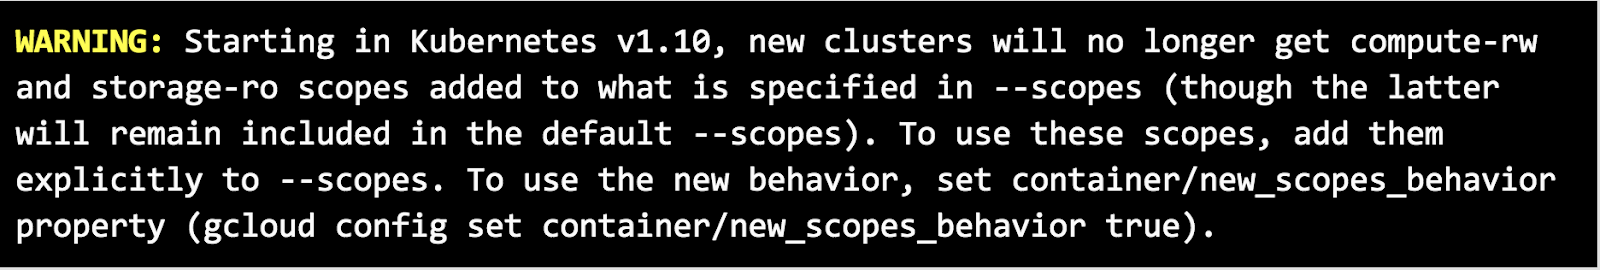
Next, you’ll need to think about service accounts and access control. We strive to set up Kubernetes Engine with usable but protected defaults. In Kubernetes Engine 1.7, we disabled the Kubernetes Dashboard (the web UI) by default, because it uses a highly privileged service account; and in 1.8, we disabled Attribute-Based Access Control (ABAC) by default, since Role-Based Access Control (RBAC) provides more complex permission management. Now, in Kubernetes Engine 1.10, new clusters will no longer have the compute-rw scope on node service accounts enabled by default, which reduces the blast radius of a potential node compromise. If a node were exploited, an attacker would not be able to use the service account to create new compute resources or read node metadata directly, which could be a path for privilege escalation.
If you’ve created a Kubernetes Engine cluster recently, you may have seen the following warning:
This means that if you have a special requirement to use the node’s service account to access storage or manipulate compute resources, you’ll need to explicitly include the required scopes when creating new clusters:
If you’re like most people and don’t use these scopes, your new clusters are automatically created with the gke-default permissions.
3. Create good RBAC roles
In the Kubernetes Engine 1.8 hardening blog post, we made sure node service accounts were running with the minimum required permissions, but what about the accounts used by DevOps team(s), Cluster administrators, or security teams? They all need different levels of access to clusters, which should be kept as restricted as possible.
While Cloud IAM provides great user access management at the Google Cloud Platform (GCP) Project level, RBAC roles control access within each Kubernetes cluster. They work in concert to help you enforce strong access control.
A good RBAC role should give a user exactly the permissions they need, and no more. Here is how to create and grant a user permission to view pods only, for example:
```
PROJECT_ID=$(gcloud config get-value project)
PRIMARY_ACCOUNT=$(gcloud config get-value account)
# Specify your cluster name.
CLUSTER=cluster-1

# You may have to grant yourself permission to manage roles
kubectl create clusterrolebinding cluster-admin-binding \
   --clusterrole cluster-admin --user $PRIMARY_ACCOUNT

# Create an IAM service account for the user “gke-pod-reader”, which
we will allow to read pods
gcloud iam service-accounts create gke-pod-reader \
    --display-name "GKE Pod Reader" \
    USER_EMAIL=gke-pod-reader@$PROJECT_ID.iam.gserviceaccount.com

cat > pod-reader-clusterrole.yaml<<EOF
kind: ClusterRole
apiVersion: rbac.authorization.k8s.io/v1
metadata:
  namespace: default
  name: pod-reader
rules:
- apiGroups: [""] # "" indicates the core API group
  resources: ["pods"]
  verbs: ["get", "watch", "list"]
EOF

kubectl create -f pod-reader-clusterrole.yaml

cat > pod-reader-clusterrolebinding.yaml<<EOF
kind: ClusterRoleBinding
apiVersion: rbac.authorization.k8s.io/v1
metadata:
  name: pod-reader-global
subjects:
- kind: User
  name: $USER_EMAIL
  apiGroup: rbac.authorization.k8s.io
roleRef:
  kind: ClusterRole
  name: pod-reader
  apiGroup: rbac.authorization.k8s.io
EOF

kubectl create -f pod-reader-clusterrolebinding.yaml

# Check the permissions of our Pod Reader user.
gcloud iam service-accounts keys create \
   --iam-account $USER_EMAIL pod-reader-key.json
gcloud container clusters get-credentials $CLUSTER
gcloud auth activate-service-account $USER_EMAIL \
   --key-file=pod-reader-key.json

# Our user can get/list all pods in the cluster.
kubectl get pods --all-namespaces

# But they can’t see the deployments, services, or nodes.
kubectl get deployments --all-namespaces
kubectl get services --all-namespaces
kubectl get nodes

# Reset gcloud and kubectl to your main user.
gcloud config set account $PRIMARY_ACCOUNT
gcloud container clusters get-credentials $CLUSTER
```
For most people, the predefined IAM roles available on Kubernetes Engine work great. If they meet your organization's needs then you’re good to go. If you need more fine-grained control, though, we also have the tools you need.
Custom IAM Roles let you define new roles, alongside the predefined ones, with the exact permissions your users require and no more.
5. Explore the cutting edge
We’ve launched a few new features to beta that we recommend turning on, at least in a test environment, to prepare for their general availability.
In order to use these beta features, you’ll need to enable the v1beta1 API on your cluster by running this command:
gcloud config set container/use_v1_api false
Conceal your host VM’s metadata Server [Beta]
Starting with the release of Kubernetes 1.9.3, Kubernetes Engine can conceal the Compute Engine metadata server from your running workloads, to prevent your workload from impersonating the node. Many practical attacks against Kubernetes rely on access to the node’s metadata server to extract the node’s identity document and token.
Constraining access to the underlying service account, by using least privilege service accounts as we did in the previous guide, is a good idea; preventing workloads from impersonating the node is even better. Note that containers running in your pods will still be able to access the non-sensitive data from the metadata server.
Kubernetes offers many controls to restrict your workloads at the pod spec level to execute with only their minimum required capabilities. Pod Security Policy allows you to set smart defaults for your pods, and enforce controls you want to enable across your fleet. The policies you define should be specific to the needs of your application. If you’re not sure where to start, we recommend the restricted-psp.yaml in the kubernetes.io documentation for example policies. It’s pretty restrictive, but it’s a good place to start, and you can loosen the restrictions later as appropriate.
If you’ve been following our blog series so far, hopefully you’ve already learned a lot about container security. For Kubernetes Engine, we’ve put together a new Overview of Kubernetes Engine Security, now published in our documentation, to guide you as you think through your security model. This page can act as a starting point to get a brief overview of the various security features and configurations that you can use to help ensure your clusters are following best practices. From that page, you can find links to more detailed guidance for each of the features and recommendations.
We’re working hard on many more Kubernetes Engine security features. To stay in the know, keep an eye on this blog for more security posts, and have a look at the Kubernetes Engine hardening guide for prescriptive guidance on how to bolster the security of your clusters.
Every application has to store and access operational data, usually in a database. Managed database services can help you ship apps faster and reduce operational toil so you can focus on what makes your business successful and unique. To quote analyst firm Gartner, “Cloud-based deployment models and dbPaaS offerings are growing rapidly as an alternative, more flexible, delivery method1,” and our customers’ buying habits are no exception.
Managed database services abstract away the underlying infrastructure so you can interact with a database and an API without worrying about servers, racks, and replication. Google Cloud has a strategy of providing managed database services for your favorite open source data stores as well as proprietary technologies developed at Google over the years.
Today, we’re excited to announce a number of cloud database improvements:
Commit timestamps for Cloud Spanner now available
Availability of Cloud Bigtable replication in beta
Availability of Cloud Memorystore for Redis in beta
Cloud SQL for PostgreSQL is now generally available
Commit timestamps for Cloud Spanner
Cloud Spanner is the only globally distributed relational database that supports external (strong) consistency across regions and continents, and that ability opens new opportunities for businesses. Since it became GA last May, we’ve seen a surge of customers like Optiva or Bandai Namco building mission-critical systems on Cloud Spanner. And we continue to focus on our customers, adding product features based on customer requests. Most recently, we added commit timestamps to Cloud Spanner, which lets you determine the exact ordering of mutations and build changelogs.
Cloud Bigtable replication beta
We are announcing that Cloud Bigtable regional replication is rolling out starting today and will be available to 100% of customers by May 1, 2018. A replicated Cloud Bigtable database can provide higher availability, additional read throughput, higher durability and resilience in the face of zonal failures. With the click of a button, you can now replicate your Cloud Bigtable data set asynchronously across zones within a GCP region, providing a scalable, fully managed, replicated wide-column database service for when low latency, random data access and scalability are critical.
Cloud Memorystore for Redis beta
Support for managed Redis is a popular customer request. On May 9th, we’ll begin offering Cloud Memorystore for Redis in beta, an in-memory data store service for Redis that is scalable, more secure, highly available and fully managed by Google. Compatibility with the Redis protocol means you can migrate your applications with zero code changes.
Redis is commonly used to build solutions such as application caches, gaming leaderboards, and incremental counters. Its fast in-memory caching, powerful data structures and features like replication and pub-sub make it ideal for these low-latency use cases. Redis can be deployed as a standalone instance or replicated for high-availability. Cloud Memorystore removes the operational overhead to setting up and managing these instances so it’s easy to deploy what your application needs.
Cloud SQL for PostgreSQL now generally available
PostgreSQL support for Cloud SQL was our #1 customer database request and we are excited it has reached general availability. During the beta period, we added high availability and replication, higher performance instances with up to 416GB of RAM, and support for 19 additional extensions. It also joined the Google Cloud Business Associates Agreement (BAA) for HIPAA-covered customers.
The service is backed by high-availability functionality and Google Cloud support and a 99.95% availability SLA anywhere in the world. DB-Engines, an independent service that ranks database technologies, ranked PostgreSQL their database of the year in 2017 because of its explosive growth in popularity.
And to make it easy for you to migrate to a managed database service, Cloud SQL for PostgreSQL runs standard open-source PostgreSQL. Further, we plan to give any improvements that we make to PostgreSQL back to the community.
And stay tuned for further developments, as we continue to incorporate new products and features into our managed database portfolio. Your data grows and changes, and your database should grow along with it—in engine choice, in scope, in features, in reliability and in ease of use. Our goal is to offer the most complete suite of managed database services to keep your data accessible, more secure and available, and let you focus on your business. Reach out to us to let us know what kinds of managed database services you’d like us to offer next.
(1) Source: Gartner IT Market Clock for Database Management Systems 2018, Donald Feinberg, Adam M. Ronthal, Ankush Jain 18 January 2018