Category Archives: Google Cloud Platform Blog

Product updates, customer stories, and tips and tricks on Google Cloud Platform

Building a serverless mobile development pipeline on GCP: new solution documentation


When it comes to mobile applications, automating app distribution helps ensure hardening and consistent delivery and speeds testing. But mobile application delivery pipelines can be challenging to build, because mobile development environments require you to install specific SDKs. Even distributing beta versions requires specific secrets and signing credentials.

Containers are a great way to distribute mobile applications, since you can incorporate the specific build requirements into the container image. Our new solution, Creating a Serverless Mobile Delivery Pipeline in Google Cloud Platform, demonstrates how you can use our Container Builder product to automate the build and distribution of the beta versions of your mobile application for just pennies a build. Check it out, and let us know what you think!

Defining SLOs for services with dependencies – CRE life lessons


In a previous episode of CRE Life Lessons, we discussed how service level objectives (SLOs) are an important tool for defining and measuring the reliability of your service. There’s also a whole chapter in the SRE book about this topic. In this episode, we discuss how to define and manage SLOs for services with dependencies, each of which may (or may not!) have their own SLOs.

Any non-trivial service has dependencies. Some dependencies are direct: service A makes a Remote Procedure Call to service B, so A depends on B. Others are indirect: if B in turn depends on C and D, then A also depends on C and D, in addition to B. Still others are structurally implicit: a service may run in a particular Google Cloud Platform (GCP) zone or region, or depend on DNS or some other form of service discovery.

To make things more complicated, not all dependencies have the same impact. Outages for "hard" dependencies imply that your service is out as well. Outages for "soft" dependencies should have no impact on your service if they were designed appropriately. A common example is best-effort logging/tracing to an external monitoring system. Other dependencies are somewhere in between; for example, a failure in a caching layer might result in degraded latency performance, which may or may not be out of SLO.

Take a moment to think about one of your services. Do you have a list of its dependencies, and what impact they have? Do the dependencies have SLOs that cover your specific needs?

Given all this, how can you as a service owner define SLOs and be confident about meeting them? Consider the following complexities:

  • Some of your dependencies may not even have SLOs, or their SLOs may not capture how you're using them.
  • The effect of a dependency's SLO on your service isn't always straightforward. In addition to the "hard" vs "soft" vs "degraded" impact discussed above, your code may complicate the effect of a dependency's SLOs on your service. For example, you have a 10s timeout on an RPC, but its SLO is based on serving a response within 30s. Or, your code does retries, and its impact on your service depends on the effectiveness of those retries (e.g., if the dependency fails 0.1% of all requests, does your retry have a 0.1% chance of failing or is there something about your request that means it is more than 0.1% likely to fail again?).
  • How to combine SLOs of multiple dependencies depends on the correlation between them. At the extremes, if all of your dependencies are always unavailable at the same time, then theoretically your unavailability is based on the max(), i.e., the dependency with the longest unavailability. If they are unavailable at distinct times, then theoretically your unavailability is the sum() of the unavailability of each dependency. The reality is likely somewhere in between.
  • Services usually do better than their SLOs (and usually much better than their service level agreements), so using them to estimate your downtime is often too conservative.
At this point you may want to throw up your hands and give up on determining an achievable SLO for your service entirely. Don't despair! The way out of this thorny mess is to go back to the basics of how to define a good SLO. Instead of determining your SLO bottom-up ("What can my service achieve based on all of my dependencies?"), go top down: "What SLO do my customers need to be happy?" Use that as your SLO.

Risky business

You may find that you can consistently meet that SLO with the availability you get from your dependencies (minus your own home-grown sources of unavailability). Great! Your users are happy. If not, you have some work to do. Either way, the top-down approach of setting your SLO doesn't mean you should ignore the risks that dependencies pose to it. CRE tech lead Matt Brown gave a great talk at SRECon18 Americas about prioritizing risk (slides), including a risk analysis spreadsheet that you can use to help identify, communicate, and prioritize the top risks to your error budget (the talk expands on a previous CRE Life Lessons blog post).

Some of the main sources of risk to your SLO will of course come from your dependencies. When modeling the risk from a dependency, you can use its published SLO, or choose to use observed/historical performance instead: SLOs tend to be conservative, so using them will likely overestimate the actual risk. In some cases, if a dependency doesn't have a published SLO and you don't have historical data, you'll have to use your best guess. When modeling risk, also keep in mind the difficulties described above about mapping a dependency's SLO onto yours. If you're using the spreadsheet, you can try out different values (for example, the published SLO for a dependency versus the observed performance) and see the effect they have on your projected SLO performance.1

Remember that you're making these estimates as a tool for prioritization; they don't have to be perfectly accurate, and your estimates won't result in any guarantees. However, the process should give you a better understanding of whether you're likely to consistently meet your SLO, and if not, what the biggest sources of risk to your error budget are. It also encourages you to document your assumptions, where they can be discussed and critiqued. From there, you can do a pragmatic cost/benefit analysis to decide which risks to mitigate.

For dependencies, mitigation might mean:
  • Trying to remove it from your critical path
  • Making it more reliable; e.g., running multiple copies and failing over between them
  • Automating manual failover processes
  • Replacing it with a more reliable alternative
  • Sharding it so that the scope of failure is reduced
  • Adding retries
  • Increasing (or decreasing, sometimes it is better to fail fast and retry!) RPC timeouts
  • Adding caching and using stale data instead of live data
  • Adding graceful degradation using partial responses
  • Asking for an SLO that better meets your needs
There may be very little you can do to mitigate unavailability from a critical infrastructure dependency, or it might be prohibitively expensive. Instead, mitigate other sources of error budget burn, freeing up error budget so you can absorb outages from the dependency.

A series of earlier CRE Life Lessons posts (1, 2, 3) discussed consequences and escalations for SLO violations, as a way to balance velocity and risk; an example of a consequence might be to temporarily block new releases when the error budget is spent. If an outage was caused by one of your service's dependencies, should the consequences still apply? After all, it's not your fault, right?!? The answer is "yes"—the SLO is your proxy for your users' happiness, and users don't care whose "fault" it is. If a particular dependency causes frequent violations to your SLO, you need to mitigate the risk from it, or mitigate other risks to free up more error budget. As always, you can be pragmatic about how and when to enforce consequences for SLO violations, but if you're regularly making exceptions, especially for the same cause, that's a sign that you should consider lowering your SLOs, or increasing the time/effort you are putting into improving reliability.

In summary, every non-trivial service has dependencies, probably many of them. When choosing an SLO for your service, don't think about your dependencies and what SLO you can achieve—instead, think about your users, and what level of service they need to be happy. Once you have an SLO, your dependencies represent sources of risk, but they're not the only sources. Analyze all of the sources of risk together to predict whether you'll be able to consistently meet your SLO and prioritize which risks to mitigate.

1 If you're interested, The Calculus of Service Availability has more in-depth discussion about modeling risks from dependencies, and strategies for mitigating them.

GCP is building a region in Zürich


Click here for the German version. Danke!


Switzerland is a country famous for pharmaceuticals, manufacturing and banking, and its central location in Europe makes it an attractive location for cloud. Today, we’re announcing a Google Cloud Platform (GCP) region in Zürich to make it easier for businesses to build highly available, performant applications. I am originally from Switzerland, so this cloud infrastructure investment is personally exciting for me.

Zürich will be our sixth region in Europe, joining our future region in Finland, and existing regions in the Netherlands, Belgium, Germany, and the United Kingdom. Overall, the Swiss region brings the total number of existing and announced GCP regions around the world to 20—with more to come!

The Swiss region will open in the first half of 2019. Customers in Switzerland will benefit from lower latency for their cloud-based workloads and data, and the region is also designed for high availability, launching with three zones to protect against service disruptions.

We look forward to welcoming you to the GCP Swiss region, and we’re excited to see what you build with our platform. Our locations page provides updates on the availability of additional services and regions. Contact us to request early access to new regions and help us prioritize what we build next.

Music in motion: a Firebase and IoT story


One of the best parts about working at Google is the incredible diversity of interests. By day, I’m a Developer Advocate focused on IoT paid to write code to show you how easy it is to develop solutions with Google technology. By night, I’m an amateur musician. This is the true story of how I combined those two interests.

It turns out I’m not unique; a lot of folks here at Google play music on top of their day job. Before I started working here, a Googler decided that we needed a place to jam, and thus was born one of our legendary Google perks: Sound City, a soundproof room in the middle of our San Francisco office. It’s an incredible space to jam, with one catch. You can’t book the room during the day. Anyone can go in and play at any time.

This was done for two reasons: to give everyone an opportunity and to foster the magic that sometimes happens when a random set of musicians ends up in the room at the same time, resulting in a jam of epic proportions.

Some of us, however, are not yet the musical gods we aspire to become. I picked up accordion recently. Finding time to practice at home is tough as it’s not the kind of instrument you can practice after the kids go to sleep. Having access to a soundproof music room in which to practice is awesome, but I don’t necessarily want to play when other people are in the room. I don’t want to subject anyone else to my learning of the accordion. That would just be cruel.

I brought this up to the folks that run the room, and suggested putting in a camera so we can see what’s going on in the room. They said that this came up usually once a year. Folks pushed back, because no one wanted to be watched while in the room. Sound detection in the room has the same problem. If something can pick up sound, it could theoretically record sound so folks vetoed it.

Being one of the IoT device folks at Google, I asked if anyone had considered just setting up motion sensors, and having it update a page that folks could look at. A lot of staring and blinking later, my idea was passed around to the folks that run Sound City and I got a thumbs up to go for it. So now I just needed to create a motion sensor, and build a quickie webpage that monitors the state of motion in the room for folks to access.

The setup 

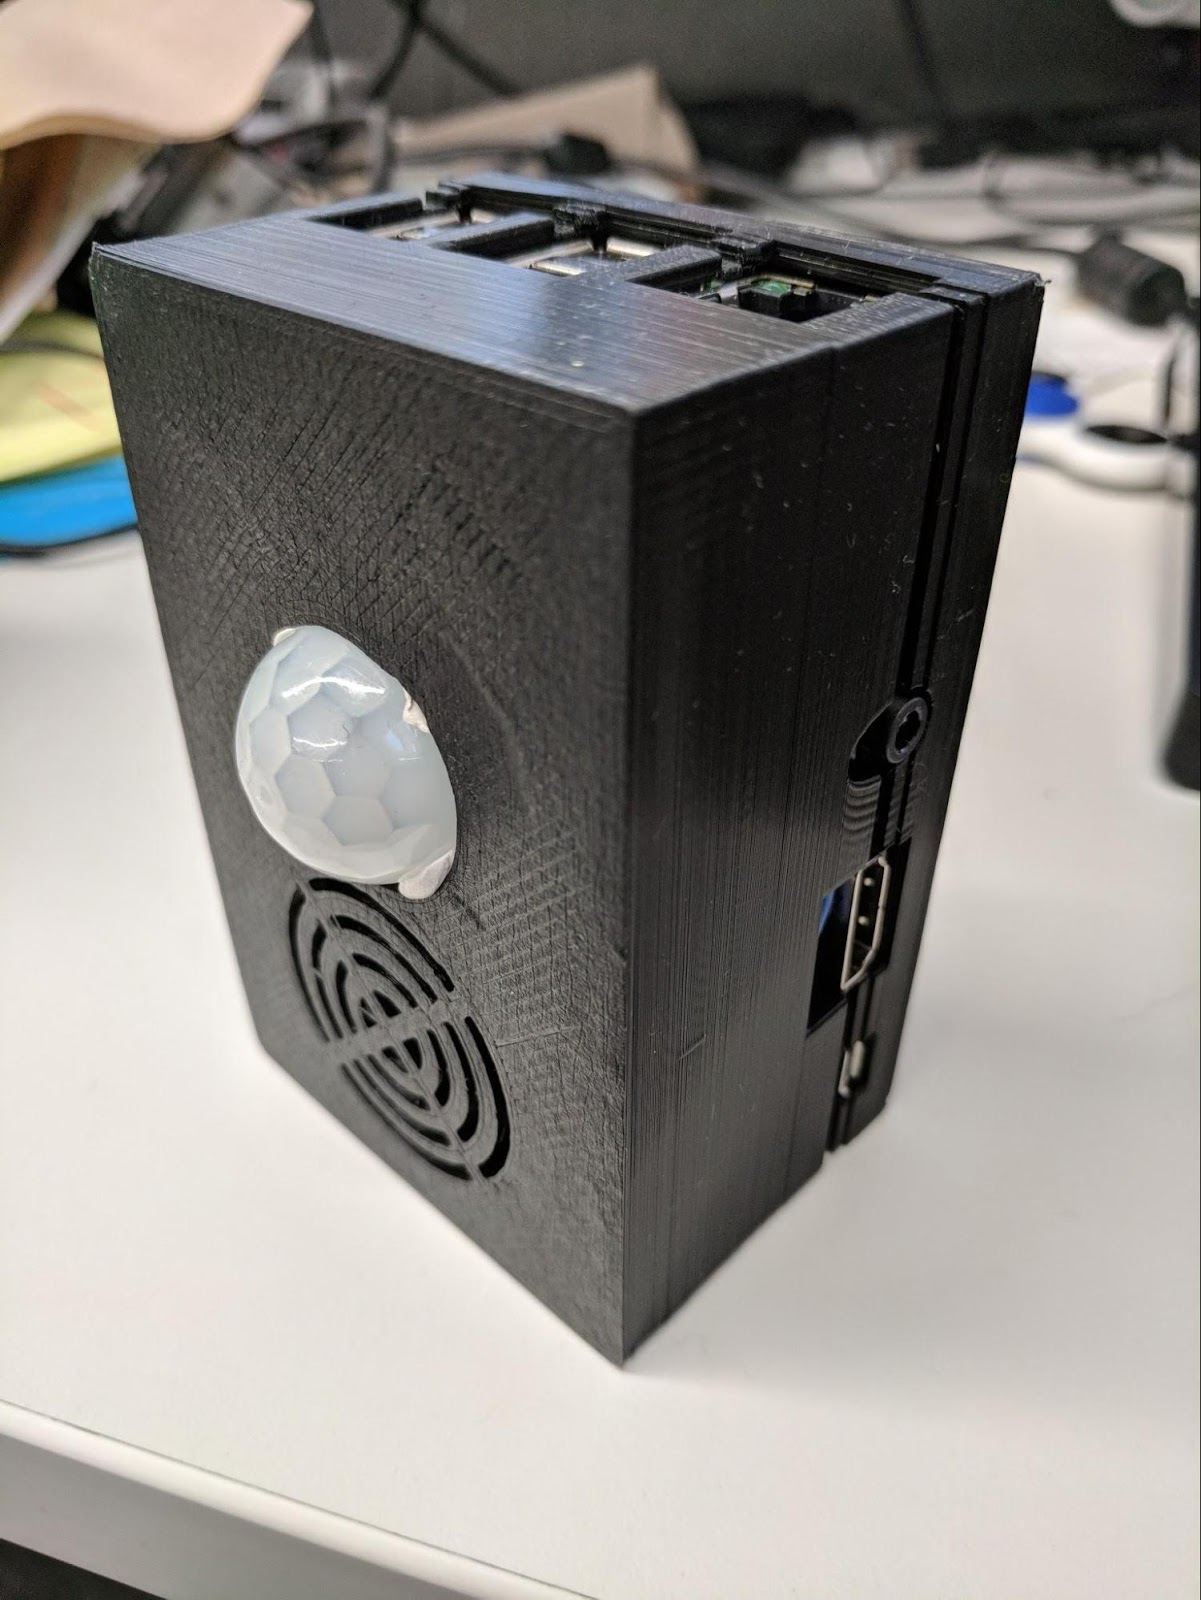
This little project allowed me to tick all kinds of fun boxes. First, I 3d printed the case for the Raspberry Pi + Passive Infrared sensor (PIR). I took an existing model from Tinkercad, and modified it to fit my design. Using their tools I cut out an extra circle to expose the PIR, and extruded the whole case model. The end result worked great. I had plenty of room for the Pi + PIR (and added an LED to show when motion is detected to make it easier for me to debug).

The next step was to set up my data destination. For ease of setup and use, I decided to build this on Firebase, which makes it super easy to set up a real-time database. Like all things popular and open, there are several Python libraries for connecting and interacting with Firebase, including the Google supported Firebase Admin SDK. From a previous project, I had experience using a library called pyrebase, so I stuck with what I knew.

Creating a Firebase project is easy: from the console literally just add a project, give it a name and POOF, you’re done. Note that if you already have a GCP project, you can totally just use that. Just select the project from the dropdown in the Add Project dialog instead. I went ahead and created a project for the music room.

There’s a lot of fun stuff in here to play around with if you haven’t looked at Firebase before. For my purposes, I wanted to use the real-time database. First things first, I grabbed the JSON web config to work with my project. Clicking the “Add Firebase to your web app” button from the project overview home page gave me a hunk of code like so:

<script src="https://www.gstatic.com/firebasejs/4.10.0/firebase.js"></script>
<script>
    // Initialize Firebase
    var config = {
        apiKey: "<super sekret API key>",
        authDomain: "my-project-2e534.firebaseapp.com",
        databaseURL: "https://my-project-2e534.firebaseio.com",
        projectId: "my-project-2e534",
        storageBucket: "my-project-2e534.appspot.com",
        messagingSenderId: "<numerical sender id>"
        };
    firebase.initializeApp(config);
</script>
I copied that to the clipboard; I will need it later.

Next up, I needed to protect the database properly. By default, the read/write rules require a user to be authenticated to interact with the database. This was perfect for ensuring that only my device could write to the database, but I also wanted to read the state from my webpage without having to authenticate with the database. I clicked the Database on the left to get started and then clicked the Rules tab to see the default rules for the database:

{
"rules": {
    ".read": "auth != null",
    ".write": "auth != null"
    }
}
To allow anyone to read from my database (important safety tip, do NOT do this if the data is at all sensitive), I changed the rules to the following:

{
"rules": {
    ".read": true,
    ".write": "auth != null"
    }
}
Firebase supports a bunch of rules you can apply to database permissions; click here if you’re curious.

Next up, authentication! There are a few different ways I could have managed this. Firebase allows for email/password authentication, but if I did it that way, then everything is tied to an email, and that becomes unwieldy from a user-management perspective if someone else needs to administer things, or make changes.

Another approach is to use GCP service accounts, which Firebase honors. Now, I won’t lie, service accounts are not the easiest things to wrap your head around as there are a LOT of knobs you can turn permissions-wise in GCP/Firebase. Here’s a good primer on service accounts if you’re interested in knowing more. I may need to write or find a good blog about service accounts at some point too. If you do go down this route, when you create the service account, be sure to check the box that says “Furnish a new private key”. There may be a message saying “You don’t have permission to furnish a private key.” Ignore that. Just be sure when you’re creating the service account, that you don’t give it full owner privileges on the entire project. You want to limit its access. For mine, I just set “Project->Editor” permissions. Even this is probably too wide open for most production uses. For this project, which is limited in scope and isolated network-wise, I wasn’t too concerned.

Once I created my service account and got my private key (JSON format), I copied and moved the key onto my Pi. So now auth with Firebase was (in theory) all set from a file standpoint.

The code

Next up, code! As a reminder, there were two things I wanted out of the data:

  1. To know if there was anyone in the room
  2. To view occupancy over time

So, funny story. PIR sensors are notoriously finicky. Like, for funsies, do a search for “PIR false positive”. You’ll find a TON of references to people trying to solve the problem of PIR sensors inexplicably triggering even when encased in a freakin lead box. In my case, the motion triggering came like clockwork. Almost every minute (+/- a couple of seconds) came a spike of motion. After an incredible amount of debugging and troubleshooting, it SEEMED like it might be power related, as I could fool it into not happening with some creative wiring, but no combination pull-up, pull-down, capacitor, resistor fixed the problem permanently. Realizing the absurdity of continuing to bang my head against a hardware problem, I just solved it in software with some code around ignoring regular pings of motion. But I’m getting ahead of myself.

Here’s the hunk o’ pertinent code that does the work from the device. There’s nothing super fancy in here, but I’ll walk through a few of the pieces:

while True:
    i = GPIO.input(gpio_pir_in)
    motion = 0
    if i == 1:
        motion = 1

    # Need a chunk of code to account for a weirdness of the PIR
    # sensor. No matter what I've tried, I'm getting a blip of motion
    # every minute like clockwork. The internet claims everything from
    # jumper position (H v. L), power fluctations, etc. Nothing offered
    # seems to work, so I'm falling back on a software solution to
    # discount the minute blip

    current_time = int(round(time.time()))
    formatted_time = datetime.fromtimestamp(current_time).ctime()
    if motion:
        print ("I have motion")
        print (" My repeat time is: {}".format(datetime.fromtimestamp(repeat_time).ctime()))
        if repeat_time == 0:
            repeat_time = current_time
            print("  First time for repeat: {}\n".format(formatted_time))
        elif current_time >= repeat_time + 55 and current_time <= repeat_time + 65:
            print ("  Repeat time: {}\n".format(formatted_time))
            needs_updating = 1
            time.sleep(1.0)
            continue
        else:
            print ("  Real motion: {}\n".format(formatted_time))
            repeat_time = current_time
    elif needs_updating:
        needs_updating = 0
        repeat_time += 60
    else:
        if current_time > repeat_time + 90:
            print ("No motion, but updating repeat time\nUpdating to: {}\n".format(datetime.fromtimestamp(repeat_time + 60).ctime()))
            repeat_time += 60

The core of the script is a while loop that fires once a second. I wrote this bit of code to ignore the regular false positives that happen every minute, give or take. It’s intentionally not quite perfect, in that if it detects new motion that isn’t part of the cycle, it resets the cycle. This also means that motion that happens to occur a minute apart might be falsely ignored. The absolute accuracy that I sacrificed for simpler code was a fine compromise for me. If there’s one thing I can recommend, it’s to make life easier for future-you. An algorithm, or some logic, doesn’t have to be perfect if it doesn’t have to be. If it makes your life easier later, then that’s totally fine. Don’t let anyone tell you differently.

In this case, the potential faults could include:
  • Real motion that occurs at one minute of time but is interpreted as false motion; this would likely self-correct within the next minute (the odds of it happening over and over are astronomically small).
  • A false positive motion when real motion occurs and resets our one-minute false motion timer. Then, less than a minute later, an actual false motion happens, which is interpreted as a real motion (because it's been less than a minute since the previously detected motion). In this case, either there is consistent motion happening due to someone being in the room, or someone has just left the room and real motion has stopped, but the false motion was triggered. In the latter case, this just means less than a minute of extra detected motion before the timed pattern kicks back in and is ignored.

In other words, neither of these faults are a big deal.

One aspect of this code that took me some time to debug (even when I THOUGHT I had fixed it) is the 'else' statement at the end. The PIR doesn’t always fire every minute. There were some cases when the PIR would go past one minute without firing, which would cause my test on time at the next minute (and all subsequent minutes) to fail.

        # Turn on/off the LED based on motion
    GPIO.output(40, motion)

        # If the current motion is the same as the previous motion,
        # then don't send anything to firebase. We only track changes.
    if current_motion == motion:
        time.sleep(1.0)
        continue

    previous_motion = current_motion
    current_motion = motion

    try:
        firebase = pyrebase.initialize_app(config)
        db = firebase.database()
        if motion == 1:
            db.child("latest_motion").set('{{"ts": {} }}'.format(current_time))
        db.child(firebase_column).push('{{"ts": {}, "device_id": {}}, "motion": {} }}'.format(current_time, device_id, motion))
    except:
        e = sys.exc_info()[0]
        print ("An error occurred: {}".format(e))
        current_motion = previous_motion

    time.sleep(1.0)
Here is the second half of the while loop. It uses the config blob I saved earlier with a couple changes:

config = {
    apiKey: "<super sekret API key>",
    authDomain: "my-project-2e534.firebaseapp.com",
    databaseURL: "https://my-project-2e534.firebaseio.com",
    storageBucket: "my-project-2e534.appspot.com",
    serviceAccount: “<local path to service account json>”
}
The service account handles the project ID and the sender ID pieces, so they aren’t needed in the config.

The rest, is nice ‘n’ simple. If the current motion detected is the same as the previous, don’t do anything else (I only cared about changes in motion as markers). I wrapped the Firebase connection and publish code in a broad try/catch because both can raise exceptions. But much as I didn’t care about perfect accuracy in the PIR correction code, the same goes for these exceptions. If an exception is thrown, it means one particular data point didn’t make it to the server, but this is fine because the code resets current_motion in the exception handling so that it will just try again in a second. So again, a couple seconds of being “wrong” is just fine in favor of simpler code.

The visualization

Web hosting (for the page that shows if someone is actually in the room) is SUUUPER simple on Firebase. Click the “hosting” tab on the left, and click the “Get Started” button. It leads you by the hand through installing firebase-tools from the command line, allowing you to run all of Firebase’s magical commands. First, there’s firebase login to auth from CLI, then firebase init to put the framework in the current directory. It’s a firebase.json file, and a www directory. If you type firebase serve it starts up a local server that you can use to test out your page as you work. Don’t forget, there’s fairly intense caching that can happen, although it seemed to feel inconsistent to me. If you don’t see changes being made, just kill the process and restart the server with firebase serve.

Even though this post is already pretty long, I wanted to at least talk through how to build a webpage which listens to Firebase data changes:

    <!-- update the version number as needed -->
    <script defer src="/__/firebase/4.5.0/firebase-app.js"></script>
    <!-- include only the Firebase features as you need -->
    <script defer src="/__/firebase/4.5.0/firebase-auth.js"></script>
    <script defer src="/__/firebase/4.5.0/firebase-database.js"></script>
    <script defer src="/__/firebase/4.5.0/firebase-messaging.js"></script>
    <script defer src="/__/firebase/4.5.0/firebase-storage.js"></script>
    <!-- initialize the SDK after all desired features are loaded -->
    <script defer src="/__/firebase/init.js"></script>

    <script src="https://www.gstatic.com/firebasejs/4.5.0/firebase.js"></script>
    <script>
        // Initialize Firebase
        var config = {
            apiKey: "<super sekret API key>",
            authDomain: "my-project-2e534.firebaseapp.com",
            databaseURL: "https://my-project-2e534.firebaseio.com",
            storageBucket: "my-project-2e534.appspot.com",
            messagingSenderId: "<ID_NUM>"
            };
        firebase.initializeApp(config);
    
This is the Node.js configuration script to initialize the Firebase object. If I hadn’t set the authorization for read: true before, I’d need to go through authorization here as well.

Now that we’re all initialized, there are some events that we can listen to to get things rolling:

var occupied = firebase.database().ref('latest_motion');
      occupied.on("value", function(data){
The document I’m updating in Firebase is that latest_motion piece. Whenever the latest_motion value changes (in my case, the timestamp of last motion detected from the device), that function gets called with the JSON output of the document.

Now, I didn’t HAVE to do that. I could have just made it a fully static page and required folks to hit the refresh button instead, but that didn’t seem quite right. Besides, as an IoT person, I don’t get a lot of opportunity to play with web front-ends.

If I were building a production system, there would definitely be some changes I’d need to make to this. But I just want to know if I can go practice my accordion without interrupting someone else who’s already jamming. Someday, I’ll be good enough that I’ll go up when there is someone jamming so we can jam together.

You can find all the device code and the Firebase web page project I used in my GitHub repo here. I also talk IoT and life on my Twitter: @GabeWeiss_.

Kubernetes best practices: Setting up health checks with readiness and liveness probes


Editor’s note: Today is the third installment in a seven-part video and blog series from Google Developer Advocate Sandeep Dinesh on how to get the most out of your Kubernetes environment.

Distributed systems can be hard to manage. A big reason is that there are many moving parts that all need to work for the system to function. If a small part breaks, the system has to detect it, route around it, and fix it. And this all needs to be done automatically!

Health checks are a simple way to let the system know if an instance of your app is working or not working. If an instance of your app is not working, then other services should not access it or send a request to it. Instead, requests should be sent to another instance of the app that is ready, or retried at a later time. The system should also bring your app back to a healthy state.

By default, Kubernetes starts to send traffic to a pod when all the containers inside the pod start, and restarts containers when they crash. While this can be “good enough” when you are starting out, you can make your deployments more robust by creating custom health checks. Fortunately, Kubernetes make this relatively straightforward, so there is no excuse not to!

In this episode of “Kubernetes Best Practices”, let’s learn about the subtleties of readiness and liveness probes, when to use which probe, and how to set them up in your Kubernetes cluster.

Types of health checks

Kubernetes gives you two types of health checks, and it is important to understand the differences between the two, and their uses.

Readiness
Readiness probes are designed to let Kubernetes know when your app is ready to serve traffic. Kubernetes makes sure the readiness probe passes before allowing a service to send traffic to the pod. If a readiness probe starts to fail, Kubernetes stops sending traffic to the pod until it passes.
Liveness
Liveness probes let Kubernetes know if your app is alive or dead. If you app is alive, then Kubernetes leaves it alone. If your app is dead, Kubernetes removes the Pod and starts a new one to replace it.


How health checks help

Let’s look at two scenarios where readiness and liveness probes can help you build a more robust app.

Readiness
Let’s imagine that your app takes a minute to warm up and start. Your service won’t work until it is up and running, even though the process has started. You will also have issues if you want to scale up this deployment to have multiple copies. A new copy shouldn’t receive traffic until it is fully ready, but by default Kubernetes starts sending it traffic as soon as the process inside the container starts. By using a readiness probe, Kubernetes waits until the app is fully started before it allows the service to send traffic to the new copy.

Liveness
Let’s imagine another scenario where your app has a nasty case of deadlock, causing it to hang indefinitely and stop serving requests. Because the process continues to run, by default Kubernetes thinks that everything is fine and continues to send requests to the broken pod. By using a liveness probe, Kubernetes detects that the app is no longer serving requests and restarts the offending pod.


Type of Probes

The next step is to define the probes that test readiness and liveness. There are three types of probes: HTTP, Command, and TCP. You can use any of them for liveness and readiness checks.

HTTP
HTTP probes are probably the most common type of custom liveness probe. Even if your app isn’t an HTTP server, you can create a lightweight HTTP server inside your app to respond to the liveness probe. Kubernetes pings a path, and if it gets an HTTP response in the 200 or 300 range, it marks the app as healthy. Otherwise it is marked as unhealthy.

You can read more about HTTP probes here.

Command
For command probes, Kubernetes runs a command inside your container. If the command returns with exit code 0, then the container is marked as healthy. Otherwise, it is marked unhealthy. This type of probe is useful when you can’t or don’t want to run an HTTP server, but can run a command that can check whether or not your app is healthy.

You can read more about command probes here.

TCP
The last type of probe is the TCP probe, where Kubernetes tries to establish a TCP connection on the specified port. If it can establish a connection, the container is considered healthy; if it can’t it is considered unhealthy.

TCP probes come in handy if you have a scenario where HTTP probes or command probe don’t work well. For example, a gRPC or FTP service is a prime candidate for this type of probe.

You can read more about TCP probes here.

Configuring the initial probing delay

Probes can be configured in many ways. You can specify how often they should run, what the success and failure thresholds are, and how long to wait for responses. The documentation on configuring probes is pretty clear about the different options and what they do.

However, there is one very important setting that you need to configure when using liveness probes. This is the initialDelaySeconds setting.

As I mentioned above, a liveness probe failure causes the pod to restart. You need to make sure the probe doesn’t start until the app is ready. Otherwise, the app will constantly restart and never be ready!

I recommend using the p99 startup time as the initialDelaySeconds, or just take the average startup time and add a buffer. As your app's startup time gets faster or slower, make sure you update this number.

Conclusion

Most people will tell you that health checks are a requirement for any distributed system, and Kubernetes is no exception. Using health checks gives your Kubernetes services a solid foundation, better reliability, and higher uptime. Thankfully, Kubernetes makes it easy to do!

Introducing Asylo: an open-source framework for confidential computing


Protecting data is the number one consideration when running workloads in the cloud. While cloud infrastructures offer numerous security controls, some enterprises want additional verifiable isolation for their most sensitive workloads—capabilities which have become known as confidential computing. Today we’re excited to announce Asylo (Greek for “safe place”), a new open-source framework that makes it easier to protect the confidentiality and integrity of applications and data in a confidential computing environment.

Asylo is an open source framework for confidential computing


Asylo is an open-source framework and SDK for developing applications that run in trusted execution environments (TEEs). TEEs help defend against attacks targeting underlying layers of the stack, including the operating system, hypervisor, drivers, and firmware, by providing specialized execution environments known as “enclaves”. TEEs can also help mitigate the risk of being compromised by a malicious insider or an unauthorized third-party. Asylo includes features and services for encrypting sensitive communications and verifying the integrity of code running in enclaves, which help protect data and applications.

Previously, developing and running applications in a TEE required specialized knowledge and tools. In addition, implementations have been tied to specific hardware environments. Asylo makes TEEs much more broadly accessible to the developer community, across a range of hardware—both on-premises and in the cloud.
“With the Asylo toolset, Gemalto sees accelerated use of secure enclaves for high security assurance applications in cloud and container environments. Asylo makes it easy to attach container-based applications to securely isolate computations. Combining this with Gemalto’s SafeNet Data Protection On Demand paves the way to build trust across various industry applications, including; 5G, Virtual Network Functions (VNFs), Blockchain, payments, voting systems, secure analytics and others that require secure application secrets. Using Asylo, we envision our customers gaining deployment flexibility across multiple cloud environments and the assurance of meeting strict regulatory requirements for data protection and encryption key ownership.”
— Todd Moore, Senior Vice President of Data Protection at Gemalto
The Asylo framework allows developers to easily build applications and make them portable, so they can be deployed on a variety of software and hardware backends. With Asylo, we supply a Docker image via Google Container Registry that includes all the dependencies you need to run your container anywhere. This flexibility allows you to take advantage of various hardware architectures with TEE support without modifying your source code.

Asylo offers unique benefits over alternative approaches to confidential computing:
  • Ease of use. With Asylo, it’s easy to create apps that take advantage of the security properties of TEEs. You won’t need to learn a completely new programming model, or rewrite your app.
  • Portability and deployment flexibility. Asylo applications do not need to be aware of the intricacies of specific TEE implementations; you can port your apps across different enclave backends with no code changes. Your apps can run on your laptop, a workstation under your desk, a virtual machine in an on-premises server, or an instance in the cloud. We are exploring future backends based on AMD Secure Encryption Virtualization (SEV) technology, Intel® Software Guard Extensions (Intel® SGX), and other industry-leading hardware technologies that could support the same rebuild-and-run portability.
  • Open source. As an open-source framework, everyone can take advantage of confidential computing technology. Keep on the lookout for Asylo’s rapidly-evolving capabilities!

The Asylo roadmap

With Asylo, we can create the next generation of confidential computing applications together with the community. In version 0.2, Asylo offers an SDK and tools to help you develop portable enclave applications. Coming soon, Asylo will also allow you to run your existing applications in an enclave—just copy your app into the Asylo container, specify the backend, rebuild, and run!

We look forward to seeing how you use, build on, and extend Asylo. Your input and contributions will be critical to the success of the project and ensure Asylo grows to support your needs.

Getting started with Asylo

It’s easy to get started with Asylo—simply download the Asylo sources and pre-built container image from Google Container Registry. Be sure to check out the samples in the container, expand on them, or use them as a guide when building your own Asylo apps from scratch.

Check out our quick-start guide, read the documentation, and join our mailing list to take part in the discussion. We look forward to hearing from you on GitHub!

Exploring container security: Using Cloud Security Command Center (and five partner tools) to detect and manage an attack


Editor’s note: This is the sixth in a series of blog posts on container security at Google.

If you suspect that a container has been compromised, what do you do? In today’s blog post on container security, we’re focusing in on container runtime security—how to detect, respond to, and mitigate suspected threats for containers running in production. There’s no one way to respond to an attack, but there are best practices that you can follow, and in the event of a compromise, we want to make it easy for you to do the right thing.

Today, we’re excited to announce that you’ll soon be able to manage security alerts for your clusters in Cloud Security Command Center (Cloud SCC), a central place on Google Cloud Platform (GCP) to unify, analyze and view security data across your organization. Further, even though we just announced Cloud SCC a few weeks ago, already five container security companies have integrated their tools with Cloud SCC to help you better secure the containers you’re running on Google Kubernetes Engine.

With your Kubernetes Engine assets in Cloud SCC, you can view security alerts for your Kubernetes Engine clusters in a single pane of glass, and choose how to best take action. You’ll be able to view, organize and index your Kubernetes Engine cluster assets within each project and across all the projects that your organization is working on. In addition, you’ll be able to associate your container security findings to either specific clusters, container images and/or VM instances as appropriate.

Until then, let’s take a deeper look at runtime security in the context of containers and Kubernetes Engine.

Responding to bad behavior in your containers

Security operations typically includes several steps. For example, NIST’s well known framework includes steps to identify, protect, detect, respond, and recover. In containers, this translates to detecting abnormal behavior, remediating a potential threat, performing forensics after an incident, and enforcing runtime policies in isolated environments such as the new gVisor sandboxed container environment.

But first, how do you detect that a container is acting maliciously? Typically, this requires creating a baseline of what normal behaviour looks like, and using rules or machine learning to detect variation from that baseline. There are many ways to create that initial behavioral baseline (i.e., how a container should act), for example, using kprobes, tracepoints, and eBPF kernel inspection. Deviation from this baseline then triggers an alert or action.

If you do find a container that appears to be acting badly, there are several actions you might want to take, in increasing order of severity:

  • Just send an alert. This notifies your security response team that something unusual had been detected. For example, if security monitoring is relatively new in your environment, you might be worried about having too many false positives. Cloud SCC lets you unify container security signals with other security signals across your organization. With Cloud SCC, you can: see the live monitored state of container security issues in the dashboard; access the details either in the UI or via the API; and set up customer-defined filters to generate Cloud Pub/Sub topics that can then trigger email, SMS, or bugs in Jira.
  • Isolate a container. This moves the container to a new network, or otherwise restricts its network connectivity. For example, you might want to do this if you think one container is being used to perform a denial of service attack on other services.
  • Pause a container, e.g., `gcloud compute instances stop`. This suspends all running processes in the container. For example, if you detect suspected cryptomining, you might want to limit resource use and make a backup prior to further investigation.
  • Restart a container, e.g., `docker restart` or `kubectl delete pod`. This kills and restarts a running container, and resets the current state of the application. For example, if you suspect an attacker has created a foothold in your container, this might be a first step to counter their efforts, but this won’t stop an attacker from replicating an attack—just temporarily remove them.
  • Kill a container, i.e., `docker kill`. This kills a running container, halting all running processes (and less gracefully than `docker stop`). This is typically a last resort for a suspected malicious container.

Analyzing a security incident

After an incident, your security forensics team might step in to determine what really happened, and how they can prevent it the next time around. On Kubernetes Engine, you can look at a few different sources of event information:

  • Security event history and monitoring status in Cloud SCC. You can view the summary status of your assets and security findings in the dashboard, configure alerting and notification to a custom Cloud Pub/Sub topic and then query and explore specific events in detail either via the UI or API.
  • Container logs, kubelet logs, Docker logs, and audit logs in Stackdriver. Kubernetes Engine Audit Logging captures certain actions by default, both in the Kubernetes Engine API (e.g., create cluster, remove nodepool) and in the Kubernetes API (e.g., create a pod, update a DaemonSet).
  • Snapshots. You can snapshot a container’s filesystem in docker with `docker export`.

Announcing our container runtime security partners

To give you the best options for container runtime security on Google Cloud Platform, we’re excited to announce five partners who have already integrated with Cloud SCC: Aqua Security, Capsule8, Stackrox, Sysdig Secure, and Twistlock. These technical integrations allow you to use their cutting-edge security tools with your deployments, and view their findings and recommendations directly in Cloud SCC.

Aqua Security

Aqua’s integration with Cloud SCC provides real-time visibility into container security events and policy violations, including:

  • Inventory of vulnerabilities in container images in Google Container Registry, and alerts on new vulnerabilities
  • Container user security violations, such as privilege escalation attempts
  • Attempts to run unapproved images
  • Policy violations of container network, process, and host resource usage

To learn more and get a demo of Aqua’s integration with Google Cloud SCC, visit aquasec.com/gcp

Capsule8

Capsule8 is a real-time, zero-day attack detection platform purpose-built for modern production infrastructures. The Capsule8 integration with Google delivers continuous security across GCP environments to detect and help shut down attacks as they happen. Capsule8 runs entirely in the customer's Google Compute Engine environment and accounts and only requires a lightweight installation-free sensor running on each Compute Engine instance to stream behavioral telemetry to identify and help shut down zero-day attacks in real-time.

For more information on Capsule8’s integration with GCP, please visit: https://capsule8.com/capsule8-for-google-cloud-platform/

Stackrox

StackRox has partnered with Google Cloud to deliver comprehensive security for customers running containerized applications on Kubernetes Engine. StackRox visualizes the container attack surface, exposes malicious activity using machine learning, and stops attacks. Under the partnership, StackRox is working closely with the GCP team to offer an integrated experience for Kubernetes and Kubernetes Engine users as part of Cloud SCC.

“My current patchwork of security vendor solutions is no longer viable – or affordable – as our enterprise is growing too quickly and cyber threats evolve constantly. StackRox has already unified a handful of major product areas into a single security engine, so moving to containers means positive ROI."

- Gene Yoo, Senior Vice President and Head of Information Security at City National Bank

For more information on StackRox’s integration with GCP, please visit: https://www.stackrox.com/google-partnership

Sysdig Secure

By bringing together container visibility and a native Kubernetes Engine integration, Sysdig Secure provides the ability to block threats, enforce compliance, and audit activity across an infrastructure through microservices-aware security policies. Security events are enriched with hundreds of container and Kubernetes metadata before being sent to Cloud SCC. This brings the most relevant signals to your attention and correlates Sysdig events with other security information sources so you can have a single point of view and the ability to react accordingly at all levels.

"We chose to develop on Google Cloud for its robust, cost-effective platform. Sysdig is the perfect complement because it allows us to effectively secure and monitor our Kubernetes services with a single agent. We're excited to see that Google and Sysdig are deepening their partnership through this product integration.”

- Ashley Penny, VP of infrastructure, Cota Healthcare. 

For more information on Sysdig Secure’s integration with GCP, please visit: https://sysdig.com/gke-monitoring/

Twistlock

Twistlock surfaces cloud-native security intel vulnerability findings, compliance posture, runtime anomalies, and firewall logs directly into Cloud SCC. Customers can use Cloud SCC's big data capabilities to analyze and alert at scale, integrating container, serverless, and cloud-native VM security intelligence alongside other apps and workloads connected to Cloud SCC.

"Twistlock enables us to pinpoint vulnerabilities, block attacks, and easily enforce compliance across our environment, giving our team the visibility and control needed to run containers at scale."

- Anthony Scodary, Co-Founder of Gridspace

For more information on Twistlock’s integration with GCP, please visit: https://twistlock.com/partners/google-cloud-platform

Now you have the tools you need to protect your containers! Safe computing!

And if you’re at KubeCon in Copenhagen, join us at our booth for a demo and discussion around container security.

Announcing Stackdriver Kubernetes Monitoring: Comprehensive Kubernetes observability from the start


If you use Kubernetes, you know how much easier it makes it to build and deploy container-based applications. But that’s only one part of the challenge: you need to be able to inspect your application and underlying infrastructure to understand complex system interactions and debug failures, bottlenecks and other abnormal behavior—to ensure your application is always available, running fast, and doing what it's supposed to do. Up until now, observing a complex Kubernetes environment has required manually stitching together multiple tools and data coming from many sources, resulting in siloed views of system behavior.

Today, we are excited to announce the beta release of Stackdriver Kubernetes Monitoring, which lets you observe Kubernetes in a comprehensive fashion, simplifying operations for both developers and operators.

Monitor multiple clusters at scale, right out of the box

Stackdriver Kubernetes Monitoring integrates metrics, logs, events, and metadata from your Kubernetes environment and from your Prometheus instrumentation, to help you understand, in real time, your application’s behavior in production, no matter your role and where your Kubernetes deployments run.

As a developer, for instance, this increased observability lets you inspect Kubernetes objects (e.g., clusters, services, workloads, pods, containers) within your application, helping you understand the normal behavior of your application, as well as analyze failures and optimize performance. This helps you focus more on building your app and less on instrumenting and managing your Kubernetes infrastructure.

As a Site Reliability Engineer (SRE), you can easily manage multiple Kubernetes clusters in a single place, regardless of whether they’re running on public or private clouds. Right from the start, you get an overall view of the health of each cluster and can drill down and up the various Kubernetes objects to obtain further details on their state, including viewing key metrics and logs. This helps you proactively monitor your Kubernetes environment to prevent problems and outages, and more effectively troubleshoot issues.

If you are a security engineer, audit data from your clusters is sent to Stackdriver Logging where you can see all of the current and historical data associated with the Kubernetes deployment to help you analyze and prevent security exposures.

Works with open source

Stackdriver Kubernetes Monitoring integrates seamlessly with the leading Kubernetes open-source monitoring solution, Prometheus. Whether you want to ingest third-party application metrics, or your own custom metrics, your Prometheus instrumentation and configuration works within Stackdriver Kubernetes Monitoring with no modification.

At Google, we believe that having an enthusiastic community helps a platform stay open and portable. We are committed to continuing our contributions to the Prometheus community to help users run and observe their Kubernetes workloads in the same way, anywhere they want.

To this end, we will expand our current integration with Prometheus to make sure all the hooks we need for our sidecar exporter are available upstream by the time Stackdriver Kubernetes Monitoring becomes generally available.

We also want to extend a warm welcome to Fabian Reinartz, one of the Prometheus maintainers, who has just joined Google as a Software Engineer. We're excited about his future contributions in this space.

Works great alone, plays better together

Stackdriver Kubernetes Monitoring allows you to get rich Kubernetes observability all in one place. When used together with all the other Stackdriver products, you have a powerful toolset that helps you proactively monitor your Kubernetes workloads to prevent failure, speed up root cause analysis and reduce your mean-time-to-repair (MTTR) when issues occur.

For instance, you can configure alerting policies using Stackdriver's multi-condition alerting system to learn when there are issues that require your attention. Or you can explore various other metrics via our interactive metrics explorer, and pursue root cause hypotheses that may lead you to search for specific logs in Stackdriver Logging or inspect latency data in Stackdriver Trace.

Easy to get started on any cloud or on-prem

Stackdriver Kubernetes Monitoring is pre-integrated with Google Kubernetes Engine, so you can immediately use it on your Kubernetes Engine workloads. It can also be integrated with Kubernetes deployments on other clouds or on-prem infrastructure, so you can access a unified collection of logs, events, and metrics for your application, regardless of where your containers are deployed.

Benefits

Stackdriver Kubernetes Monitoring gives you:
  • Reliability: Faster time-to-resolution for issues thanks to comprehensive visibility into your Kubernetes environment, including infrastructure, application and service data. 
  • Choice: Ability to work with any cloud, accessing a unified collection of metrics, logs, and events for your application, regardless of where your containers are deployed.
  • A single source of truth: Customized views appropriate for developers, operators, and security engineers, drawing from a single, unified source of truth for all logs, metrics and monitoring data.
Early access customers have used Stackdriver Kubernetes Monitoring to increase visibility into their Kubernetes environments and simplify operations.
"Given the scale of our business we often have to use multiple tools to help manage the complex environment of our infrastructure. Every second is critical for eBay as we aim to easily connect our millions active buyers with the items they’re looking for. With the early access to Stackdriver Kubernetes Monitoring, we saw the benefits of a unified solution, which helps provide us with faster diagnostics for the eBay applications running on Kubernetes Engine, ultimately providing our customers with better availability and less latency.”

-- Christophe Boudet, Staff Devops, eBay

Getting started with Stackdriver Kubernetes Monitoring 

Stackdriver Kubernetes Monitoring Beta is available for testing in Kubernetes Engine alpha clusters today, and will be available in production clusters as soon as Kubernetes 1.10 rolls out to Kubernetes Engine.

Please help us help you improve your Kubernetes operations! Try Stackdriver Kubernetes Monitoring today and let us know how we can make it better and easier for you to manage your Kubernetes applications. Join our user group and send us your feedback at [email protected]

 To learn more, visit https://cloud.google.com/kubernetes-monitoring/

 And if you’re at KubeCon in Copenhagen join us at our booth for a deep dive demo and discussion

Open-sourcing gVisor, a sandboxed container runtime


Containers have revolutionized how we develop, package, and deploy applications. However, the system surface exposed to containers is broad enough that many security experts don't recommend them for running untrusted or potentially malicious applications.

A growing desire to run more heterogenous and less trusted workloads has created a new interest in sandboxed containers—containers that help provide a secure isolation boundary between the host OS and the application running inside the container.

To that end, we’d like to introduce gVisor, a new kind of sandbox that helps provide secure isolation for containers, while being more lightweight than a virtual machine (VM). gVisor integrates with Docker and Kubernetes, making it simple and easy to run sandboxed containers in production environments.

Traditional Linux containers are not sandboxes

Applications that run in traditional Linux containers access system resources in the same way that regular (non-containerized) applications do: by making system calls directly to the host kernel. The kernel runs in a privileged mode that allows it to interact with the necessary hardware and return results to the application.

With traditional containers, the kernel imposes some limits on the resources the application can access. These limits are implemented through the use of Linux cgroups and namespaces, but not all resources can be controlled via these mechanisms. Furthermore, even with these limits, the kernel still exposes a large surface area that malicious applications can attack directly.

Kernel features like seccomp filters can provide better isolation between the application and host kernel, but they require the user to create a predefined whitelist of system calls. In practice, it’s often difficult to know which system calls will be required by an application beforehand. Filters also provide little help when a vulnerability is discovered in a system call that your application requires.

Existing VM-based container technology

One approach to improve container isolation is to run each container in its own virtual machine (VM). This gives each container its own "machine," including kernel and virtualized devices, completely separate from the host. Even if there is a vulnerability in the guest, the hypervisor still isolates the host, as well as other applications/containers running on the host.

Running containers in distinct VMs provides great isolation, compatibility, and performance, but may also require a larger resource footprint.

Kata containers is an open-source project that uses stripped-down VMs to keep the resource footprint minimal and maximize performance for container isolation. Like gVisor, Kata contains an Open Container Initiative (OCI) runtime that is compatible with Docker and Kubernetes.

Sandboxed containers with gVisor

gVisor is more lightweight than a VM while maintaining a similar level of isolation. The core of gVisor is a kernel that runs as a normal, unprivileged process that supports most Linux system calls. This kernel is written in Go, which was chosen for its memory- and type-safety. Just like within a VM, an application running in a gVisor sandbox gets its own kernel and set of virtualized devices, distinct from the host and other sandboxes.

gVisor provides a strong isolation boundary by intercepting application system calls and acting as the guest kernel, all while running in user-space. Unlike a VM which requires a fixed set of resources on creation, gVisor can accommodate changing resources over time, as most normal Linux processes do. gVisor can be thought of as an extremely paravirtualized operating system with a flexible resource footprint and lower fixed cost than a full VM. However, this flexibility comes at the price of higher per-system call overhead and application compatibility—more on that below.

"Secure workloads are a priority for the industry. We are encouraged to see innovative approaches like gVisor and look forward to collaborating on specification clarifications and making improvements to joint technical components in order to bring additional security to the ecosystem."
— Samuel Ortiz, member of the Kata Technical Steering Committee and Principal Engineer at Intel Corporation
“Hyper is encouraged to see gVisor’s novel approach to container isolation. The industry requires a robust ecosystem of secure container technologies, and we look forward to collaborating on gVisor to help bring secure containers into the mainstream.”
— Xu Wang, member of the Kata Technical Steering Committee and CTO at Hyper.sh

Integrated with Docker and Kubernetes

The gVisor runtime integrates seamlessly with Docker and Kubernetes though runsc (short for "run Sandboxed Container"), which conforms to the OCI runtime API.

The runsc runtime is interchangeable with runc, Docker's default container runtime. Installation is simple; once installed it only takes a single additional flag to run a sandboxed container in Docker:

$ docker run --runtime=runsc hello-world
$ docker run --runtime=runsc -p 3306:3306 mysql

In Kubernetes, most resource isolation occurs at the pod level, making the pod a natural fit for a gVisor sandbox boundary. The Kubernetes community is currently formalizing the sandbox pod API, but experimental support is available today.

The runsc runtime can run sandboxed pods in a Kubernetes cluster through the use of either the cri-o or cri-containerd projects, which convert messages from the Kubelet into OCI runtime commands.

gVisor implements a large part of the Linux system API (200 system calls and counting), but not all. Some system calls and arguments are not currently supported, as are some parts of the /proc and /sys filesystems. As a result, not all applications will run inside gVisor, but many will run just fine, including Node.js, Java 8, MySQL, Jenkins, Apache, Redis, MongoDB, and many more.

Getting started

As developers, we want the best of both worlds: the ease of use and portability of containers, and the resource isolation of VMs. We think gVisor is a great step in that direction. Check out our repo on GitHub to find how to get started with gVisor and to learn more of the technical details behind it. And be sure to join our Google group to take part in the discussion!

If you’re at KubeCon in Copenhagen join us at our booth for a deep dive demo and discussion.


Also check out an interview with the gVisor PM to learn more.


Apigee named a Leader in the Gartner Magic Quadrant for Full Life Cycle API Management for the third consecutive time


APIs are the de-facto standard for building and connecting modern applications. But securely delivering, managing and analyzing APIs, data and services, both inside and outside an organization, is complex. And it’s getting even more challenging as enterprise IT environments grow dependent on combinations of public, private and hybrid cloud infrastructures.

Choosing the right APIs can be critical to a platform’s success. Likewise, full lifecycle API management can be a key ingredient in running a successful API-based program. Tools like Gartner’s Magic Quadrant for Full Life Cycle API Management help enterprises evaluate these platforms so they can find the right one to fit their strategy and planning.

Today, we’re thrilled to share that Gartner has recognized Apigee as a Leader in the 2018 Magic Quadrant for Full Life Cycle API Management. This year, Apigee was not only positioned furthest on Gartner’s “completeness of vision” axis for the third time running, it was also positioned highest in “ability to execute.”

Ticketmaster, a leader in ticket sales and distribution, has used Apigee since 2013. The company uses the Apigee platform to enforce consistent security across its APIs, and to help reach new audiences by making it easier for partners and developers to build upon and integrate with Ticketmaster services.

"Apigee has played a key role in helping Ticketmaster build its API program and bring ‘moments of joy’ to fans everywhere, on any platform," said Ismail Elshareef, Ticketmaster's senior vice president of fan experience and open platform.

We’re excited that APIs and API management have become essential to how enterprises deliver applications in and across clouds, and we’re honored that Apigee continues to be recognized as a leader in its category. Most importantly, we look forward to continuing to help customers innovate and accelerate their businesses as part of Google Cloud.

The Gartner 2018 Magic Quadrant for Full Life Cycle Management is available at no charge here.

To learn more about Apigee, please visit the Apigee website.

This graphic was published by Gartner, Inc. as part of a larger research document and should be evaluated in the context of the entire document. The Gartner document is available from Apigee here.
Gartner does not endorse any vendor, product or service depicted in its research publications, and does not advise technology users to select only those vendors with the highest ratings or other designation. Gartner research publications consist of the opinions of Gartner's research organization and should not be construed as statements of fact. Gartner disclaims all warranties, expressed or implied, with respect to this research, including any warranties of merchantability or fitness for a particular purpose.