By Neha Pattan, Staff Software Engineer; Ines Envid, Product Manager
High availability and redundancy are essential features for a cloud deployment. On Google Cloud Platform (GCP), Alias IPs allow you to configure secondary IPs or IP ranges on your virtual machine (VM) instances, for a secure and highly scalable way to deliver traffic to your applications. Today, we’re excited to announce that you can now dynamically add and remove alias IP ranges for existing, running VMs, so that you can migrate your applications from one VM to another in the event of a software or machine failure.
In the past, you could deploy highly available applications on GCP by using static routes that point to a hosted Virtual IP (VIP), plus adjusting the next-hop VM of that VIP destination based on availability of the application hosting the VM. Now, Alias IP ranges support hot standby availability deployments, including multiple standbys for a single VM (one-to-many), as well as multiple standbys for multiple VMs (many-to-many).
With this native support, you can now rely on GCP’s IP address management capabilities to carve out flexible IP ranges for your VMs. This delivers the following benefits over high-availability solutions that use static routes:
Improved security: Deployments that use Alias IP allow us to apply anti-spoofing checks that validate the source and destination IP, and allow any traffic with any source or destination to be forwarded. In contrast, static routes require that you disable anti-spoof protection for a VM.
Connectivity through VPN / Google Cloud Interconnect: Highly available application VIPs implemented as Alias IP addresses can be announced by Cloud Router via BGP to an on-premises network connected via VPN or Cloud Interconnect. This is important if you are accessing the highly available application from your on-premises data center.
Native access to Google services like Google Cloud Storage, BigQuery and any other managed services from googleapis.com. By using Alias IP, highly available applications get native access to these services, avoiding bottlenecks created by an external NAT proxy.
Let’s take a look at how you can configure floating Alias IPs.
Imagine you need to configure a highly available application that requires machine state to be constantly synced, for example between a database master and slave running on VMs in your network. Using Internal Load Balancing doesn’t help here since the traffic needs to be sent to only one server. With Alias IPs, you can configure your database to run using secondary IPs on the VM's primary network interface. In the event of a failure, you can dynamically switch this IP to be removed from the bad VM and attach it to the new server.
This approach is also be useful if an application in your virtual network needs to be accessed across regions, since Internal Load Balancing currently only supports only in-region access.
You can use Alias IP from the gcloud command line interface.
To migrate 10.10.0.5 from VM-A to VM-B
a) Remove the IP from VM-A
In addition to adding and removing alias IPs from running VMs, you can create up to 10 Alias IP ranges per network interface, including up to seven secondary interfaces attached to other networks.
You can also use Alias IP with applications running within containers and being managed by container orchestration systems such as Kubernetes or Mesos. Click here to learn more about how Kubernetes uses Alias IPs.
Being able to migrate your workloads while they are running goes a long way toward ensuring high availability for your applications. Drop us a line about how you use Alias IPs, and other networking features you’d like to see on GCP.
Today we are excited to announce beta availability of a new family of Google Compute Engine machine types. The n1-ultramem family of memory-optimized virtual machine (VM) instances come with more memory—a lot more! In fact, these machine types offer more compute resources and more memory than any other VM instance that we offer, making Compute Engine a great option for a whole new range of demanding, enterprise-class workloads.
The n1-ultramem machine type allows you to provision VMs with up to 160 vCPUs and nearly 4TB of RAM. The new memory-optimized, n1-ultramem family of machine types are powered by 4 Intel® Xeon® Processor E7-8880 v4 (Broadwell) CPUs and DDR4 memory, so they are ready for your most critical enterprise applications. They come in three predefined sizes:
n1-ultramem-40: 40 vCPUs and 961 GB of memory
n1-ultramem-80: 80 vCPUs and 1922 GB of memory
n1-ultramem-160: 160 vCPUs and 3844 GB of memory
These new machine types expand the breadth of the Compute Engine portfolio with new price-performance options. Now, you can provision compute capacity that fits your exact hardware and budget requirements, while paying only for the resources you use. These VMs are a cost-effective option for memory-intensive workloads, and provide you with the lowest $/GB of any Compute Engine machine type. For full details on machine type pricing, please check the pricing page, or the pricing calculator.
Memory-optimized machine types are well suited for enterprise workloads that require substantial vCPU and system memory, such as data analytics, enterprise resource planning, genomics, and in-memory databases. They are also ideal for many resource-hungry HPC applications.
Incorta is a cloud-based data analytics provider, and has been testing out the n1-ultramem-160 instances to run its in-memory database.
"Incorta is very excited about the performance offered by Google Cloud Platform's latest instances. With nearly 4TB of memory, these high-performance systems are ideal for Incorta's Direct Data Mapping engine which aggregates complex business data in real-time without the need to reshape any data. Using public data sources and Incorta's internal testing, we've experienced queries of three billion records in under five seconds, compared to three to seven hours with legacy systems."
— Osama Elkady, CEO, Incorta
In addition, the n1-ultramem-160 machine type, with nearly 4TB of RAM, is a great fit for the SAP HANA in-memory database. If you’ve delayed moving to the cloud because you have not been able to find big enough instances for your SAP HANA implementation, take a look at Compute Engine. Now you don’t need to keep your database on-premises while your apps move to cloud. You can run both your application and in-memory database in Google Cloud Platform where SAP HANA backend applications will benefit from the ultra-low latency of running alongside the in-memory database.
You can currently launch ultramem VMs in us-central1, us-east1 and europe-west1. Stay up-to-date on additional regions by visiting our available regions and zones page.
Visit the Google Cloud Platform Console and get started today. It’s easy to configure and provision n1-ultramem machine types programmatically, as well as via the console. Visit our SAP page, if you’d like to learn more about running your SAP HANA, in-memory database on GCP with ultramem machine types.
By Steren Giannini, Product Manager, Google Cloud Platform
One of the main benefits of Google App Engine is automatic scaling of your applications. Behind the scenes, App Engine continually monitors your instance capacity and traffic to ensure the appropriate number of instances are running. Today, we are rolling out the next generation scheduler for App Engine standard environment. Our tests show that it delivers better scaling performance and more efficient resource consumption—and lower costs for you.
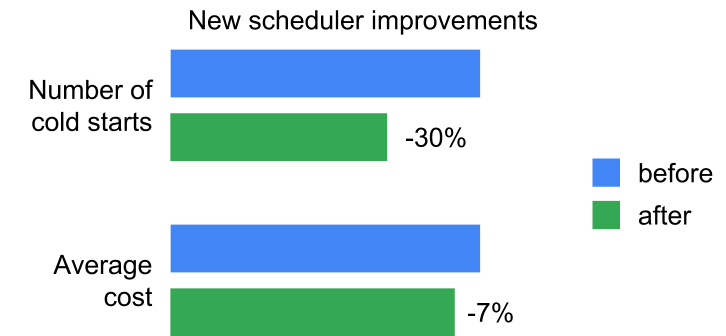
The new App Engine scheduler delivers the following improvements compared to the previous App Engine scheduler:
an average of 5% reduction in median and tail request latencies
an average of 30% reduction of the number of requests seeing a "cold start"
an average of 7% cost reduction
Observed improvements across all App Engine services and customers: blue is the baseline (old scheduler), green is the new scheduler.
In addition, if you need more control over how App Engine runs your applications, the new scheduler introduces some new autoscaling parameters. For example:
Max Instances allows you to cap the total number of instances, and
Target CPU Utilization represents the CPU utilization ratio threshold used to determine if the number of instances should be scaled up or down. Tweak this parameter to optimize between performance and costs.
The new scheduler for App Engine standard environment is generally available and has been rolled out to all regions and all applications. We are very excited about the improvements it brings.
By Dave Stiver, Product Manager, Google Cloud Platform
When we opened the Google Cloud Platform (GCP) Singapore region last year, it launched with two zones. Today, we’re happy to announce a third zone (asia-southeast1-c) and a few new services. This expansion will make it easier for customers, especially in Southeast Asia, to build highly available services that meet the needs of their business.
This is the 46th GCP zone globally, and now all 15 GCP regions have three or more zones. We build every region with the intention of providing at least three zones because we understand the importance of high availability. Customers can distribute their apps and storage across multiple zones to protect against service disruptions.
“It’s super exciting to see the third availability zone go up in Singapore, as more GCP services will be provisioned closer to ASEAN. This will help ensure our customers have the best experience and reliability on our web or mobile products.”
— Nikunj Shanti Patel , Chief Data and Digital Officer
“A year ago we selected Google Cloud as our provider for BBM. A year later, we've migrated BBM to Google's Cloud platform and will leverage the third zone in Singapore to bring Google's innovation closer to our user base in Indonesia."
— Mohan Krishnan, CTO, of Creative Media Works, the company that runs BBM Messenger Consumer globally.
"With services such as Cloud SQL being made available, the third zone in Singapore will enable us to deliver the best viewing experience to our massive user base in this region. Since our engineering team is also located here, we can leverage the new services and bring further innovation to our platform at a faster pace."
— Alex Chan, SVP of Product and Engineering, Viki
Resources
For the latest on availability of services from this region as well as additional regions and services, visit our locations page. For guidance on how to build and create highly available applications, take a look at our zones and regions page. Watch this webinar to learn more about how we bring GCP closer to you. Give us a shout to request early access to new regions and help us prioritize what we build next.
We’re excited to see what you’ll build next on GCP!
When preparing to migrate a legacy system to a cloud-based data analytics solution, as engineers we often focus on the technical benefits: Queries will run faster, more data can be processed and storage no longer has limits. For IT teams, these are significant, positive developments for the business. End users, though, may not immediately see the benefits of this technology (and internal culture) change. For your end users, running macros in their spreadsheet software of choice or expecting a query to return data in a matter of days (and planning their calendar around this) is the absolute norm. These users, more often than not, don’t see the technology stack changes as a benefit. Instead, they become a hindrance. They now need to learn new tools, change their workflows and adapt to the new world of having their data stored more than a few milliseconds away—and that can seem like a lot to ask from their perspective.
It’s important that you remember these users at all stages of a migration to cloud services. I’ve worked with many companies moving to the cloud, and I’ve seen how easy it is to forget the end users during a cloud migration, until you get a deluge of support tickets letting you know that their tried-and-tested methods of analyzing data no longer work. These added tickets increase operational overhead on the support and information technology departments, and decrease the number of hours that can be spent on doing the useful, transformative work—that is, analyzing the wealth of data that you now have available. Instead, you can end up wasting time trying to mold these old, inconvenient processes to fit this new cloud world, because you don’t have the time to transform into a cloud-first approach.
There are a few essential steps you can take to successfully move your enterprise users to this cloud-first approach.
1. Understand the scope
There are a few questions you should ask your team and any other teams inside your organization that will handle any stored or accessed data.
Where is the data coming from?
How much data do we process?
What tools do we use to consume and analyse the data?
What happens to the output that we collect?
When you understand these fundamentals during the initial scoping of a potential data migration, you’ll understand the true impact that such a project will have on those users consuming the affected data. It’s rarely as simple as “just point your tool at the new location.” A cloud migration could massively increase expected bandwidth costs if the tools aren’t well-tuned for a cloud-based approach—for example, by downloading the entire data set before analyzing the required subset.
To avoid issues like this, conduct interviews with the teams that consume the data. Seek to understand how they use and manipulate the data they have access to, and how they gain access to that data in the first place. This will all need to be replicated in the new cloud-based approach, and it likely won’t map directly. Consider using IAM unobtrusively to grant teams access to the data they need today. That sets you up to expand this scope easily and painlessly in the future. Understand the tools in use today, and reach out to vendors to clarify any points.. Don’t assume a tool does something if you don’t have documentation and evidence. It might look like the tool just queries the small section of data it requires, but you can’t know what’s going on behind the scenes unless you wrote it yourself!
Once you’ve gathered this information, develop clear guidelines for what new data analytics tooling should be used after a cloud migration, and whether it is intended as a substitute or a complement to the existing tooling. It is important to be opinionated here. Your users will be looking to you for guidance and support with new tooling. Since you’ll have spoken to them extensively beforehand, you’ll understand their use cases and can make informed, practical recommendations for tooling. This also allows you to scope training requirements. You can’t expect users to just pick up new tools and be as productive as they had been right away. Get users trained and comfortable with new tools before the migration happens.
2. Establish champions
Teams or individuals will sometimes stand against technology change. This can be for a variety of reasons, including worries over job security, comfort with existing methods or misunderstanding of the goals of the project. By finding and utilizing champions within each team, you’ll solve a number of problems:
Training challenges. Mass training is impersonal and can’t be tailored per team. Champions can deliver custom training that will hit home with their team.
Transition difficulties. Individual struggles by team can be hard to track and manage. By giving each team a voice through their champion, users will feel more involved in the project, and their issues are more likely to be addressed, reducing friction in the final stages.
Overloaded support teams. Champions become the voice of the project within the team too. This can have the effect of reducing support workload in the days, weeks and months during and after a migration, since the champion can be the first port of call when things aren’t running quite as expected.
Don’t underestimate the power of having people represent the project on their own teams, rather than someone outside to the team proposing change to an established workflow. The former is much more likely to be favorably received.
3. Promote the cloud transformation
It is more than likely that the current methods of data ingestion and analysis, and possibly the methods of data output and storage, will be suboptimal, or worse impossible, under the new cloud model. It is important that teams are suitably prepared for these changes. To make the transition easier, consider taking these approaches to informing users and allowing them room to experiment.
Promote and develop the understanding of having the power of the cloud behind the data. It’s an opportunity to ask questions of data that might otherwise have been locked away before, whether behind time constraints, or incompatibility with software, or even a lack of awareness that the data was even available to query. By combining data sets, can you and your teams become more evidential, and get better results that answer deeper, more important questions? Invariably, the answer is yes.
In the case that an existing tool will continue to be used, it will be invaluable to provide teams with new data locations and instructions for reconfiguring applications. It is important that this is communicated, whether or not the change will be apparent to the user. Undoubtedly, some custom configuration somewhere will break, but you can reduce the frustration of an interruption by having the right information available.
By having teams develop and build new tooling early, rather than during or after migration, you’ll give them the ability to play with, learn and develop the new tools that will be required. This can be on a static subset of data pulled from the existing setup, creating a sandbox where users can analyze and manipulate familiar data with new tools. That way, you’ll help drive driving the adoption of new tools early and build some excitement around them. (Your champions are a good resource for this.)
Throughout the process of moving to cloud, remember the benefits that shouldn’t be understated. No longer do your analyses need to take days. Instead, the answers can be there when you need them. This frees up analysts to create meaningful, useful data, rather than churning out the same reports over and over. It allows consumers of the data to access information more freely, without needing the help of a data analyst, by exposing dashboards and tools. But these high-level messages need to be supplemented with the personal needs of the team—show them the opportunities that exist and get them excited! It’ll help these big technological changes work for the people using the technology every day.
By Tim Allclair, Software Engineer, Google Kubernetes Engine, and Maya Kaczorowski, Product Manager, Security & Privacy
Editor’s note: This is the seventh in a series of blog posts on container security at Google.
To conclude our blog series on container security, today’s post covers isolation, and when containers are appropriate for actually, well... containing. While containers bring great benefits to your development pipeline and provide some resource separation, they were not designed to provide a strong security boundary.
The fact is, there are some cases where you might want to run untrusted code in your environment. Untrusted code lives on a spectrum. On one end you have known bad malware that an engineer is trying to examine and reverse-engineer; and on the other end you might just have a third-party application or tool that you haven't audited yourself. Maybe it’s a project that historically had vulnerabilities and you aren’t quite ready to let it loose in your environment yet. In each of these cases, you don’t want the code to affect the security of your own workloads.
With that said, let’s take a look at what kind of security isolation containers do provide, and, in the event that it’s not enough, where to look for stronger isolation.
Hypervisors provide a security boundary for VMs
Traditionally, you might have put this untrusted code in its own virtual machine, relying on the security of the hypervisor to prevent processes from escaping or affecting other processes. A hypervisor provides a relatively strong security boundary—that is, we don’t expect code to be able to easily cross it by breaking out of a VM. At Google, we use the KVM hypervisor, and put significant effort into ensuring its security.
The level of trust you require for your code is all relative. The more sensitive the data you process, the more you need to be able to trust the software that accesses it. You don’t treat code that doesn’t access user data (or other critical data) the same way you treat code that does—or that’s in the serving path of active user sessions, or that has root cluster access. In a perfect world, you access your most critical data with code you wrote, reviewed for security issues, and ran some security checks against (such as fuzzing). You then verify that all these checks passed before you deploy it. Of course, you may loosen these requirements based on where the code runs, or what it does—the same open-source tool might be insufficiently trusted in a hospital system to examine critical patient information, but sufficiently trusted in a test environment for a game app you’re developing in your spare time.
A ‘trust boundary’ is the point at which your code changes its level of trust (and hence its security requirements), and a ‘security boundary’ is how you enforce these trust boundaries. A security boundary is a set of controls, managed together across all surfaces, to prevent a process from one trust level from elevating its trust level and affecting more trusted processes or access other users’ data. A container is one such security boundary, albeit not a very strong one. This is because, compared to a hypervisor, a native OS container is a larger, more complex security boundary, with more potential vulnerabilities. On the other hand, containers are meant to be run on a minimal OS, which limits the potential surface area for an attack at the OS level. At Google, we aim to protect all trust boundaries with at least two different security boundaries that each need to fail in order to cross a trust boundary.
Layers of isolation in Kubernetes
Kubernetes has several nested layers, each of which provides some level of isolation and security. Building on the container, Kubernetes layers provide progressively stronger isolation— you can start small and upgrade as needed. Starting from the smallest unit and moving outwards, here are the layers of a Kubernetes environment:
Container (not specific to Kubernetes): A container provides basic management of resources, but does not isolate identity or the network, and can suffer from a noisy neighbor on the node for resources that are not isolated by cgroups. It provides some security isolation, but only provides a single layer, compared to our desired double layer.
Pod: A pod is a collection of containers. A pod isolates a few more resources than a container, including the network. It does so with micro-segmentation using Kubernetes Network Policy, which dictates which pods can speak to one another. At the moment, a pod does not have a unique identity, but the Kubernetes community has made proposals to provide this. A pod still suffers from noisy neighbors on the same host.
Node: This is a machine, either physical or virtual. A node includes a collection of pods, and has a superset of the privileges of those pods. A node leverages a hypervisor or hardware for isolation, including for its resources. Modern Kubernetes nodes run with distinct identities, and are authorized only to access the resources required by pods that are scheduled to the node. There can still be attacks at this level, such as convincing the scheduler to assign sensitive workloads to the node. You can use firewall rules to restrict network traffic to the node.
Cluster: A cluster is a collection of nodes and a control plane. This is a management layer for your containers. Clusters offer stronger network isolation with per-cluster DNS.
Project: A GCP project is a collection of resources, including Kubernetes Engine clusters. A project provides all of the above, plus some additional controls that are GCP-specific, like project-level IAM for Kubernetes Engine and org policies. Resource names, and other resource metadata, are visible up to this layer.
There’s also the Kubernetes Namespace, the fundamental unit for authorization in Kubernetes. A namespace can contain multiple pods. Namespaces provide some control in terms of authorization, via namespace-level RBAC, but don’t try to control resource quota, network, or policies. Namespaces allow you to easily allocate resources to certain processes; these are meant to help you manage how you use your resources, not necessarily prevent a malicious process from escaping and accessing another process’ resources.
Diagram 1: Isolation provided by layer of Kubernetes
Recently, Google also announced the open-source gVisor project, which provides stronger isolation at the pod level.
Sample scenario: Multi-tenant SaaS workload
In practice, it can be hard to decide what isolation requirements you should have for your workload, and how to enforce them—there isn’t a one-size-fits-all solution. Time to do a little threat modeling.
A common scenario we hear, is a developer building a multi-tenant SaaS application running in Kubernetes Engine, in order to help manage and scale their application as needed to meet demand. In this scenario, let’s say we have a SaaS application running its front-end and back-end on Kubernetes Engine, with a back-end database for transaction data, and a back-end database for payment data; plus some open-source code for critical functions such as DNS and secret management.
You might be worried about a noisy (or nosy!) neighbor—that someone else is monopolizing resources you need, and you’re unable to serve your app. Cryptomining is a trendy attack vector these days, and being able to stay up and running even if one part of your infrastructure is affected is important to you. In cases like these, you might want to isolate certain critical workloads at the node layer.
You might be worried about information leaking between your applications. Of course Spacely Sprockets knows that you have other customers, but it shouldn’t be able to find out that Cogswell’s Cogs is also using your application—they’re competitors. In this case, you might want to be careful with your naming, and take care to block access to unauthenticated node ports (with NetworkPolicy), or isolate at the cluster level.
You might also be concerned that critical data, like customer payment data, is sufficiently segmented from access by less trusted workloads. Customer payment data should require different trust levels to access than user-submitted jobs. In this case, you might want to isolate at the cluster level, or run these each in their own sandbox.
So all together, you might have your entire application running in a single project, with different clusters for each environment, and place any highly trusted workload in its own cluster. In addition, you’ll need to make careful resource sharing decisions at the node and pod layers to isolate different customers.
Another common multi-tenant scenario we hear is one where you’re running entirely untrusted code. For example, your users may give you arbitrary code that you run on their behalf. In this case, for a multi-tenant cluster you'll want to investigate sandboxing solutions.
In the end
If you’ve learned one thing from this blog post, it’s that there’s no one right way to configure a Kubernetes environment—the right security isolation settings depend on what you are running, where, who is accessing the data, and how. We hope you enjoyed this series on container security! And while this is the last installment, you can look forward to more information about security best practices, as we continue to make Google Cloud, including Kubernetes Engine, the best place to run containers.
Editor’s note: Today is the fourth installment in a seven-part video and blog series from Google Developer Advocate Sandeep Dinesh on how to get the most out of your Kubernetes environment.
When Kubernetes schedules a Pod, it’s important that the containers have enough resources to actually run. If you schedule a large application on a node with limited resources, it is possible for the node to run out of memory or CPU resources and for things to stop working!
It’s also possible for applications to take up more resources than they should. This could be caused by a team spinning up more replicas than they need to artificially decrease latency (hey, it’s easier to spin up more copies than make your code more efficient!), to a bad configuration change that causes a program to go out of control and use 100% of the available CPU. Regardless of whether the issue is caused by a bad developer, bad code, or bad luck, what’s important is that you be in control.
In this episode of Kubernetes best practices, let’s take a look at how you can solve these problems using resource requests and limits.
Requests and Limits
Requests and limits are the mechanisms Kubernetes uses to control resources such as CPU and memory. Requests are what the container is guaranteed to get. If a container requests a resource, Kubernetes will only schedule it on a node that can give it that resource. Limits, on the other hand, make sure a container never goes above a certain value. The container is only allowed to go up to the limit, and then it is restricted.
It is important to remember that the limit can never be lower than the request. If you try this, Kubernetes will throw an error and won’t let you run the container.
Requests and limits are on a per-container basis. While Pods usually contain a single container, it’s common to see Pods with multiple containers as well. Each container in the Pod gets its own individual limit and request, but because Pods are always scheduled as a group, you need to add the limits and requests for each container together to get an aggregate value for the Pod.
To control what requests and limits a container can have, you can set quotas at the Container level and at the Namespace level. If you want to learn more about Namespaces, see this previous installment from our blog series!
Let’s see how these work.
Container settings
There are two types of resources: CPU and Memory. The Kubernetes scheduler uses these to figure out where to run your pods.
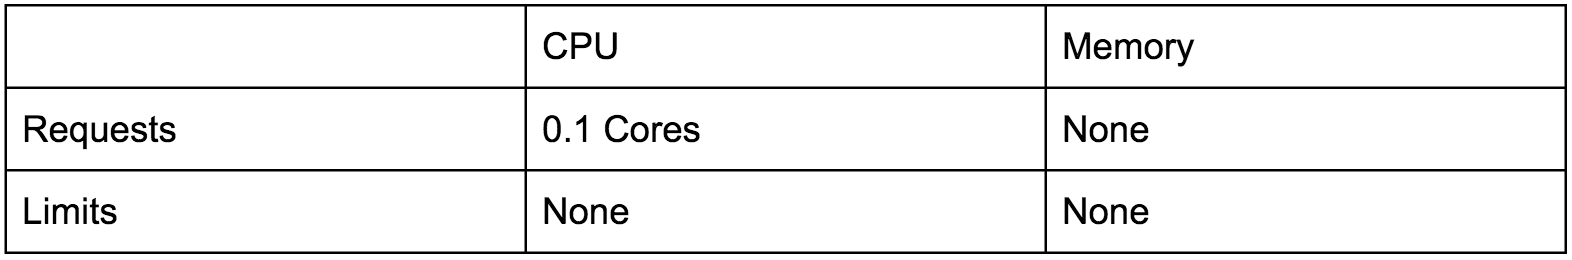
If you are running in Google Kubernetes Engine, the default Namespace already has some requests and limits set up for you.
These default settings are okay for “Hello World”, but it is important to change them to fit your app.
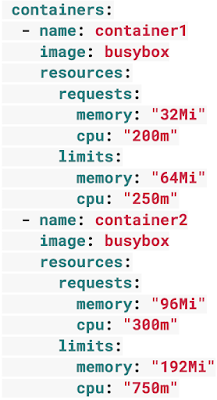
A typical Pod spec for resources might look something like this. This pod has two containers:
Each container in the Pod can set its own requests and limits, and these are all additive. So in the above example, the Pod has a total request of 500 mCPU and 128 MiB of memory, and a total limit of 1 CPU and 256MiB of memory.
CPU
CPU resources are defined in millicores. If your container needs two full cores to run, you would put the value “2000m”. If your container only needs ¼ of a core, you would put a value of “250m”.
One thing to keep in mind about CPU requests is that if you put in a value larger than the core count of your biggest node, your pod will never be scheduled. Let’s say you have a pod that needs four cores, but your Kubernetes cluster is comprised of dual core VMs—your pod will never be scheduled!
Unless your app is specifically designed to take advantage of multiple cores (scientific computing and some databases come to mind), it is usually a best practice to keep the CPU request at ‘1’ or below, and run more replicas to scale it out. This gives the system more flexibility and reliability.
It’s when it comes to CPU limits that things get interesting. CPU is considered a “compressible” resource. If your app starts hitting your CPU limits, Kubernetes starts throttling your container. This means the CPU will be artificially restricted, giving your app potentially worse performance! However, it won’t be terminated or evicted. You can use a liveness health check to make sure performance has not been impacted.
Memory
Memory resources are defined in bytes. Normally, you give a mebibyte value for memory (this is basically the same thing as a megabyte), but you can give anything from bytes to petabytes.
Just like CPU, if you put in a memory request that is larger than the amount of memory on your nodes, the pod will never be scheduled.
Unlike CPU resources, memory cannot be compressed. Because there is no way to throttle memory usage, if a container goes past its memory limit it will be terminated. If your pod is managed by a Deployment, StatefulSet, DaemonSet, or another type of controller, then the controller spins up a replacement.
Nodes
It is important to remember that you cannot set requests that are larger than resources provided by your nodes. For example, if you have a cluster of dual-core machines, a Pod with a request of 2.5 cores will never be scheduled! You can find the total resources for Kubernetes Engine VMs here.
Namespace settings
In an ideal world, Kubernetes’ Container settings would be good enough to take care of everything, but the world is a dark and terrible place. People can easily forget to set the resources, or a rogue team can set the requests and limits very high and take up more than their fair share of the cluster.
To prevent these scenarios, you can set up ResourceQuotas and LimitRanges at the Namespace level.
ResourceQuotas
After creating Namespaces, you can lock them down using ResourceQuotas. ResourceQuotas are very powerful, but let’s just look at how you can use them to restrict CPU and Memory resource usage.
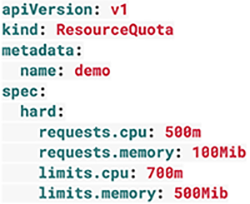
A Quota for resources might look something like this:
Looking at this example, you can see there are four sections. Configuring each of these sections is optional.
requests.cpu is the maximum combined CPU requests in millicores for all the containers in the Namespace. In the above example, you can have 50 containers with 10m requests, five containers with 100m requests, or even one container with a 500m request. As long as the total requested CPU in the Namespace is less than 500m!
requests.memory is the maximum combined Memory requests for all the containers in the Namespace. In the above example, you can have 50 containers with 2MiB requests, five containers with 20MiB CPU requests, or even a single container with a 100MiB request. As long as the total requested Memory in the Namespace is less than 100MiB!
limits.cpu is the maximum combined CPU limits for all the containers in the Namespace. It’s just like requests.cpu but for the limit.
limits.memory is the maximum combined Memory limits for all containers in the Namespace. It’s just like requests.memory but for the limit.
If you are using a production and development Namespace (in contrast to a Namespace per team or service), a common pattern is to put no quota on the production Namespace and strict quotas on the development Namespace. This allows production to take all the resources it needs in case of a spike in traffic.
LimitRange
You can also create a LimitRange in your Namespace. Unlike a Quota, which looks at the Namespace as a whole, a LimitRange applies to an individual container. This can help prevent people from creating super tiny or super large containers inside the Namespace.
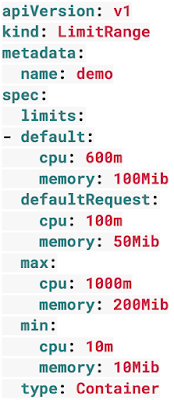
A LimitRange might look something like this:
Looking at this example, you can see there are four sections. Again, setting each of these sections is optional.
The default section sets up the default limits for a container in a pod. If you set these values in the limitRange, any containers that don’t explicitly set these themselves will get assigned the default values.
The defaultRequest section sets up the default requests for a container in a pod. If you set these values in the limitRange, any containers that don’t explicitly set these themselves will get assigned the default values.
The max section will set up the maximum limits that a container in a Pod can set. The default section cannot be higher than this value. Likewise, limits set on a container cannot be higher than this value. It is important to note that if this value is set and the default section is not, any containers that don’t explicitly set these values themselves will get assigned the max values as the limit.
The min section sets up the minimum Requests that a container in a Pod can set. The defaultRequest section cannot be lower than this value. Likewise, requests set on a container cannot be lower than this value either. It is important to note that if this value is set and the defaultRequest section is not, the min value becomes the defaultRequest value too.
The lifecycle of a Kubernetes Pod
At the end of the day, these resources requests are used by the Kubernetes scheduler to run your workloads. It is important to understand how this works so you can tune your containers correctly.
Let’s say you want to run a Pod on your Cluster. Assuming the Pod specifications are valid, the Kubernetes scheduler will use round-robin load balancing to pick a Node to run your workload.
Note: The exception to this is if you use a nodeSelector or similar mechanism to force Kubernetes to schedule your Pod in a specific place. The resource checks still occur when you use a nodeSelector, but Kubernetes will only check nodes that have the required label.
Kubernetes then checks to see if the Node has enough resources to fulfill the resources requests on the Pod’s containers. If it doesn’t, it moves on to the next node.
If none of the Nodes in the system have resources left to fill the requests, then Pods go into a “pending” state. By using Kubernetes Engine features such as the Node Autoscaler, Kubernetes Engine can automatically detect this state and create more Nodes automatically. If there is excess capacity, the autoscaler can also scale down and remove Nodes to save you money!
But what about limits? As you know, limits can be higher than the requests. What if you have a Node where the sum of all the container Limits is actually higher than the resources available on the machine?
At this point, Kubernetes goes into something called an “overcommitted state.” Here is where things get interesting. Because CPU can be compressed, Kubernetes will make sure your containers get the CPU they requested and will throttle the rest. Memory cannot be compressed, so Kubernetes needs to start making decisions on what containers to terminate if the Node runs out of memory.
Let’s imagine a scenario where we have a machine that is running out of memory. What will Kubernetes do?
Note: The following is true for Kubernetes 1.9 and above. In previous versions, it uses a slightly different process. See this doc for an in-depth explanation.
Kubernetes looks for Pods that are using more resources than they requested. If your Pod’s containers have no requests, then by default they are using more than they requested, so these are prime candidates for termination. Other prime candidates are containers that have gone over their request but are still under their limit.
If Kubernetes finds multiple pods that have gone over their requests, it will then rank these by the Pod’s priority, and terminate the lowest priority pods first. If all the Pods have the same priority, Kubernetes terminates the Pod that’s the most over its request.
In very rare scenarios, Kubernetes might be forced to terminate Pods that are still within their requests. This can happen when critical system components, like the kubelet or docker, start taking more resources than were reserved for them.
Conclusion
While your Kubernetes cluster might work fine without setting resource requests and limits, you will start running into stability issues as your teams and projects grow. Adding requests and limits to your Pods and Namespaces only takes a little extra effort, and can save you from running into many headaches down the line!
Continuous integration has become a standard practice across a lot of software development organizations, automatically detecting changes that were committed to your software repositories, running them through unit, integration and functional tests, and finally creating an artifact (JAR, Docker image, or binary). Among continuous integration tools, Jenkins is one of the most popular, and so we created the Compute Engine Plugin, helping you to provision, configure and scale Jenkins build environments on Google Cloud Platform (GCP).
With Jenkins, you define your build and test process, then run it continuously against your latest software changes. But as you scale up your continuous integration practice, you may need to run builds across fleets of machines rather than on a single server. With the Compute Engine Plugin, your DevOps teams can intuitively manage instance templates and launch build instances that automatically register themselves with Jenkins. When Jenkins needs to run jobs but there aren’t enough available nodes, it provisions instances on-demand based on your templates. Once work in the build system has slowed down, the plugin automatically deletes your unused instances, so that you only pay for the instances you need. This autoscaling functionality is an important feature of a continuous build system, which gets a lot of use during primary work hours, and less when developers are off enjoying themselves. For further cost savings, you can also configure the Compute Engine Plugin to create your build instances as Preemptible VMs, which can save you up to 80% on per-second pricing of your builds.
Security is another concern with continuous integration systems. A compromise of this key organizational system can put the integrity of your software at risk. The Compute Engine Plugin uses the latest and most secure version of the Jenkins Java Network Launch Protocol (JNLP) remoting protocol. When bootstrapping the build instances, the Compute Engine Plugin creates a one-time SSH key and injects it into each build instance. That way, the impact of those credentials being compromised is limited to a single instance.
The Compute Engine Plugin lets you configure your build instances how you like them, including the networking. For example, you can:
Disable external IPs so that worker VMs are not publicly accessible
Apply custom network tags for improved placement in firewall rules
The plugin also allows you to attach accelerators like GPUs and Local SSDs to your instances to run your builds faster. You can also configure the plugin to use our wide variety of machine types which match the CPU and memory requirements of your build instance to the workload, for better utilization. Finally, the plugin allows you to configure arbitrary startup scripts for your instance templates, where you can do the final configuration of your base images before your builds are run.
If you use Jenkins on-premises, you can use the Compute Engine Plugin to create an ephemeral build farm in Compute Engine while keeping your Jenkins master and other necessary build dependencies behind your firewall. You can then use this extension of your build farm when you can’t meet demand for build capacity, or as a way to transition your workloads to the cloud in a practical and low-risk way.
Here is an example of the configuration page for an instance template:
Below is a high-level architecture of a scalable build system built with the Jenkins Compute Engine and Google Cloud Storage plugins. The Jenkins administrator configures an IAM service account that Jenkins uses to provision your build instances. Once builds are run, it can upload artifacts to Cloud Storage to archive them (and move them to cheaper storage after a given time threshold).
Jenkins and continuous integration are powerful tools for modern software development shops, and we hope this plugin makes it easier for you to use Jenkins on GCP. For instructions on getting this set up in your Google Cloud project, follow our solution guide.
By Gopal Ashok, Product Manager, Google Cloud Platform
At Redisconf 2018 in San Francisco last month, we announced the public beta of Cloud Memorystore for Redis, a fully-managed in-memory data store service. Today, the public beta is available for everyone to try. Cloud Memorystore provides a scalable, more secure and highly available Redis service fully managed by Google. It’s fully compatible with open source Redis, letting you migrate your applications to Google Cloud Platform (GCP) with zero code changes.
As more and more applications need to process data in real-time, you may want a caching layer in your infrastructure to reduce latency for your applications. Redis delivers fast in-memory caching, support for powerful data structures and features like persistence, replication and pub-sub. For example, data structures like sorted sets make it easy to maintain counters and are widely used to implement gaming leaderboards. Whether it’s simple session caching, developing games played by millions of users or building fast analytical pipelines, developers want to leverage the power of Redis without having to worry about VMs, patches, upgrades, firewall rules, etc.
Early adopters of Cloud Memorystore have been using the service for the last few months and they are thrilled with the service.
"At Descartes Labs, we have long been fans of Redis and its high performance. We have used Redis on everything from storing asynchronous task queues for tens of thousands of CPUs to a centralized persisted key-value pair store for the feature vectors output by our ML models. Cloud Memorystore provides an agile, scalable, no-operations Redis instance that we can instantly provision and scale without administration burdens."
- Tim Kelton, CoFounder and Cloud Architect, Descartes Labs
“Cloud Memorystore has provided us with a highly reliable Redis service and has been powering our critical applications. We have been using Cloud Memorystore as an early adopter and we are impressed with the reliability and performance of the service. Google has helped us forget about our Redis instances with Cloud Memorystore and now we can focus more time on building our applications”
- George-Cristian, Software Developer, MDG
Feature Summary (Beta)
Redis version
3.2.11
Max instance size
300 GB
Max network bandwidth
12 Gbps
High availability with automatic failover
Yes
Memory scaling
Yes
Stackdriver Monitoring and Logging
Yes
Private IP access
Yes
IAM roles
Yes
Availability SLA¹
Yes
On-demand pricing
Yes
¹Applicable for GA release only.
Simple and flexible provisioning
How you choose to deploy Cloud Memorystore for Redis depends on the availability and performance needs of your application. You can deploy Redis as a standalone instance or with a replica to provide high availability. But while replicating a Redis instance provides only data redundancy, you still need to do the heavy lifting of health checking, electing of a primary, client connections on failover, etc. The Cloud Memorystore service takes away all this complexity and makes it easy for you deploy a Redis instance that meets your application’s needs.
Cloud Memorystore provides two tiers of service, Basic and Standard, each with different availability characteristics. Regardless of the tier of service, you can provision a Redis instance as small as 1 GB up to 300 GB. With network throughput up to 12 Gbps, Cloud Memorystore supports applications with very high bandwidth needs.
Here is a summary of the capabilities of each tier:
Feature
Basic Tier
Standard Tier
Max instance size
300 GB
300 GB
Max network bandwidth
12 Gbps
12 Gbps
Stackdriver Monitoring support
Yes
Yes
Memory scaling¹
Yes
Yes
Cross-zone replication
No
Yes
Automatic failover
No
Yes
Availability SLA²
No
99.9%
¹Basic Tier instances experience a downtime and a full cache flush during scaling. Standard Tier instance experience very minimal downtime and loss of some unreplicated data during scaling operation. ²Applicable for GA release only.
Provisioning a Cloud Memorystore instance is simple: just choose a tier, the size you need to support the instance availability and performance needs, and the region. Your Redis instance will be up and running within a few minutes.
“Lift and shift” applications
Once provisioned, using Cloud Memorystore is a breeze. You can connect to the Redis instance using any of the tools and libraries you commonly use in your environment. Cloud Memorystore clients makes use of IP addresses to connect to the instance. Applications always connect to one IP address and Cloud Memorystore ensures the traffic is directed to the primary in case there is a failover.
Other key features
Whether it’s provisioning, monitoring or scaling memory, Cloud Memorystore simplifies common management tasks.
Security
Open-source Redis has very minimal security, and as a developer or administrator, it can be challenging to ensure all Redis instances in your organization are protected. With Cloud Memorystore, Redis instances are deployed using a private IP address, which prevents the instance from being accessed from the internet. You can also use Cloud Identity & Access Management (IAM) roles to ensure granular access for managing the instance. Additionally, authorized networks ensure that the Redis instance is accessible only when connected to the authorized VPC network.
Stackdriver integration
Cloud Memorystore instances publish all the key metrics into Stackdriver, Google Cloud’s monitoring and management suite. You can monitor all of your instances from the Stackdriver dashboard, and use Stackdriver Logging to get more insights about the Redis instances
Seamless memory scaling
When a mobile application goes viral, it may be necessary to provision a larger Redis instance to meet latency and throughput needs. With Cloud Memorystore you can scale up the instance with a few clicks, and the Standard High Availability tier lets you scale the instance with minimal disruption to the application.
On-demand pricing
Cloud Memorystore provides on-demand pricing with no upfront cost and has per second billing. Moreover, there is no charge for network traffic coming in and out of a Cloud Memorystore instance. For more information, refer to Cloud Memorystore pricing.
Coming soon to Cloud Memorystore
This Cloud Memorystore public beta release is just a starting point for us. Here is a preview of some of the features that are coming soon.
We are excited about what is upcoming for Cloud Memorystore and we would love to hear your feedback! If you have any requests or suggestions, please let us know through Issue Tracker. You can also join the conversation at Cloud Memorystore discussion group.
Sign up for a $300 credit to try Cloud Memorystore and the rest of GCP. Start with a small Redis instance for testing and development, and then when you’re ready, scale up to serve performance-intensive applications.
Want to learn more? Register for the upcoming webinar on Tuesday, June 26th 9:00 am PT to hear all about Cloud Memorystore for Redis.
By Seth Vargo, Staff Developer Advocate and Liz Fong-Jones, Site Reliability Engineer
Site Reliability Engineering (SRE) and DevOps are two trending disciplines with quite a bit of overlap. In the past, some have called SRE a competing set of practices to DevOps. But we think they're not so different after all.
What exactly is SRE and how does it relate to DevOps? Earlier this year, we (Liz Fong-Jones and Seth Vargo) launched a video series to help answer some of these questions and reduce the friction between the communities. This blog post summarizes the themes and lessons of each video in the series to offer actionable steps toward better, more reliable systems.
1. The difference between DevOps and SRE
It’s useful to start by understanding the differences and similarities between SRE and DevOps to lay the groundwork for future conversation.
The DevOps movement began because developers would write code with little understanding of how it would run in production. They would throw this code over the proverbial wall to the operations team, which would be responsible for keeping the applications up and running. This often resulted in tension between the two groups, as each group's priorities were misaligned with the needs of the business. DevOps emerged as a culture and a set of practices that aims to reduce the gaps between software development and software operation. However, the DevOps movement does not explicitly define how to succeed in these areas. In this way, DevOps is like an abstract class or interface in programming. It defines the overall behavior of the system, but the implementation details are left up to the author.
SRE, which evolved at Google to meet internal needs in the early 2000s independently of the DevOps movement, happens to embody the philosophies of DevOps, but has a much more prescriptive way of measuring and achieving reliability through engineering and operations work. In other words, SRE prescribes how to succeed in the various DevOps areas. For example, the table below illustrates the five DevOps pillars and the corresponding SRE practices:
DevOps
SRE
Reduce organization silos
Share ownership with developers by using the same tools and techniques across the stack
Accept failure as normal
Have a formula for balancing accidents and failures against new releases
Implement gradual change
Encourage moving quickly by reducing costs of failure
Leverage tooling & automation
Encourages "automating this year's job away" and minimizing manual systems work to focus on efforts that bring long-term value to the system
Measure everything
Believes that operations is a software problem, and defines prescriptive ways for measuring availability, uptime, outages, toil, etc.
If you think of DevOps like an interface in a programming language, class SRE implements DevOps. While the SRE program did not explicitly set out to satisfy the DevOps interface, both disciplines independently arrived at a similar set of conclusions. But just like in programming, classes often include more behavior than just what their interface defines, or they might implement multiple interfaces. SRE includes additional practices and recommendations that are not necessarily part of the DevOps interface.
DevOps and SRE are not two competing methods for software development and operations, but rather close friends designed to break down organizational barriers to deliver better software faster. If you prefer books, check out How SRE relates to DevOps (Betsy Beyer, Niall Richard Murphy, Liz Fong-Jones) for a more thorough explanation.
2. SLIs, SLOs, and SLAs
The SRE discipline collaboratively decides on a system's availability targets and measures availability with input from engineers, product owners and customers.
It can be challenging to have a productive conversation about software development without a consistent and agreed-upon way to describe a system's uptime and availability. Operations teams are constantly putting out fires, some of which end up being bugs in developer's code. But without a clear measurement of uptime and a clear prioritization on availability, product teams may not agree that reliability is a problem. This very challenge affected Google in the early 2000s, and it was one of the motivating factors for developing the SRE discipline.
SRE ensures that everyone agrees on how to measure availability, and what to do when availability falls out of specification. This process includes individual contributors at every level, all the way up to VPs and executives, and it creates a shared responsibility for availability across the organization. SREs work with stakeholders to decide on Service Level Indicators (SLIs) and Service Level Objectives (SLOs).
SLIs are metrics over time such as request latency, throughput of requests per second, or failures per request. These are usually aggregated over time and then converted to a rate, average or percentile subject to a threshold.
SLOs are targets for the cumulative success of SLIs over a window of time (like "last 30 days" or "this quarter"), agreed-upon by stakeholders
The video also discusses Service Level Agreements (SLAs). Although not specifically part of the day-to-day concerns of SREs, an SLA is a promise by a service provider, to a service consumer, about the availability of a service and the ramifications of failing to deliver the agreed-upon level of service. SLAs are usually defined and negotiated by account executives for customers and offer a lower availability than the SLO. After all, you want to break your own internal SLO before you break a customer-facing SLA.
SLIs, SLOs and SLAs tie back closely to the DevOps pillar of "measure everything" and one of the reasons we say class SRE implements DevOps.
3. Risk and error budgets
We focus here on measuring risk through error budgets, which are quantitative ways in which SREs collaborate with product owners to balance availability and feature development. This video also discusses why 100% is not a viable availability target.
Maximizing a system's stability is both counterproductive and pointless. Unrealistic reliability targets limit how quickly new features can be delivered to users, and users typically won't notice extreme availability (like 99.999999%) because the quality of their experience is dominated by less reliable components like ISPs, cellular networks or WiFi. Having a 100% availability requirement severely limits a team or developer’s ability to deliver updates and improvements to a system. Service owners who want to deliver many new features should opt for less stringent SLOs, thereby giving them the freedom to continue shipping in the event of a bug. Service owners focused on reliability can choose a higher SLO, but accept that breaking that SLO will delay feature releases. The SRE discipline quantifies this acceptable risk as an "error budget." When error budgets are depleted, the focus shifts from feature development to improving reliability.
As mentioned in the second video, leadership buy-in is an important pillar in the SRE discipline. Without this cooperation, nothing prevents teams from breaking their agreed-upon SLOs, forcing SREs to work overtime or waste too much time toiling to just keep the systems running. If SRE teams do not have the ability to enforce error budgets (or if the error budgets are not taken seriously), the system fails.
Risk and error budgets quantitatively accept failure as normal and enforce the DevOps pillar to implement gradual change. Non-gradual changes risk exceeding error budgets.
4. Toil and toil budgets
An important component of the SRE discipline is toil, toil budgets and ways to reduce toil. Toil occurs each time a human operator needs to manually touch a system during normal operations—but the definition of "normal" is constantly changing.
Toil is not simply "work I don't like to do." For example, the following tasks are overhead, but are specifically not toil: submitting expense reports, attending meetings, responding to email, commuting to work, etc. Instead, toil is specifically tied to the running of a production service. It is work that tends to be manual, repetitive, automatable, tactical and devoid of long-term value. Additionally, toil tends to scale linearly as the service grows. Each time an operator needs to touch a system, such as responding to a page, working a ticket or unsticking a process, toil has likely occurred.
The SRE discipline aims to reduce toil by focusing on the "engineering" component of Site Reliability Engineering. When SREs find tasks that can be automated, they work to engineer a solution to prevent that toil in the future. While minimizing toil is important, it's realistically impossible to completely eliminate. Google aims to ensure that at least 50% of each SRE's time is spent doing engineering projects, and these SREs individually report their toil in quarterly surveys to identify operationally overloaded teams. That being said, toil is not always bad. Predictable, repetitive tasks are great ways to onboard a new team member and often produce an immediate sense of accomplishment and satisfaction with low risk and low stress. Long-term toil assignments, however, quickly outweigh the benefits and can cause career stagnation.
Toil and toil budgets are closely related to the DevOps pillars of "measure everything" and "reduce organizational silos."
5. Customer Reliability Engineering (CRE)
Finally, Customer Reliability Engineering (CRE) completes the tenets of SRE (with the help in the video of a futuristic friend). CRE aims to teach SRE practices to customers and service consumers.
In the past, Google did not talk publicly about SRE. We thought of it as a competitive advantage we had to keep secret from the world. However, every time a customer had a problem because they used a system in an unexpected way, we had to stop innovating and help solve the problem. That tiny bit of friction, spread across billions of users, adds up very quickly. It became clear that we needed to start talking about SRE publicly and teaching our customers about SRE practices so they could replicate them within their organizations.
Thus, in 2016, we launched the CRE program as both a means of helping our Google Cloud Platform (GCP) customers with improving their reliability, and a means of exposing Google SREs directly to the challenges customers face. The CRE program aims to reduce customer anxiety by teaching them SRE principles and helping them adopt SRE practices.
CRE aligns with the DevOps pillars of "reduce organization silos" by forcing collaboration across organizations, and it also closely relates to the concepts of "accepting failure as normal" and "measure everything" by creating a shared responsibility among all stakeholders in the form of shared SLOs.
Looking forward with SRE
We are working on some exciting new content across a variety of mediums to help showcase how users can adopt DevOps and SRE on Google Cloud, and we cannot wait to share them with you. What SRE topics are you interested in hearing about? Please give us a tweet or watch our videos.