Category Archives: Google Analytics Blog

The latest news, tips and resources straight from the Google Analytics team

Google Tag Manager: Announcing Centralized Google Analytics Settings

Google Tag Manager and Tag Manager 360 make it easier than ever to deploy and manage tags for all of your various marketing and measurement tools at scale. Whether you’re doing a basic tag implementation across a single website or a more extensive implementation across a network of sites and apps, Google Tag Manager has your back.

A Better Way to Manage Google Analytics Tags

Measuring websites and apps effectively often requires multiple Google Analytics tags. You may have a basic Universal Analytics pageview tag to measure views of all your content, as well as event tags for clicks on certain buttons, links leading away from your site, form submissions, and so on.

Keeping the settings for all of these tags in sync can be a challenge. You have to ensure your Tracking ID is set correctly and that any custom settings are consistent. Making changes to things like Custom Dimensions and Metrics across multiple tags can require repetitive work or cumbersome workarounds.

That’s why we’re excited to announce that rolling out this week, Universal Analytics tags in Web and Mobile* containers will support a new feature: Google Analytics Settings Variables.

A Google Analytics Settings Variable acts as a central location to configure sets of Google Analytics settings for use across multiple tags. Instead of having to enter your Google Analytics settings over and over again in each new Universal Analytics tag, you’ll simply be able to select (or create) a Google Analytics Settings Variable to apply to the tag:


With this enhanced workflow, you can focus on what you want to measure, rather than what settings you need to enter. If your organization has an analytics team or works with a Google Analytics Certified Partner, you can leave the settings to the experts without fear that you’ll mess things up.

You can have as many Settings Variables as you’d like for different combinations of settings, and it’s easy to override specific fields in a given tag with the click of a checkbox.

While this feature will appear in all Universal Analytics tags, existing tags will of course continue to work. And, if you so choose, you can continue to set up your tags without use of Google Analytics Settings Variables by checking the override box without selecting a Settings Variable.

We hope that Google Analytics Settings Variables will save you time, reduce errors, and give you more confidence in setting up Google Analytics through Google Tag Manager.

Want to learn more about Centralized Google Analytics Settings? Check out our Quick Tip video or visit our help center!

*Only available in iOS and Android containers implemented with Firebase.

The New Google Analytics Home: Know Your Data

We’ve been improving Google Analytics with the goal of making it even easier for anyone to gain the insights they need. Last year, we introduced a fully redesigned mobile app for better insights on the go (which has now been downloaded over a million times!). We then introduced automated insights in the mobile app. Most recently, we simplified our web UI.


Today we're introducing additional enhancements designed to help you make better data-driven decisions based on a deeper understanding of your users.


A New Home


The first thing you'll notice when you sign into your account is that we've introduced a new landing page.


Screen Shot 2017-04-18 at 9.13.41 PM.png


The “Home” page in Google Analytics now offers an overview of key aspects of your business’ online presence. Here are a few highlights:


  • You can see snippets from a curated set Google Analytics reports, including real time data, with simple and streamlined controls.
  • Each snippet is preceded by a helpful question that frames the data, such as “When do your users visit?” or “Where do your users come from?”.
  • Want to dig deeper? Hover on any data point for more details or drill into the relevant report with the provided link on each card.
  • “Home” is automatically configured based on your setup: For example, if you have Goals or Ecommerce, you’ll see the page change accordingly.


Artboard.png


This is a new page in Google Analytics. Existing reports have not changed. The Audience Overview report, which used to be the default landing page, is still available: just open the “Audience” section in the side navigation and click on "Overview".


Discover


Looking for the latest enhancements to the basic Google Analytics experience? You'll find them in our new “Discover” page.


Nav Placement 1.png


As the name suggests, Discover offers products and experiences that you might find useful as you work with your Google Analytics account. These could be products like Google Optimize, tools like the Google Analytics mobile app, helpful features like Custom Alerts, or even useful educational materials from the Analytics Academy.


Look for the new Discover link just next to the Admin link at the bottom of your left navigation.


Both of these additions will be rolling out to all users over the next few weeks. We hope these new additions help make it easier for you to get the most out of Google Analytics.


Introducing Marketing Mix Model Partners: Helping brands better understand the impact of their marketing

The following was originally posted on the Google Agency Blog.

CMOs and marketing executives use marketing mix models to understand how their marketing investments are driving sales and how to optimize their spend across multiple brands, channels, and regions. With rising investment in digital and mobile advertising, marketers want to be sure the models they use correctly value the impact of these channels.

Today we’re excited to announce a program to help marketing mix model providers better incorporate Google media data into their services. The Marketing Mix Model Partners program is designed to ensure advertisers can accurately measure the ROI of their digital investments and confidently understand the digital drivers of ROI to improve returns year-over-year.

The Marketing Mix Model Partners program offers:
  • Data Access: Partners get access to accurate, granular campaign data across all relevant Google video, display, and search media in a standardized format. We’re also making the data easier to access by providing data from multiple properties, like Search and YouTube, in one centralized location. 
  • Expertise: Partners also get dedicated training, resources, and specialists to better understand Google advertising products and practices and incorporate digital data into their model methodologies. 
  • Actionability: We provide Google account and technical teams to help advise on results and strategies designed to understand the drivers of ROI and improve returns over time. 
Our partners

We’re excited to be working with the initial participants in the program, Marketing Management Analytics, Neustar MarketShare, and Nielsen. Google customers can talk with their Google representatives about working with one of these partners on using Google data in their marketing mix model engagements.

Here’s what our partners have to say about the program:

“The ability to collect and analyze digital data at extremely granular levels enables both marketers and their advertising partners to more successfully measure, predict and action the most effective and profitable means of optimizing each digital channel to achieve their business objectives. We are excited that Google has taken such a proactive approach in working with MMA and analytic companies within the marketplace in providing such a high level of objectivity and transparency."
— Patrick Cummings, CEO of Marketing Management Analytics 
“Today’s measurement solutions need to be connected, always on and incorporate the myriad of channels, as well as critical econometric externalities in order for marketers to truly get an accurate view of marketing’s impact. We are thrilled to be a Google launch partner as this signals our commitment to helping brands understand how their marketing investments are driving business results. Through this partnership our advanced analytics models will incorporate more accurate, granular data, giving marketers a more complete understanding of the effectiveness of their marketing and how best to optimize their spend to improve future outcomes.”
— Julie Fleischer, Vice President, Product Marketing, Marketing Solutions, Neustar 
"As the marketing landscape rapidly evolves, it is critical to use the most robust data-streams in our Marketing Mix models to ensure the highest standard of insight quality. Working with Google, we will have better input and better consultative output so that our advertiser clients can best understand what is driving their performance today and make informed decisions for tomorrow.”
 ‒ Jason Tate, VP of Global Analytics at Nielsen 

As part of our commitment to providing the industry with trusted, transparent, and independent third-party metrics, we’ll be expanding the program over the coming months. If your company provides marketing mix model services and you’re interested in learning more about the partner program, please sign up here.

This is not a test: Google Optimize now free — for everyone

Businesses often have one big question for us: How can they better understand their website visitors and deliver more relevant, engaging experiences?

To help businesses test and take action, last spring we launched our enterprise-class A/B testing and personalization product, Google Optimize 360. We saw great demand, so we made it more accessible with a free beta version last fall — and that response also exceeded our expectations, with over 250,000 users requesting an Optimize account.

Today we're very excited to announce that both Optimize and Optimize 360 are now out of beta. And Optimize is now immediately available to everyone — for free. This is not a test: You can start using it today.

Easy to implement 

A recent survey showed 45% of small and medium businesses don’t optimize their websites through A/B testing.1 The two most common reasons given were a "lack of employee resources" and "lack of knowledge to get started."

If you're part of that 45%, Optimize is a great choice for you. Optimize has many of the same features as Optimize 360. It's just right for small and medium-sized businesses who need powerful testing, but don't have the budget or team resources for an enterprise-level solution. Optimize is easy for anyone to set up. Early users of Optimize have been happy with how easy it is to use. In fact, it's built right on top of Analytics, so if you're already an Analytics user you'll add just a single line of code to get Optimize up and running. With just a few clicks more, you can start using your Analytics data to design experiments and improve the online experience for your users.

Easy to use

Worried about having to hire someone to run A/B tests on your site, or frustrated about not knowing how to do it yourself? Don't be. The Optimize visual editor allows for WYSIWYG (what-you-see-is-what-you-get) editing so you can change just about anything on your site with a drag and a drop. And more advanced users will enjoy the ability to edit raw HTML or add JavaScript or CSS rules directly in the editor.


Powerful targeting capabilities within Optimize allow you to serve the right experiences to just the right set of users. And you have flexible URL targeting capabilities to create simple or complex rules for the pages where you want your experiment to run. To find out if a targeting rule you've set will apply to a specific URL on your site, use the new Optimize URL tester. Just enter a URL and the tester will immediately tell you if that page is a match for your targeting rule.

Easy to understand

Optimize calculates results based on your existing Analytics metrics and objectives using advanced Bayesian methods, so the reporting shows you exactly what you need to know to make better and faster decisions.


We’ve also upgraded the improvement overview (see image above) to help you quickly see how an experiment affects the metrics you care about most, whether that means purchases, pageviews, session lengths, or whatever else you’re tracking in Analytics.

Easy to try 

Leading businesses are building a culture of growth that embraces the use of data and testing to improve the customer experience every day. We’re delighted to offer Optimize to everyone to help deliver better user experiences across the board.

As of today, Optimize is available in over 180 countries. (A special note for our European users: We’ve added a new data processing amendment to the Google Optimize Terms of Service that you may review in the UI and accept if you wish.) And we're not done yet: Keep an eye out for more improvements and announcements in the future.

What are you waiting for? Try it right now!

Happy Optimizing!

1Google Surveys, "Website Optimization Challenges for SMBs," Base: 506 Small/Medium Business Owners and Managers, Google Surveys Audience Panel, U.S., March 2017

Why Your Testing and Optimization Team Needs a Data Storyteller

If a test happens on your website and nobody hears about it, does it make a sound?

Not to get too philosophical, but that's one of the big challenges of building a culture of growth and optimization: getting the word out. That's why a data storyteller is one of the key members of any testing team.

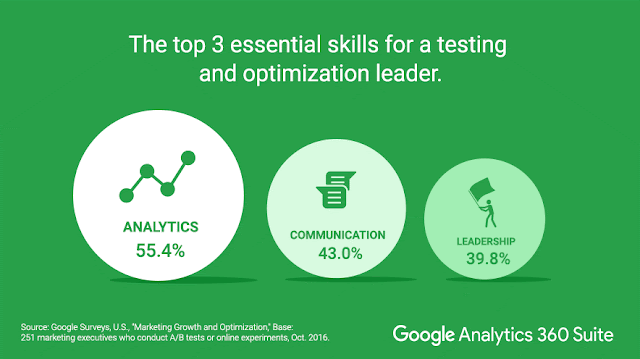
In fact, “communication and data storytelling” was noted as a critical skill for a person who leads testing and optimization efforts, according to a survey of marketing leaders who conduct tests and online experiments.1 The must-have skills rounding out the top three were leadership and, the obvious, analytics.


A data storyteller is part numbers-cruncher, part internal marketer, and part ace correspondent from the testing trenches. He or she is someone who can take the sheer data of testing — the stacks of numbers, the fractional wins and losses, the stream of daily choices — and turn it into a narrative that will excite the team, the office, and (especially) the C-suite.

Storytelling doesn't just mean bragging about successes. It can also mean sharing failures and other less-than-optimal outcomes. The point is not just to highlight wins: it's to reinforce a culture of growth, to generate interest in experimentation, and to explain why testing is so good for the company.

"Our test success rate is about 10%," says Jesse Nichols, Head of Growth for Nest. "We learn something from all our tests, but only one in 10 results in some kind of meaningful improvement." That means that a big part of the data storyteller's job is to keep people interested in testing and show them the value.

Watch our on-demand webinar “Test with success — even when you fail” to hear more testing and optimization tips.


If you're the data storyteller for your team, here are three points to remember:
  • Take the long view.  Gaining support for testing is like rolling a rock up a hill: slow going at first, but once you cross the summit the momentum will take over fast. It takes time, so lay the groundwork with lots of short reports. Don't wait to make formal presentations: Look for chances to drop your message into weekly wrap-ups and other group forums. In short, don’t be afraid to over-communicate. 
  • Be specific. It's better to present one great number than 10 so-so ones. Think mosaic rather than mural: Look for specific stories that can represent your larger efforts and broader plans. 
  • Keep your eye on the bottom line. In the end, that's what it's all about. You may be thrilled that a call-to-action change from "see more" to "learn more" increased clicks by .03%, but what will really get the CMO and other executives interested is moving the profit needle. As a litmus test, ask yourself, “So what?” If your story doesn’t clearly answer the question in terms the audience cares about, consider giving it a rewrite. 
And remember that it won't always be small victories. "The things you're so sure are going to work are the ones that go nowhere," says Jesse. "Then you do a throwaway test and it makes the company an extra $500,000." That's a story that everyone will want to hear.


Download our eBook How to Build a Culture of Growth to learn more best practices on testing and optimization.


1Source: Google Surveys, U.S., "Marketing Growth and Optimization," Base: 251 marketing executives who conduct A/B tests or online experiments, Oct. 2016.

Data Studio: Now create apps, big screen, and docs experiences

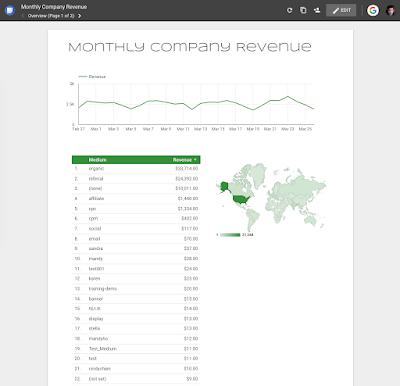
Our vision for Data Studio is to give report creators full control over the viewer experience. Today we’ve added a number of report properties that enable you to create apps, big screen, and document experiences.

App Experience: Auto-hide header, no-margins, left hand nav
Click for full-size image

Big Screen Experience: Auto-hide header, no-margins, 16:9 aspect ratio
Click for full-size image
 Document Experience: Fixed header, margins, custom canvas length
Click for full-size image
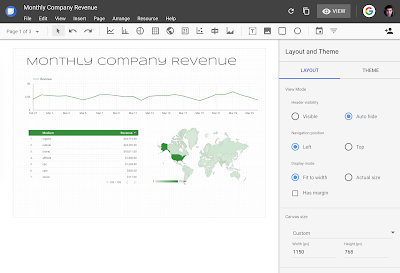
Specifically we’ve added a number of new report properties giving you the ability to control:

  • The visibility of the report header 
  • Using a top or left hand navigation control 
  • Whether to show margins 
  • The height and width of the canvas 
We’ve enabled these features on all reports. To use them, just open or create a new report, unselect all components, and you will see these new report properties.

Click for full-size image
To learn more read the report layout options article in our help center.

We’re excited to see how creators will customize their reports using these features. Let us know how they work for you in the comments.

Post By Nick Mihailovski, Product Manager Data Studio

Join us live on May 23, 2017 as we announce the latest Analytics, DoubleClick and Ads innovations

What: Google Marketing Next keynote live stream
When: Tuesday, May 23, 9:00 a.m. PT/12:00 p.m. ET.
Duration: 1 hour
Where: Here on the Google Analytics Blog

Be the first to hear about Google’s latest marketing innovations, the moment they’re announced. Watch live as my team and I share new Ads, Analytics and DoubleClick innovations designed to improve your ability to reach consumers, simplify campaign measurement and increase your productivity. We’ll also give you a sneak peek at how brands are starting to use the Google Assistant to delight customers.

Register for the live stream here.

Until then, follow us on Twitter, Google+, Facebook and LinkedIn for previews of what’s to come.

Two New Analytics Academy Courses and Year-Round Certification

For three years, many have participated in our free online courses on Analytics Academy, which aim to help you become an analytics expert and learn best practices on how to make your data actionable. In 2013, we started with a single course focused on Digital Analytics Fundamentals, and have since grown our offerings to include Google Tag Manager, Ecommerce and more.

Today, we are introducing two new courses for Analytics Academy: Google Analytics for Beginners and Advanced Google Analytics.


In Google Analytics for Beginners, you will join instructors Justin Cutroni and Krista Seiden to learn the basics of Google Analytics, including how to create an account, implement the code, and set up filters. You'll also learn how to navigate the interface, analyze reports, set up goals, track campaigns, and create dashboards.

Our Advanced Google Analytics course goes in depth on how data gets collected and processed. You’ll learn how to use configurations like Custom Dimensions, Custom Metrics, and Event Tracking. The course also demonstrates advanced techniques, including segmentation, channel reports, audience reports, custom reports, and marketing strategies like remarketing.

Both of these courses include interactive demos and activities to apply what you have learned, using our free Google Analytics Demo Account.

In addition to this pair of new courses, Analytics Academy has added some new features:

• 24/7/365 Certification: You can complete courses at your own pace and earn a certificate of completion at any time. No more certification windows!

• User Profile: You can track your progress and access your certificate from your user profile.

• Track your lesson progress: You can track your progress through a course, and resume a course where you left off. 


Sign up for Google Analytics for Beginners or Advanced Google Analytics and start learning today. 

Happy Analyzing.

Posted by Katie Richardson, Program Manager, Google Analytics

Happy 1st Birthday, Google Analytics 360 Suite! It’s an insights party, everyone’s invited

Time flies (and data mounts) when you’re having fun with measurement. One year ago today, we announced our enterprise suite of marketing measurement and analytics solutions, the Google Analytics 360 Suite. Today we wanted to reflect on this first year. Because, well, a lot has changed. 


Where we started

As marketers know, in today’s mobile-first world, people expect more from brands. They want questions answered quickly, and they want a relevant, engaging experience.

That’s a tall order. So on March 15, 2016, we introduced the world to the Google Analytics 360 Suite, an enterprise measurement solution comprising analytics, tagging, site optimization, data visualization, attribution, and audience management. It helps marketers get more insights — not more data — and deliver more meaningful experiences to customers. Built from the ground up with modern technology and cross-product integrations, it does the heavy lifting for marketers.

Last fall, we welcomed Google Surveys 360 to the suite family, allowing marketers to gauge brand health, get user feedback on site experiences, and understand marketing impact with fast, reliable insights. A great addition to the 360 Suite, Surveys makes getting performance marketing insights and market research to better answer the “why” really easy.


It’s just the beginning: we’re on a journey together

This past year we’ve continued to check in with marketing decision-makers to see what challenges they still face in their data-driven transformations (so we know where to make product enhancements), and here’s what we’re hearing:

  • Building a culture of growth
    Leading marketers are embracing data and testing to continually improve the customer experience — or simply, make a website better — day by day. This growth mindset requires a willingness to experiment. And with that comes the challenge of getting comfortable with failure. Remember: There’s still a lot to be learned from (and celebrate in) a success rate of 1 in 10.
  • Dealing with data
    When we surveyed marketing decision-makers at the end of last year, 61% said they struggled to access or integrate the data they needed in 2016. And 26% of marketers said they didn't have the right analytics talent or enough of it.1 If marketers spend too much time wrangling with data, that means measurement is not always top of mind.
  • Measurement is sometimes an afterthought
    Only 5 out of 10 marketers said they think about measurement while developing campaign strategy.2 When data keeps pouring in, thinking about what campaign information you need to collect may be the last thing on your mind. But if you don't define your measurement goals from the beginning, you may not collect the right data to understand what's working and what isn't.

Big plans for the year ahead

Marketers who rethink measurement for a multi-screen world are reaping the benefits. In fact, leading marketers are 75% more likely than the mainstream to have moved to a more holistic model of measurement in the last two years, according to a recent study from Econsultancy and Google.3 But, getting a handle on all your data can take time. And that’s OK.

Google has some exciting product developments in the works that will help marketers automatically uncover insights and make smarter, faster decisions. In fact, we recently shared an Analytics 360 update that gives our customers the fastest access to the freshest first-party data we've ever offered.

The party’s just getting started. Stay tuned in for another exciting year.

Happy analyzing!

1 Google Surveys, U.S., "2016–2017 Marketing Analytics Challenges and Goals," Base: 203, marketing executives who have analytics or data-driven initiatives, Dec. 2016. 
2 Google Surveys, "Measurement in Campaign Timeline", Base: 1,092 marketing executives, U.S., August 2016. 
3 Econsultancy and Google, Analytics and Measurement Survey, 2016, Base: n=500 marketing and measurement executives at North American companies with over $250MM in revenues

Lessons Learned: Testing and Optimization Tales from the Field

Max van der Heijden is a user experience and conversion specialist at Google who works with companies across Europe, the Middle East, and Africa. Max shares his thoughts about how companies can build a culture of growth and experimentation.


How many times have you launched new features or page designs on your website without testing first?

In an ideal world, companies should test everything before rolling out site changes. But some websites have too little traffic to generate credible results from experiments, and some bugs should just be fixed if they prevent users from achieving their goal. At the very least, analyze your analytics data and use qualitative methods such as user tests and surveys to validate any improvement ideas you have before implementing. If you have the traffic volume: Test!

I’m part of a team at Google that works with advertisers to identify opportunities for improving website user experiences through experiments and testing roadmaps. When our team of UX specialists begins consulting with a new company, the first three things I tell them are:

  1. The possibilities for improvement are enormous. Even if an experiment increases your conversion rate by “just 5%,” you can calculate the positive effect on your revenue.
  2. What works for one may not work for all. No matter how many times we have seen recommendations or “best practices” work on other — maybe even similar — websites, that does not mean it will work for your users or your business.
  3. Expect failures — and learn from them. Testing takes time, and it's hard to know which tests will pay off. Embrace failures and the lessons learned from them.

Making the switch from “get-it-live” mode to a test-and-learn mindset takes time and effort. Leading companies are building a culture of growth: one where people focus on using data and testing to optimize the customer experience day by day. Below are some of the key lessons learned as we work with teams embracing this growth mindset.

Get top-level support

When we first talk with customers, we insist a decision-maker attend our meetings. If there's no support from the top, all of our testing ideas could end up on the shelf collecting dust. Obviously, the marketing executive or CEO won’t have an a-ha moment if you frame testing as a way to improve conversions. The trick is to show how testing impacts a business goal, such as revenue or, better yet, profit. Then the decision-maker will have an ohhh moment: As in, “Ohhh, I knew this was important, but I didn’t think about how a small change could have such a big impact on our bottom line.”

Top-level support will help you get the resources you need and unlock the potential of people already working on experiments. The trend we see is typically one or two persons who start doing the optimizations. They are usually mid-level designers or data analysts who have an affinity for conversion rate optimization, but are often working in a silo.

On the other end of the spectrum, we see companies that have fully bought into the power of experimentation. Multiple customers even have a group of product managers who work on projects with a group of specialists, including a data scientist, copywriter, designer, and even a design psychologist.

Tip: Look for these three types of people to jumpstart a culture of growth in your organization.

Prioritize, prioritize, prioritize

You can't test every idea at once. And prioritization should not be a guessing game.

When we surveyed a group of our EMEA advertisers at a conversion rate optimization event, 38% of the respondents said they use their gut or instinct to prioritize, while 14% allow the HiPPO (highest paid person’s opinion) to call the shots.1 Instead, try using a framework that takes into account past lessons learned and resource requirements.

Map test ideas in a speed-versus-impact grid, and prioritize experiments that are quick to launch and likely to have the biggest impact. Keeping track of all prior test results is another way to ensure past learnings come into play when faced with a HiPPO.

Tip: Start with ideas that will be simple to test and look like they could have the biggest potential impact.


Turn fairweather fans into engaged experimenters

Over time, as you share testing insights and achieve a few wins, more people will jump on board and you’ll need to train people on a repeatable testing framework.

Testing is part of a cycle: What does the data tell you? Did the experiment succeed or fail for every user, or just for a specific segment of users? Analyze your test results, especially from failed experiments, and use those insights to improve the customer experience across your touchpoints. And then conduct another test.

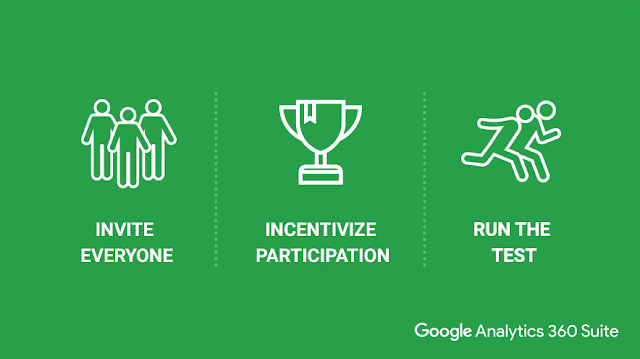
Just as important: How do you keep people excited and engaged in the process? Try using a shared document to invite everyone to submit their improvement suggestions for your website or app. You can even add gamification to this by keeping score of the most impactful ideas. Or, have people guess which test variation will win before you run the test. When you share the results, recognize or reward people who correctly predicted the winner.
Tip: Three ways to get your team engaged with testing and optimization

Feel good about failures

By its very nature, experimentation involves a lot of failure. A typical website might have 10 or 100 or even 1,000 things to test, but it might be that only a small percentage of those tests lead to significant, positive results. Of course, if that one winner leads to a 5% or 10% improvement in conversions, the impact on revenue can be enormous.

When we surveyed EMEA advertisers at one of our events, we found that companies running one to two tests a month had a 51% success rate. But for respondents who said they ran more than 21 tests a month, the success rate decreased to 17%.2

In the beginning, it’s easier to spot areas for improvement and “low-hanging fruit.” The more experiments you run, the more you’ll be focusing on smaller and smaller things. Then, the more you test, the less “successful” you will be. "Our test success rate is about 10%," says Jesse Nichols, Head of Growth at Nest. "But we learn something from all our tests."

Download the guide How to Build a Culture of Growth to learn more about best practices for testing and optimization.

1-2 Source: Conversions@Google 2016 - State of CRO event attendee survey, 145 respondents, EMEA, September 2016.