Author Archives: Maps Devel

Interactive Map of the Paris Metro

Interesting Maps API Components used: Geometry Library, KMLLayer, Styled Maps, Polylines, InfoWindows, Symbols, Markers

This week we are featuring a sample app by the French web development house Medusis. They have put together a custom directions application that guides you between Paris metro stations. It is available in both French and English. It is a beautiful app that uses several interesting features of the Maps API, some of which may not be immediately obvious.

The map is centered, naturally, on the city of Paris. The Paris Metro network is shown using a KMLLayer object. That way they can load in a large amount of unchanging data. You’ll also notice that the base map is styled to mute it to emphasize the metro lines, while preserving access to the Google base map data.


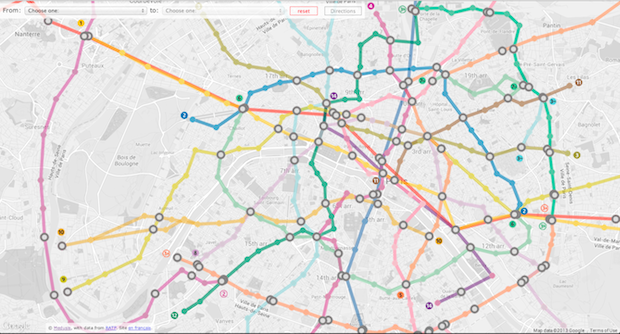
To find directions you can either use the drop down boxes in the top left or simply click on the stations. Notice that a couple of things happen. The KMLLayer that loaded the original layers switches to a grayscale KML file, to allow the use of Polylines to emphasize only the routes needed.


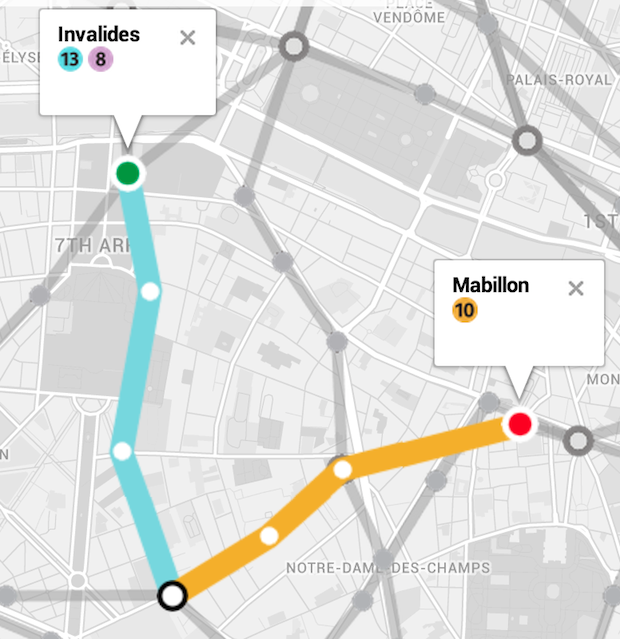
Each station also gets an InfoWindow that has the icons of the Metro lines serving that station. Each trip can be made of more than one Metro line. The portion of the line used in a particular trip is highlighted by using a Polyline. Markers for hubs and the origin and destination are highlighted using a Circle Symbol.


The map uses its own algorithm to compute the best route, using our Geometry Library to calculate distances to find the correct route.

This is a great demonstration piece on using the Google Maps API to show custom data. Well done Medusis.

Posted by Mano Marks, Maps Developer Relations Team


Fab Friday is Custom Made

Another week down, and time for another Fab Friday.


First up this week, I’ve got a video for you. Don’t I always have a video for you? The inimitable Brett Morgan filmed another Maps Shortcut episode, Custom Info Windows in the Google Maps SDK for iOS. Check it out:


Next I have a map for you. August 1st was Swiss National Day, and to celebrate, we have a timeline of when the cantons joined the Confederation.


This timeline is brought to us by Vasile Cotovanu, who also created the Swiss Cantons mercator puzzle, and more. And as usual, all his code is over on Github.


Finally, for you do-gooders, there’s a great event coming up. Apply now for the 2013 Geo for Good User Summit:


Calling all mapping specialists who use their powers for environmental and social good! Apply now for this annual hands-on technical workshop hosted by the Google Earth Outreach team from Nov 12-15 at the Google headquarters in Mountain View, CA: http://geoforgood2013.earthoutreach.org


That’s all for this week. Have a great weekend, and happy mapping!


Posted by Mano Marks, Maps Developer Relations Team

Map of the Week: Hill Mapper San Francisco

Map of the Week: Hill Mapper San Francisco


Hill Mapper San Francisco uses the Elevation API to show how steep streets are in San Francisco.


Streets that go uphill, relative to the current location of the marker, are red, and downhill streets are blue. The opacity of the color represents how steep the hill is.


If you drag around the marker, the Polylines change color, as the marker’s elevation changes the relative elevation of the streets.


It’s particularly powerful if you view it with satellite imagery.


If you want to search for a particular location, the search box uses Places Autocomplete to help you find it.


All around, this is a nice, innovative use of our APIs to show off useful information.

Posted by Mano Marks, Maps Developer Relations Team

Fab Friday is on the Street Again

Hey y’all, it’s Friday again, and Fab Friday is back with a great new video.


It’s high summer in the Northern Hemisphere and you’re going to want to go outdoors. Specifically, on the street. As we announced last week, with the latest version of the Google Maps SDK for iOS you can now include Street View in your app. Brett Morgan from the Maps Developer Relations team produced a Maps Shortcuts episode on this new feature, showing you how easy it is to start. Check it out:


That’s all for this week, see you next week!


Posted by Mano Marks, Maps Developer Relations Team

Map of the Week: Monarch Butterfly Migration Explorer

Why we like it: This is a classic mashup style map, using the Google Maps JavaScript API with the Flickr API to create HeatmapLayers of photos tagged as Monarch Butterflies.


You can see in the 2012 migration season there were many pictures taken of the Monarchs all over and many of them made it up to Canada. And in 2013 that number dropped off considerably, possibly due to the increased use of pesticides.


The map defaults to a satellite map type, but if you click on “Map” it changes to our roadmap map type. You can see the map uses the Google Maps visual refresh.


We really like how this map uses these two APIs to discover and display trends that neither of the APIs were designed to do. We also like the great use of Google Maps for data visualization, and hope we see more from this developer.

Posted by Mano Marks, Maps Developer Relations Team

Fab Friday is Summering

Author Photo

It’s been a while since we posted a Fab Friday post. Naturally, with it being summer and all, I was a little distracted. But it’s not summer in Sydney, and they’ve been busy! You may have seen that we launched Dynamic Maps Engine Layers in the JavaScript Maps API a couple weeks ago. Josh Livni hosted a Maps Live episode on it: Visualizing Maps Engine Data on JavaScript Maps. Check it out:


This week we launched version 1.4 of the Google Maps SDK for iOS. It includes cool new features like Street View, indoor maps, and an updated map style. Check out this Maps Live episode Luke Mahe and I did.


It’s shaping up to be a great summer in the Northern Hemisphere! Thanks Sydney!
Posted by Mano Marks, Maps Developer Relations Team

Map of the Week: Portsmouth History Photo Map


Why we like it: The Portsmouth History Photo Map is a great demonstration of combining old maps and photos with Google Maps.

You start by viewing the 1896 map of Portsmouth on top of a Google Map. The old map is overlayed on top of the Google Map using an ImageMapType.


You can choose to look at standard Google Maps base map by clicking on Modern map, which reverts you to the road map.


The featured markers, such as this one for Charles Dickens, are created using a standard Marker with a custom icon and size.


Instead of the standard InfoWindow, the developer created a Custom Overlay that allows for a more dynamic experience, allowing for a gallery of photos to be displayed in the overlay.


Finally, to control what’s showing on the map, the developer created a custom div that sits on top of the map and controls it with onclick events.


All in all a great custom implementation of our API.

Posted by Mano Marks, Maps Developer Relations Team