Author Archives: Maps Devel

Street View is here! What’s new in the Google Maps Android API v2

The new release of the Google Maps Android API v2 is now available! Read on to find out about Street View and programmatic control of indoor maps available in the Google Play Services 4.4 release.


Street View

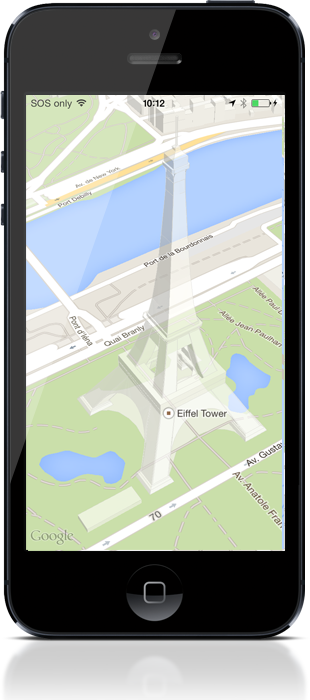
Street View is here! Let your users navigate through Street View's panoramic 360-degree views themselves, or programmatically control the zoom and orientation of the Street View camera. You can enable and disable Street View controls and gestures, as well as toggle the display of street names on or off. The Street View coverage available through the Google Maps Android API v2 is the same as that for the Google Maps for Android app on your Android device. Take a look at these two apps using Street View to help users get even more out of their experience.

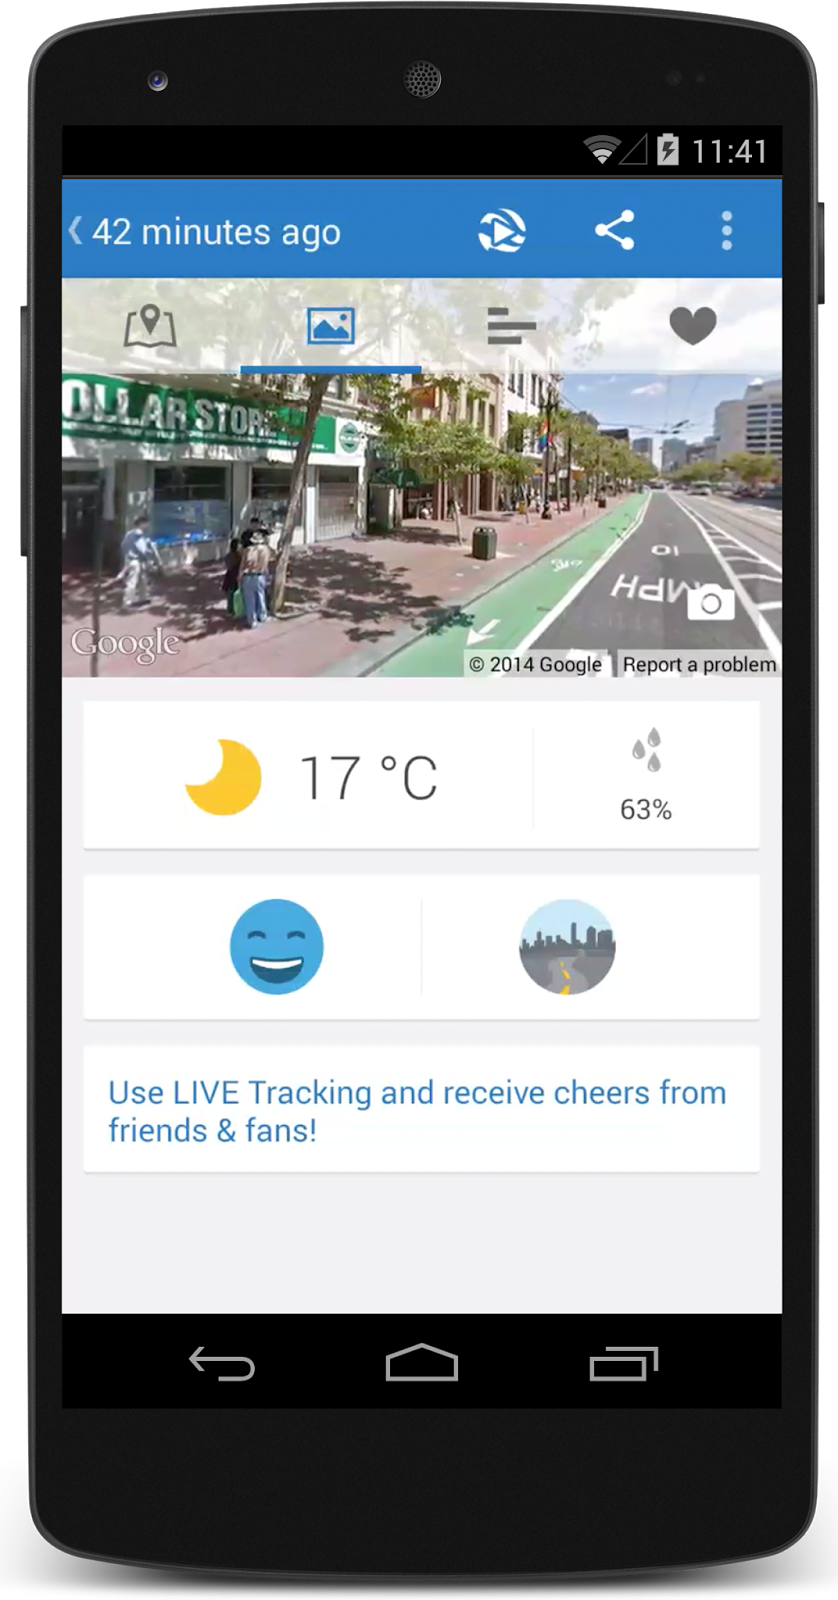
Runtastic Running & Fitness, which helps people map and track their fitness activities, now features Street View. When you review a completed activity, Street View panoramas of places you’ve passed by are presented as a slideshow. You can even go full screen to explore the surroundings of your route in greater detail.


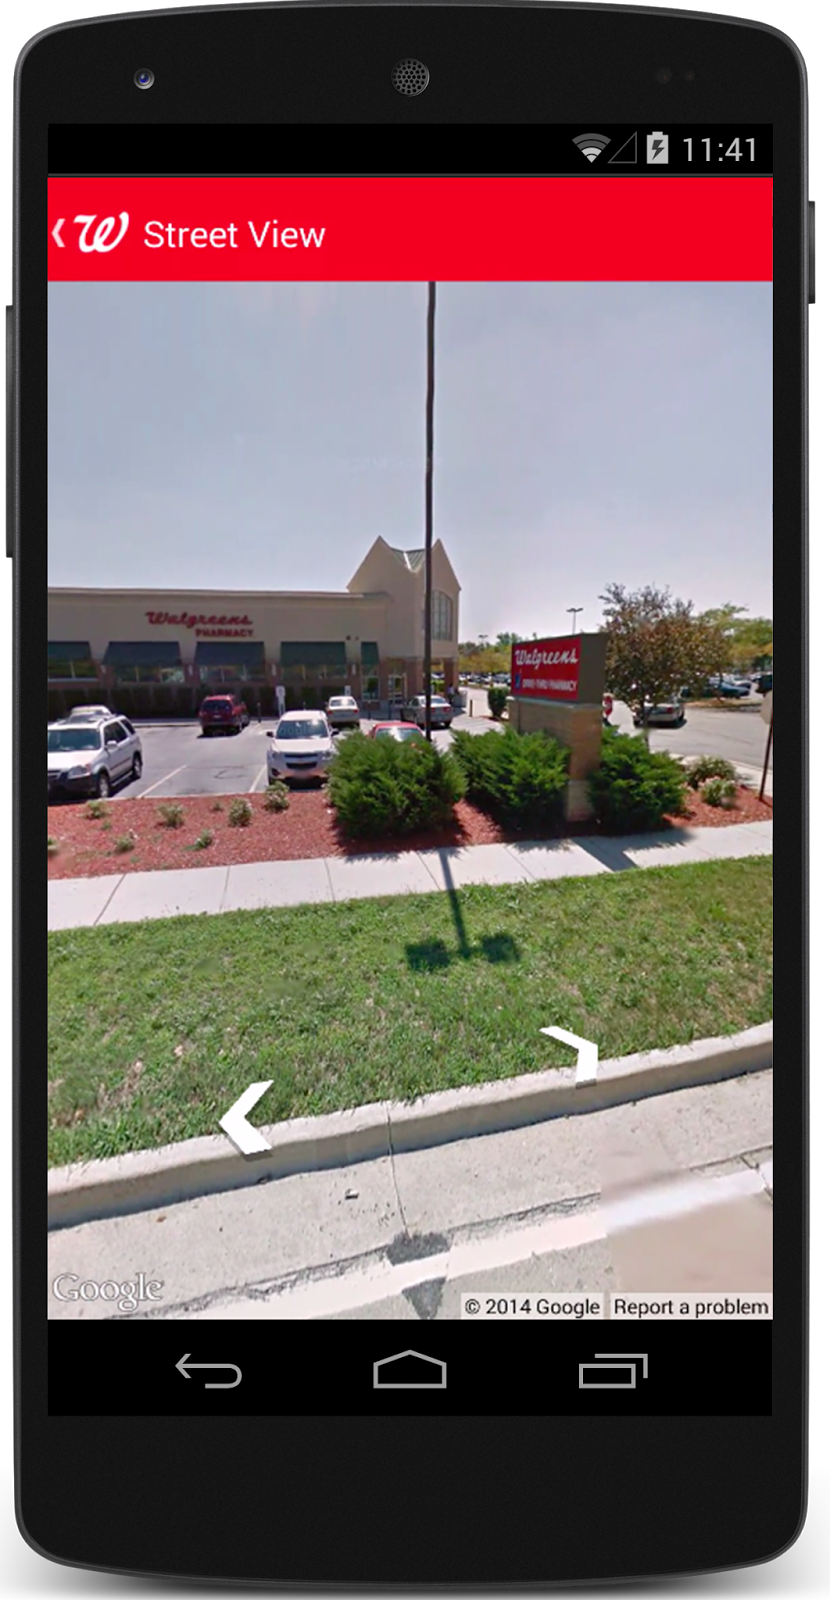
Do you have a store locator in your app, but wish that users could tell whether your store is in a strip mall or on the street? Now you can! You can even bring users into your store using Business View. The same StreetViewPanorama object provides seamless access to both indoor Business View and outdoor Street View imagery.

The Walgreens App has integrated Google Street View with its Store Locator feature, making it easier than ever for Walgreens customers to get in, get out and get on with their day. With the updated Store Locator feature, customers can easily find a Walgreens, access store details and view the store location up close.


Programmatic Control of Indoor Maps

In this release, we’ve added programmatic control to Indoor Maps. You can disable the default level picker (floor picker) by calling setIndoorLevelPickerEnabled(false) and add your own custom level picker instead. You can also determine which building and level is currently in focus and set a listener to be called when a new building comes into focus or a new level is activated within a building. This is particularly useful if you want to show custom markup for the active level.


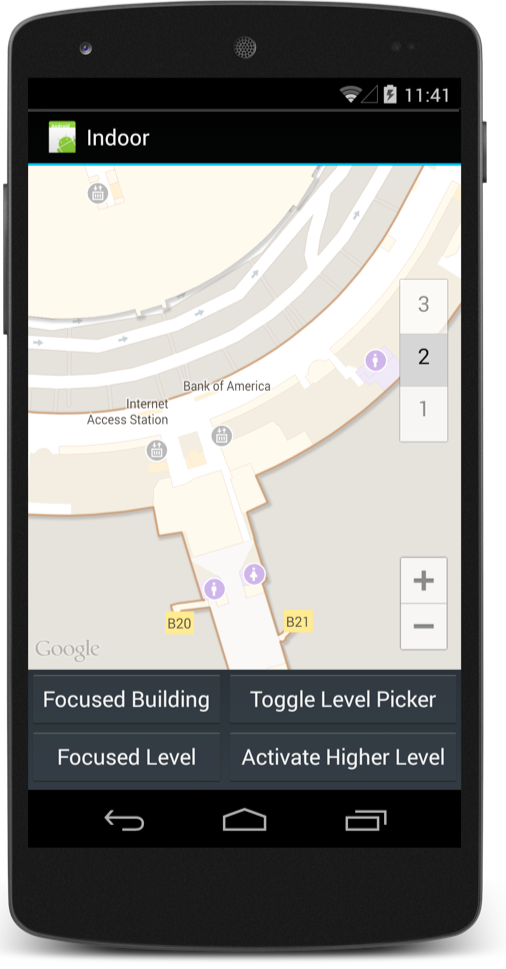
We’re always interested to hear how you’re using Google Maps APIs, so let us know if you’ve got something cool to show by tagging +Google Maps API on your posts (or comment right here). For technical questions that aren’t answered in the developer documentation, check out the Google Maps developer community on Stack Overflow. Don’t forget to tell us what you’d like to see in the next release using the Google Maps API issue tracker.

Posted by Megan Boundey, Product Manager, Google Maps Mobile SDKs

Code School and the Google Maps SDK for iOS

Are you an iOS developer interested in adding a map to your application? The instructional experts at Code School set out to create a course introducing the Google Maps SDK for iOS to developers like you — and they delivered!
Exploring Google Maps for iOS is a free course covering everything from adding a simple map, to using geocoding and directions, to incorporating Street View in iOS. You'll end up with a working sample application and gain the knowledge you need to build your own amazing Google Maps-based apps. Learn from videos, sample code, and Xcode-based coding challenges.
Check out the introduction video below, and then head over to Code School to get started with their interactive course!

You can also read our official developer documentation and reference docs at https://developers.google.com/maps/documentation/ios/.

Build a map infographic with Google Maps & JavaScript

We recently announced the launch of the data layer in the Google Maps JavaScript API, including support for GeoJSON and declarative styling.  Today we’d like to share a technical overview explaining how you can create great looking data visualizations using Google Maps.

Here’s our end goal. Click through to interact with the live version.

Data provided by the Census Bureau Data API but is not endorsed or certified by the Census Bureau.


The map loads data from two sources: the shape outlines (polygons) are loaded from a public Google Maps Engine table and we query the US Census API for the population data.  You can use the controls above the map to select a category of data to display (the "census variable"). The display is then updated to show a choropleth map shading the various US regions in proportion to the values recorded in the census.

How it works

When the map loads, it first queries the Google Maps Engine API to retrieve the polygons defining the US state boundaries and render them using the loadGeoJson method. The controls on the map are used to select a data source and then execute a query against the US Census Data API for the specified variable.  
Note: At the time of writing, the data layer and functions described here require you to use the experimental (3.exp) version of the Maps API.

Loading polygons from Maps Engine

The Maps Engine API's Table.Features list method returns resources in GeoJSON format so the API response can be loaded directly using loadGeoJson. For more information on how to use Maps Engine to read public data tables, check out the developer guide.

The only trick in the code below is setting the idPropertyName for the data that is loaded. When we load the census data we'll need a way to connect it with the Maps Engine data based on some common key. In this case we're using the 'STATE' property.


Importing data from the US Census API

The US Census Bureau provides an API for querying data in a number of ways. This post will not describe the Census API, other than to say that the data is returned in JSON format. We use the state ID, provided in the 2nd column, to look up the existing state data (using the lookupId method of google.maps.Data) and update with the census data (using the setProperty method of google.maps.Data)


Styling the data

Data can be styled through the use of a Data.StyleOptions object or through a function that returns a Data.StyleOptions object. Here we create a choropleth map by applying a gradient to each polygon in the dataset based on the value in the census data.


In addition to the coloring, we've created an interactive element by adding events that respond to mouse activity. When you hover your mouse cursor (or finger) over a region with data, the border becomes heavier and the data card is updated with the selected value.


We’ve also used a custom basemap style in this example to provide some contrast to the colorful data.


Check out Google Maps Engine if you need somewhere to store your geospatial data in the cloud, as we’ve done here. If you have any questions on using these features, check out the docs for the data layer and the Maps Engine API or head over to Stack Overflow and ask there. You can also check out this article’s permanent home, where the interactive version lives.

Posted by Mark McDonald, Google Developer Relations Team


Maps made easier: GeoJSON in the JavaScript Maps API

Maps give us an easy way to visualize all types of information, from patterns in health expenditure across the world, to oceans with the highest concentration of coral reefs at risk. The tools used to create these maps should be just as easy to use. That’s why, starting today, the JavaScript Maps API will support GeoJSON, making it simpler for developers to visualize richer data, with even cleaner code.

GeoJSON has emerged as a popular format for sharing location-based information on the web, and the JavaScript Maps API is embracing this open standard. This means, as a developer, you can now pull raw data from multiple data sources, such as the US Geological Survey or Google Maps Engine, and easily display it on your website.

How does it work? The new Data layer allows you to treat a dataset like… well, a set of data, rather than individual and unrelated features. If you have a GeoJSON file, you can now load it on the map simply by adding a single line of code to your JavaScript:

map.data.loadGeoJSON(‘earthquakes.json’);


Earthquakes over the past week loaded on the map

Tada! And what’s more, most places have attributes beyond just location: stores have opening times, rivers have current speed, and each Girl Guide troop has cookie selling turf. The Data layer allows you to represent all attributes in GeoJSON right on the map and make decisions about what data to display more easily.

You can use this information to create a styling function that says, “show the earthquakes as circles, scaled to their magnitude” and as the data or rules are updated, the styling will automatically be applied to every feature. This beats having to manually update each feature or rule as more information is added to the map.

Earthquakes over the past week, with a styling function applied


Earthquakes over the past week, with additional color and basemap styling applied

Get started by checking out our developer docs, the code for these earthquake maps, this cool demo showing data from different sources, and this Google Developers Live video. This is a new feature, so if you run into problems or think of any additions you’d love to see, get help on StackOverflow and check our support page for the right tags to use.

We’re looking forward to seeing what you build with this new tool and, as always, we’re eager for your feedback. Please comment on this post or on our Google+ Page.

Posted by Jen Kovnats, Product Manager on the Maps API Team

Streamlining code in the JavaScript Maps API

Since the Google Maps JS API v3 launched in 2009, we have added lots of new features. And we’ve also made occasional modifications to the API to minimize and simplify common code pathways for developers.


Today we want to announce two small, but useful, changes we have recently made. The first lessens the amount of code required to create a map. The second evolves the API towards a more standard pattern of using plain JavaScript objects.


The first change was introduced quietly a few versions ago, and made the Map Type an optional parameter (defaulting to the standard ROADMAP type) when instantiating a new map.


The second change is available in versions 3.16 of the API and above, and introduces a new way of creating a location: instead of google.maps.LatLng(37.5, -122.5), you can now simply pass in a plain JavaScript object like {lat: 37.5, lng: -122.5}.


Let’s take a look at how these changes affect the original code from our launch announcement above:


Original:
var myOptions = {
     zoom: 8,
     center: new google.maps.LatLng(-34.397, 150.644),
     mapTypeId: google.maps.MapTypeId.ROADMAP
   };


New
   var myOptions = {
     zoom: 8,
     center: {lat: -34.397, lng: 150.644}
   };


Note that since the order of the values no longer matters, the following is equally valid:
     center: {lng: 150.644, lat: -34.397}
The end result is less code needed to instantiate a basic map, less opportunity for confusion regarding coordinate ordering, and a more flexible way to create locations.


Note that google.maps.LatLng will continue to work, and there’s no need to modify any of your existing code. These new features are simply designed to help those getting started, and help you create more streamlined and readable code.


As always, we love to get feedback on how even minor changes like this affect your workflow. You can comment on this post or on our Google+ Page. And as always, you can get help on StackOverflow. Check out our support page for the right tags to use.

Posted by Josh Livni, Maps API Team

Adding the new Google Maps to your website just got easier with the new Google Maps Embed API

Since we introduced the ability to embed the new Google Maps, a growing number of sites across the web have been helping their visitors visualize and remember places, using maps built for them. However, we know that many sites require multiple maps, and repeatedly generating them can be a challenge.

Today we're making this easier by launching the Google Maps Embed API, giving developers the ability to generate HTML snippets that embed Google Maps within their own website. Using the API to take control of your embedded maps, you can now effortlessly customize the location and appearance of the map with a handful of simple URL parameters.

For example, our friends at the Guggenheim in New York are using the Google Maps Embed API, allowing visitors to save the location to Google Maps directly from the website. Visitors can then quickly plan their day and navigate to the museum by pulling up their saved places on any device with Google Maps.

Over in San Francisco, SFMOMA is using the Google Maps Embed API to show the museum’s temporary exhibit locations. Visitors can get easily get directions to these locations and save them to Google Maps for later viewing on any of their devices.

In addition, over the coming weeks, we’ll be updating existing classic Google Maps embeds to the new format so visitors can enjoy a consistent embedded Google Maps experience across the web. This also means that starting today, the Maps/Earth APIs Terms of Service will apply to all updated embedded Google Maps.

Finally, as with our existing embedded maps, the Google Maps Embed API is free and without limits, and the new API also includes the same on-map ad experience we introduced to embedded maps in November.

To get started, head over to our developers page and embed away!


Fab Friday Android Video Roundup

Author PhotoHey everyone! Last November I moved to Zürich. The chocolate has been so entrancing that I’m falling behind on my Fab Friday posts! The last few weeks have seen a number of Google Android Maps API videos going out, so I thought I’d do a roundup for you.


First up, Paul Saxman worked on a video with the Android team. Let’s take a look at that one first: UXD - What is Context and Why Does it Matter? Nazmul Idris and Paul Saxman distill user research data to show you how people use their devices, what expectations they have from them, and how this changes with their context.


Paul also brings us Getting Started with Markers on Android, where he covers the basics of adding markers to your map using the Google Maps Android API v2.


Next up, we have one from a newcomer to GDLs, Sarah Maddox. Sarah brings you Map Padding in the Google Maps Android API v2. With map padding, you can allow a sidebar or other UI features to hide part of a map, without hiding the Google logo and map UI controls.


Lastly, two of our fantastic interns, Emma Yeap and Iris Uy, worked on additions to the Google Maps Android API Utility Library, and included this video explaining the new and much asked for Heatmap library. Great work!


That’s all for now. Have a great weekend and happy mapping!

Posted by Mano Marks, Google Maps API Team

Marker Clustering and Heatmaps: New features in the Google Maps Android API Utility Library

A new version of the Google Maps Android API Utility Library is now available, which includes some cool new data visualisation features - marker clustering and heatmaps.

Marker Clustering

When you have a lot of data to show, it can be hard to keep your app from becoming cluttered and messy. One solution is to group nearby markers into a single marker (cluster marker). When viewed zoomed in, individual markers are shown. However, as the user zooms out, markers group together into a single cluster marker.

You can also easily customize the appearance of individual and clustered markers.


custom rendering for clusters clustered markers with default look

Left: clustered markers with default look
Right: custom rendering for clusters using the IconGenerator utility

Marker clustering is ideal for visualising a large number of elements on a map whilst minimising clutter. You see a concise summary of your data when zoomed out, and as the markers separate when you zoom in, you don't lose any detail from your data.

Heatmaps

Heatmaps are another new visualisation available in the utility library. Heatmaps represent geospatial data on a map by using different colours to represent areas with different concentrations of points - showing overall shape and concentration trends. Heatmaps are also known as "intensity maps".

For an overview of the heatmaps library, watch the video below:


You can use a heatmap to visualise any data set that has a geospatial component. For example, the below heatmap shows the population of cities around the world, with cities as points on the heatmap, weighted by population:

Heatmap of the population of the world

To get started with the Android Maps API Utility Library, view the setup guide - you can also view our guides on how to use the marker clustering and the heatmap features. For a summary of previously existing features in the utility library, view Chris Broadfoot's Maps Shortcuts video. As always, if you have any problems using the Android Maps API or the Utility Library, post to StackOverflow - our support page has the right tags to use.

Gradient Polylines and Structured Reverse Geocoding Results: Google Maps SDK for iOS v1.7

A new release of the Google Maps SDK for iOS is now available! Read on to find out about the new features included in v1.7.

Gradient Polylines

In this release we’ve included gradient polylines which allow you to apply different colors to different segments of your polylines. This allows you to easily indicate changes along your polyline such as speed or elevation.

There are two options:

The example below visualizes the elevation along a route using a gradient polyline.


Structured Reverse Geocoding

In the past, our reverse geocoder, GMSGeocoder, has responded to a latitude/longitude request with the address as a formatted string. In v1.7, GMSGeocoder can return the address as a GMSAddress object, enabling you to easily access the different parts of an address without needing to parse a string. For example if you’re only interested in the country, this is available as address.country. Check out the developer guide for further information about the properties available to you.

URL Schemes & x-callback-url

The comgooglemaps URL scheme lets you launch Google Maps for iOS, displaying the map at a particular location and zoom level, showing the results of a search, or showing directions. In addition to driving, public transit and walking directions, we’ve now added biking directions to the URL scheme.

There may be times, though, when you want to open Google Maps for iOS directly from within your app, but also want to provide the ability for users to easily return to your app via a back button when they are finished. X-callback-url, an open specification for inter-app communication and messaging between iOS apps, lets you do just that. We’ve documented how to use x-callback-url to launch Google Maps for iOS, and also how to help guide users back to your app when they are ready.

High fidelity 3D buildings

Finally, some of you may know that Google Maps for iOS now has some higher fidelity 3D buildings. If you’d like your app to have access to these 3D buildings, you’ll need to upgrade to v1.7 of the Google Maps SDK for iOS. Check out our favorite, the Eiffel Tower!


We’ve also included a few bug fixes which you can read about in the release notes.

We’re always interested to hear how you’re using the Maps APIs, so let us know if you’ve got something cool to show by tagging +Google Maps API on your posts (or comment right here). For technical questions that aren’t answered in the developer documentation, check out the Google Maps developer community on Stack Overflow. Don’t forget to tell us what you’d like to see in the next release using the Google Maps API issue tracker.

Posted by Megan Boundey, Product Manager, Google Maps Mobile APIs

Fab Friday is a Google Maps video fest

Author photo
G’day and welcome to Fab Friday! It’s holiday time in many places around the world, and what better way to celebrate than to watch a series of videos. So kick back, relax, and snag some cool mapping skills.

Mano Marks presents an entire series in one go – four videos on getting started with the Google Maps JavaScript API. Here’s episode 1:


That rocks! Follow right along with the episodes 2, 3 and 4. Now you’re ready to map and roll.

See how to import data into Google Maps Engine with Josh Livni and Mark McDonald. Google Maps Engine (GME) provides an easy way to create and share maps, and to put data into the Google cloud. Josh and Mark walk through some Python examples, showing various ways to import vector and raster data into your GME account:


Tap the geospatial data in Freebase to put knowledge on your map. Freebase is a dataset of well-known facts about people, places, businesses, and other entities, derived from the web. Josh Livni and Ewa Gasperowicz show you how to query the Freebase API and get back information to put on a map:


Looking for some stylish color schemes for your maps? Want to simplify, hide, or highlight specific map features? Paul Saxman talks about Snazzy Maps by Atmist, a community-driven repository of map styles for Google Maps. Paul shows you how to add the custom map styles to your app using the Google Maps JavaScript API, and also how to contribute styles to Snazzy Maps yourself:


Ready for more shows from the Google Maps API team? Find them all at Google Developers Live.