Author Archives: Maps Devel

No map is an island: Introducing a connected JavaScript Maps API experience

Our digital lives are increasingly connected. We research on our laptops, look up directions on our phones and even navigate with our watches. And by creating maps unique to each user and offering features such as saved places, Google Maps has been making it easier to continue these tasks as we move from device to device.

However, although maps embedded from Google Maps are now built uniquely for every Google user, most of the now two million active sites and apps using the Maps APIs are still islands. When I look for a place to eat on Zagat, I can’t see how far away it is from work. When I look at a travel map in the New York Times, I can’t save those places in order to navigate to them later.

Today we’re taking a step towards connecting these two million sites and apps by introducing a signed-in JavaScript Maps API experience and a feature called attributed save. To help illustrate, we’ve partnered with the New York Times to bring this experience to their 36 hours travel column.

A connected JavaScript Maps API

When you add &signed_in=true to the Google Maps JavaScript API source url, your end users will have the option to sign into the map with their Google account. When they do so, your users will receive a map built for them, in the context of your app. Their saved places — including home and work addresses (if set by the end user) as well as other relevant places — will appear automatically on their map, providing a layer of context that anchors your content and makes it stand out even more.


Attributed save

Once users are signed into the Google Maps in your app, we can together create an integrated experience between your map content and Google Maps. With attributed save, signed-in users can save places from your app to be accessed later, with attribution and linkbacks, on Google Maps for the web, Android and iOS.

What’s more, you can also enable deep links into your mobile applications. For instance, users can save a place from your desktop app (such as Zagat.com), open up the place on Google Maps on their Android device, and deep link directly into your Android app.

Enabling attributed save is easy — just specify your app name, a link and a place search string or place ID when creating a marker and info window. Or use our SaveWidget to enable attributed save in your own custom info window.

In addition, we’re also launching attributed save across all embedded maps today. Attribution and linkback parameter will be inferred automatically from the domain and referrer of the host site, so if you’re using our embedded maps, you don’t need to do anything! If you’re using the Google Maps Embed API, you may customize the source and link back parameters yourself.

One final point: we’ve stated in the past that the JavaScript Maps API is cookieless if loaded from maps.googleapis.com. As of today, to enable the signed in maps experience on sites across the web, the signed-in version of the JavaScript Maps API now does rely on cookies to detect the end user’s signed-in state. Please review our documentation for further details.

That’s all for now. Go try it out. And remember, no map is an island, entire of itself...

Going where you are: Google Maps API Utility Libraries moving to Github

For years, we’ve hosted the open source utility libraries for the Google Maps JavaScript API on Google Code. These libraries provide additional functionality that developers can add to their maps applications. They also show best practices for techniques like marker clustering:


Putting labels on a map:


And much more.

Over the last few years the developer community has increasingly used GitHub for hosting code. In order to make these libraries more useful to developers, we will be moving the utility libraries maintained by Google to our Google Maps GitHub repository, where they will join the Android utility library, the iOS utility library, our new Java Client for Google Maps Services and various code samples we’ve published. There they will be easy to fork and use in your own projects, as well as make pull requests to add new features and fix problems.

We have frozen the existing project on code.google.com. Future updates will be made only in the GitHub repositories. We encourage developers to get their code from the GitHub repositories instead.

For a complete list of the utility libraries on GitHub, check out our directory.

Posted by Mano Marks, Google Maps API Team

Mixing maps and WebGL to visualize huge geo datasets

Matt Cooper is a Computer Science student at the University of Sheffield. He spent the past summer interning in the Google Maps for Work team in London. He worked on ways to help our partners implement our Maps API and display large amounts of data.

Google Maps is great for displaying data. Whether you’re using the Google Maps Javascript API’s Data Layer, Google Maps Engine, or My Maps, you’re able to display a pretty impressive amount of data on top of Google Maps. But don’t you always wish you could display a bit more?

I’ve been working on a way to use new web technology to make some really great, scalable and awesome tools to use with Maps. There’s one new technology that’s pretty good at displaying graphics on the web - WebGL. Using WebGL you can access a user’s graphics card and perform some speedy and big rendering operations. There are some open source libraries that are currently working to bring WebGL and maps closer together and I’ve made something that helps to bring WebGL and Google Maps closer together too.


This map illustrates how WebGL Layer can display a high density of data on a single map by showing the Postcode records of London (~120,000 points).


Currently you can use CanvasLayer.js that Brendan Kenny developed to integrate WebGL and Maps. He showed that off last year at Google I/O but even with CanvasLayer, there’s a bit more work to do to help developers use WebGL with Maps.

That’s where WebGL Layer comes in. It’s an experimental extension I wrote for Google Maps that gives you simple and extensible access to WebGL on a map and it’s really easy to get started. Simply include WebGL Layer and its dependencies on your web page, make a Google Map like you normally would, and then you can add your WebGL Layer.


Just like you’d expect from a Maps Layer you can now load in data. WebGL Layer uses GeoJSON as a data source, but you can extend this as you wish. You can use GeoJSON from your application or GeoJSON from an external source.


There’s also support for Vector Tile Servers. As WebGL Layer is designed to display huge amounts of data you’ll often run into problems with bandwidth and file size. A great way to get around this is to use Google’s Compute Engine to host your own tile server. One of the builds I liked is a PostGIS database with TileStache in front providing a UWSGI HTTP server for GeoJSON tiles. Once you have your tile server, adding it in is easy.


After you’ve added all your data in, you’re going to want to do something with it, right? WebGL Layer uses an onAddFeature callback that lets you grab a feature after it enters the layer and do some cool things with it.
Let’s say you want to build a robust frontend GIS (Geographic information system). You can integrate with JavaScript Topology Suite to let you do some spatial indexing and querying on your points. You can also use powerful libraries like Crossfilter to do speedy filtering and queries on your data or you can make your own data structure. Once you’ve got your data back you can use the index properties attached to the feature to change some of the internal features.


There are a lot more more examples on the Github repo. Feel free to play around and tinker with WebGL Layer to make your own awesome new maps projects. And as always, we’d love to hear about the new and exciting maps apps you’re building.

Maps Engine API now at v1: Make Maps in Google’s Cloud

Maps are a wonderful tools for visualizing data. With Google Maps Engine, you can create, share, and host maps like these in the Cloud:


National Geographic Society’s
Ocean Atlas: Indian Ocean Floor
David Rumsey Map Collection’s
Japan 1891

City of Edmonton's
Traffic Incidents Bubbles


Last year we started rolling out features to enable full data management in Maps Engine via a REST API and a set of native client libraries (including Java, Python and Node.js), making the API easy to use from any application or platform (Android, web, iOS, and server environments). The API can be used to automate data updates, build custom apps on the Maps Engine platform, or use 3rd party tools to connect existing software with your data stored in Maps Engine.

Today we’re launching the Maps Engine API v1.0: you can now do any CRUD operation on Maps Engine data via the API. The API is fully covered by our service level agreement (SLA) and deprecation policy. There is also a great set of new tutorials and documentation to help get you started.

Take advantage of Maps Engine and its API to:
  1. Bring Maps Engine to your own application by connecting with Maps Engine via the API. Great examples of this are Safe Software’s FME tool which allows you to load data from Socrata to Maps Engine and the Open Data Kit Collect app which helps folks collecting data out in the field update straight into Maps Engine,
  1. Make your maps discoverable to the world by joining the Maps Engine public data program and publishing your maps to the public Google Maps Gallery, or
  2. Host and craft your own maps in Maps Engine by signing up for a free account or becoming a Maps for Work customer (for higher data limits and query capacity)

Keen to get started using the API? Then check out the video below for a crash course in Maps Engine and the API and these tutorials.


Posted by Jen Kovnats, Product Manager

Turning down the Flash Maps API

Alert!

On September 2nd of this year the three year deprecation period for the Google Maps API for Flash will come to a close and the API will be turned off on that date. We encourage developers of existing applications to migrate to JavaScript Maps API v3 as soon as possible.

Over the past 3 years we’ve added numerous additional features to v3, such as elevation, cycling and transit directions, symbols, and support for GeoJSON, making it our most powerful and well used Maps API ever. Developers looking to migrate to the JavaScript Maps API v3 can find answers to any questions they have on StackOverflow. Our support page has the right StackOverflow tags to peruse.

Alternatively, if you are a Maps API for Business customer you can get help through the Enterprise support portal (check the Resources tab).

Posted by Mano Marks, Developer Relations Team

Putting your Professional Group on the Map

People love to know what’s happening in their area of expertise around the world. What better way to show it, than on a map? Tech Comm on a Map puts technical communication tidbits onto an interactive map, together with the data and functionality provided by Google Maps. 

I’m a technical writer at Google. In this post I share a project that uses the new Data layer in the Google Maps JavaScript API, with a Google Sheets spreadsheet as a data source and a location search provided by Google Places Autocomplete. 

Although this project is about technical communication, you can easily adapt it for other special interest groups too. The code is on GitHub.

The map in action 

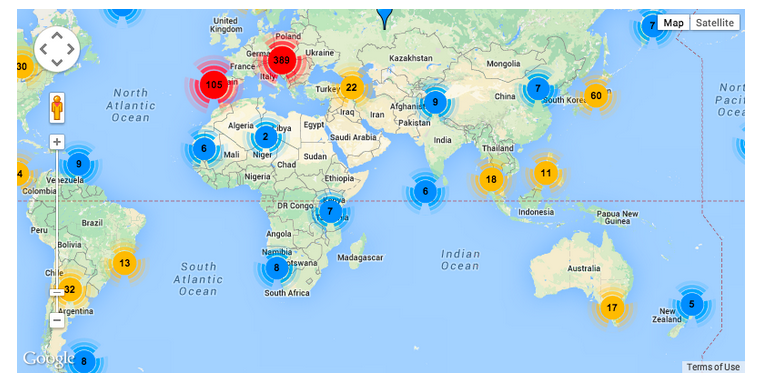
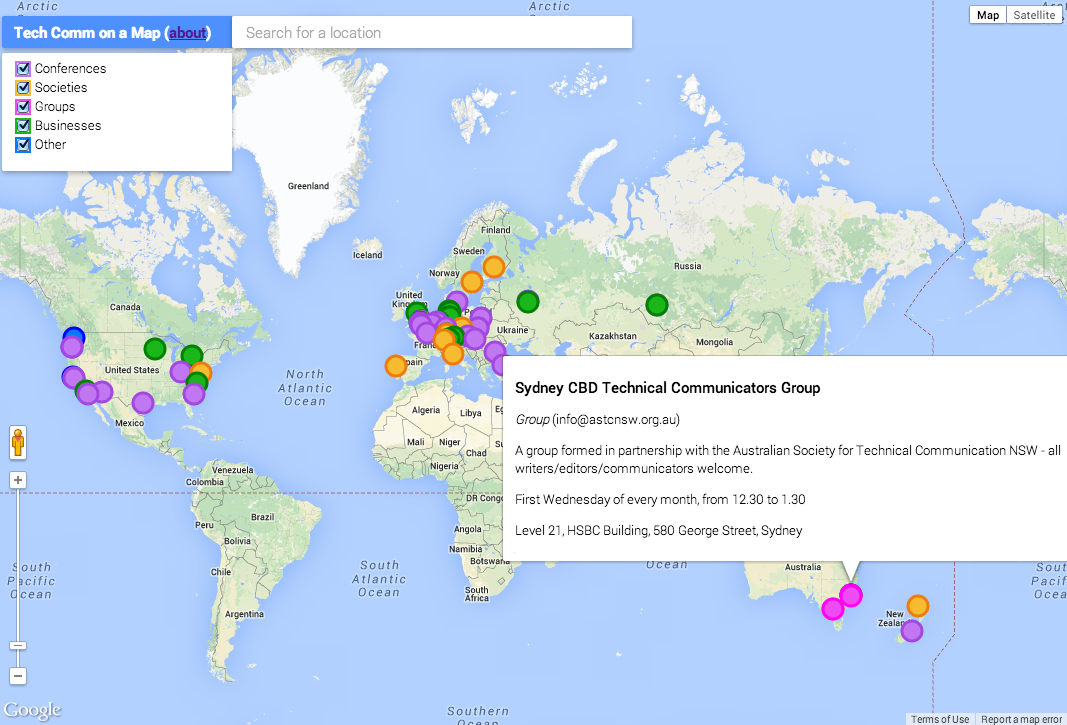
Visit Tech Comm on a Map to see it in action. Here’s a screenshot:


The colored circles indicate the location of technical communication conferences, societies, groups and businesses. The “other” category is for bits and pieces that don’t fit into any of the categories. You can select and deselect the checkboxes at top left of the map, to choose the item types you’re interested in.  

When you hover over a circle, an info window pops up with information about the item you chose. If you click a circle, the map zooms in so that you can see where the event or group is located. You can also search for a specific location, to see what’s happening there. 

Let’s look at the building blocks of Tech Comm on a Map.

Getting hold of a map

I'm using the Google Maps JavaScript API to display and interact with a map.

Where does the data come from?

When planning this project, I decided I want technical communicators to be able to add data (conferences, groups, businesses, and so on) themselves, and the data must be immediately visible on the map. 

I needed a data entry and storage tool that provided a data entry UI, user management and authorization, so that I didn’t have to code all that myself. In addition, contributors shouldn’t need to learn a new UI or a new syntax in order to add data items to the map. I needed a data entry mechanism that is familiar to most people – a spreadsheet, for example. 

In an episode of Google Maps Developer Shortcuts, Paul Saxman shows how to pull data from Google Drive into your JavaScript app. That’s just what I needed. Here’s how it works.

The data for Tech Comm on a Map is in a Google Sheets spreadsheet. It looks something like this:


Also in the spreadsheet is a Google Apps Script that outputs the data in JSON format:

var SPREADSHEET_ID = '[MY-SPREADSHEET-ID]';
var SHEET_NAME = 'Data';
function doGet(request) {
 var callback = request.parameters.jsonp;
 var range = SpreadsheetApp
     .openById(SPREADSHEET_ID)
     .getSheetByName(SHEET_NAME)
     .getDataRange();
 var json = callback + '(' +
     Utilities.jsonStringify(range.getValues()) + ')';
 
 return ContentService
     .createTextOutput(json)
     .setMimeType(ContentService.MimeType.JAVASCRIPT);
}


Follow these steps to add the script to the spreadsheet and make it available as a web service:
  1. In Google Sheets, choose ‘Tools’ > ‘Script Editor’.
  2. Add a new script as a blank project.
  3. Insert the above code.
  4. Choose ‘File’ > ‘Manage Versions’, and name the latest version of the script.
  5. Choose ‘Publish’ >  ‘Deploy as web app’. Make it executable by ‘anyone, even anonymous’. Note: This means anyone will be able to access the data in this spreadsheet via a script.
  6. Choose ‘Deploy’.
  7. Copy the URL of the web service. You’ll need to paste it into the JavaScript on your web page.

In your JavaScript, define a variable to contain the URL of the Google Apps script, and add the JSONP callback parameter:
var DATA_SERVICE_URL =
  "https://script.google.com/macros/s/[MY-SCRIPT-ID]/exec?jsonp=?";

Then use jQuery’s Ajax function to fetch and process the rows of data from the spreadsheet. Each row contains the information for an item: type, item name, description, website, start and end dates, address, latitude and longitude.
$.ajax({
 url: DATA_SERVICE_URL,
 dataType: 'jsonp',
 success: function(data) {
   // Get the spreadsheet rows one by one.
   // First row contains headings, so start the index at 1 not 0.
   for (var i = 1; i < data.length; i++) {
     map.data.add({
       properties: {
         type: data[i][0],
         name: data[i][1],
         description: data[i][2],
         website: data[i][3],
         startdate: data[i][4],
         enddate: data[i][5],
         address: data[i][6]
       },
       geometry: {
         lat: data[i][7],
         lng: data[i][8]
       }
     });
   }
 }
});

The new Data layer in the Maps JavaScript API


Now that I could pull the tech comm information from the spreadsheet into my web page, I needed a way to visualize the data on the map. The new Data layer in the Google Maps JavaScript API is designed for just such a purpose. Notice the method map.data.add() in the above code. This is an instruction to add a feature in the Data layer. 

With the basic JavaScript API you can add separate objects to the map, such as a polygon, a marker, or a line. But by using the Data layer, you can define a collection of objects and then manipulate and style them as a group. (The Data layer is also designed to play well with GeoJSON, but we don’t need that aspect of it for this project.) 

The tech comm data is represented as a series of features in the Data layer, each with a set of properties (type, name, address, etc) and a geometry (latitude and longitude).

Style the markers on the map, with different colors depending on the data type (conference, society, group, etc):


function techCommItemStyle(feature) {

 var type = feature.getProperty('type');


 var style = {

   icon: {
     path: google.maps.SymbolPath.CIRCLE,
     fillOpacity: 1,
     strokeWeight: 3,
     scale: 10        
   },
   // Show the markers for this type if
   // the user has selected the corresponding checkbox.
   visible: (checkboxes[type] != false)
 };

 // Set the marker colour based on type of tech comm item.
 switch (type) {
   case 'Conference':
     style.icon.fillColor = '#c077f1';
     style.icon.strokeColor = '#a347e1';
     break;
   case 'Society':
     style.icon.fillColor = '#f6bb2e';
     style.icon.strokeColor = '#ee7b0c';
     break;

. . . SNIPPED SOME DATA TYPES FOR BREVITY

   default:
     style.icon.fillColor = '#017cff';
     style.icon.strokeColor = '#0000ff';
 }
 return style;
}

Set listeners to respond when the user hovers over or clicks a marker. For example, this listener opens an info window on hover, showing information about the relevant data item:
 map.data.addListener('mouseover', function(event) {
   createInfoWindow(event.feature);
   infoWindow.open(map);
 });

The Place Autocomplete search


The last piece of the puzzle is to let users search for a specific location on the map, so that they can zoom in and see the events in that location. The location search box on the map is provided by the Place Autocomplete widget from the Google Places API.

What’s next?


Tech Comm on a Map is an ongoing project. We technical communicators are using a map to document our presence in the world!

Would you like to contribute? The code is on GitHub.

Posted by Sarah Maddox, Google Developer Relations team.

Recap of Google Maps at I/O 14

Maps had a great I/O 2014, with four sessions and three I/O Bytes. Not to mention all the partners in the sandbox who were using the Maps API!

For those who want to relive Google I/O, or catch up on sessions you missed, we’ve created a playlist of Maps videos:


Enjoy watching, and happy mapping!

Posted by Mano Marks, Developer Relations Team

Maps at I/O’14

Google I/O starts tomorrow, and as always, Google Maps is a big part of the show. The team has been working hard to give developers a great experience. We’re looking forward to seeing you there, or your comments online on our videos. There will be lots of maps engineers, developer relations team members, product managers and more around I/O. So if you’re there, find us, say hi and show us your apps!

We’ve already released one video (embedded below). Watch the I/O Bytes 2014 channel for more to come. Also in this post is a tantalizing glimpse into four of our I/O sessions.

Video


Map Up your Apps!
with Megan Boundey

Interested in adding Google Maps to your mobile apps but needing inspiration? Did you know that you can now add Street View to your apps too? See how incorporating maps into your app can delight your users! We'll show you some exciting uses of the Google Maps Mobile APIs and describe the functionality available in the APIs as we go.


Sessions

The first three sessions are available by livestream, and all sessions will be available on YouTube in the Google Developers Channel after I/O.

Google Maps is creating the world's most comprehensive geolocated photo library through Street View. We're also empowering anyone to contribute photos and 360-degree panoramas to Google Maps via products like Trekker, Business View, Views, and Photo Sphere. In this talk, we'll show how developers can integrate billions of panoramas into their projects. We'll also show how anyone can quickly publish imagery of places they care about, then easily access them via our APIs and viewers. This session is relevant to developers creating experiences that include location and imagery.

Satellites have been systematically collecting imagery of our changing planet for more than 40 years, yet until recently this treasure trove of “big data” has not been online and available for high-performance data mining. This session will cover the new Google Earth Engine technology and experimental API for massively-parallel geospatial analysis on daily-updating global datasets such as Landsat satellite imagery. Scientists and other domain experts are developing new EE-powered applications which map, measure and monitor our changing planet in unprecedented detail, for the benefit of people and the environment. Applications include tracking and reducing global deforestation; mapping and mitigating the risks of earthquakes and extreme weather events such as floods and drought; and even creating new kinds of geo-visualizations such as the 2014 Webby award-winning “Timelapse” - a zoomable, browsable HTML5 video animation of the entire Earth from 1984-2012, built from nearly a petabyte of Landsat data. These early results merely hint at what’s now possible.

How do you redesign a product used by a billion people? The Google Maps team recently launched their biggest redesign since the product was introduced 8 years ago. The lead designers will take you through the journey, illustrating three lessons learned that can apply to any design and product development process.

Built on Google’s developer platform, Santa Tracker lets millions of children and adults track Santa in 34 languages as he delivers presents across the world. The project’s technical leads go behind the scenes to provide insight into the challenges of building a cohesive Google developer platform experience across mobile/desktop web, Android, Chromecast, Maps and Search; all powered by a Go AppEngine backend.

See you at I/O, or online at +GoogleMapsAPI and @GoogleMapsAPI.


Posted by Mano Marks, Developer Relations Team

New Place IDs and Add-a-Place features in the Places API!

With rich autocomplete and place search functionality, the Google Places API includes several powerful features to find, discover, and interact with the world’s places. Now we’re making it even easier for developers to work with places by launching Place IDs and enhancements to our Add-a-Place functionality!

Place IDs


Until today, Places API developers had to work with a dual-ID system: IDs (id) were used to compare places and References (reference) were for fetching a place’s information. The new Place IDs (place_id) can serve both those purposes, and are also shorter and simpler than the typically long and unwieldy References.

With today’s launch, Place IDs will be returned in all responses that include the existing ID and Reference fields, and they can also be used instead of References to uniquely identify a place in Place Details requests. We believe Place IDs have clear functional and simplicity benefits over the previous ID and Reference system, and we’ll be removing IDs and Reference support from the Places API a year from now, on June 24th, 2015.

Add-a-Place


While Google strives to bring developers the freshest local data, sometimes users know about places before we do, and we want to make sure they can add and interact with new places right away. That’s why the Places API has an Add-a-Place feature, that with today’s update, can also include a new place’s address, website, and phone number in the request.

This additional data will be automatically associated and returned with the new place, so end-users can benefit from additional useful place information without forcing developers to store extra data. The new fields also help streamline Google’s internal place moderation process, which augments Google’s places repository with places added via the Places API, leading to more up-to-date, comprehensive, and accurate local data for everyone.

A great example of how to integrate the Add-a-Place feature is Zodio, a popular social location-based app from Thailand. They use the Places API’s Add-a-Place feature in their check-in experience so their users can always share where they are, even if the place is currently missing from the Places API.
Zodio_Add_Name.png
Please visit our developer documentation to learn more about the Places API. As you build the next awesome location-based app, please post any questions to our StackOverflow community and send us feedback via the Google Maps API Issue Tracker.

Posted by David McLeish and Kevin Tran, Software Engineers, Google Places API

Sunsetting the Google Maps JavaScript API Panoramio and Weather libraries, and a Flash Maps API reminder

In the past few years we’ve seen GeoJSON explode as a method to share geographic data and developers are using GeoJSON to create amazing visualizations. As a consequence, however, we’re seeing less interest in non-customizable layers directly provided by API providers.

So, starting today, we will begin sunsetting the Google Maps JavaScript API v3 Panoramio Library and Weather Library. Per the terms of our deprecation policy, the Panoramio, weather, and cloud layers served by these libraries will continue to function until one year from today and will be removed on June 4, 2015.

We’d also like to remind developers that the Flash Maps API’s deprecation period ends on September 2, 2014. The Flash Maps API will shut down on that date, so if you’re still using the API, it’s time to start planning your migration.

If you have any questions about these announcements, our friendly developer relations team is always happy to help. Please tag questions with ‘google-maps-api-3’ on StackOverflow and we’ll respond shortly.