Author Archives: Google

Staying Safe with Chrome Extensions

Chrome extensions can boost your browsing, empowering you to do anything from customizing the look of sites to providing personalized advice when you’re planning a vacation. But as with any software, extensions can also introduce risk.

That’s why we have a team whose only job is to focus on keeping you safe as you install and take advantage of Chrome extensions. Our team:

  • Provides you with a personalized summary of the extensions you’ve installed
  • Reviews extensions before they’re published on the Chrome Web Store
  • Continuously monitors extensions after they’re published

A summary of your extensions

The top of the extensions page (chrome://extensions) warns you of any extensions you have installed that might pose a security risk. (If you don’t see a warning panel, you probably don’t have any extensions you need to worry about.) The panel includes:

  • Extensions suspected of including malware
  • Extensions that violate Chrome Web Store policies
  • Extensions that have been unpublished by a developer, which might indicate that an extension is no longer supported
  • Extensions that aren’t from the Chrome Web Store
  • Extensions that haven’t published what they do with data they collect and other privacy practices

You’ll get notified when Chrome’s Safety Check has recommendations for you or you can check on your own by running Safety Check. Just type “run safety check” in Chrome’s address bar and select the corresponding shortcut: “Go to Chrome safety check.”

User flow of removing extensions highlighted by Safety Check.

Besides the Safety Check, you can visit the extensions page directly in a number of ways:

  • Navigate to chrome://extensions
  • Click the puzzle icon and choose “Manage extensions”
  • Click the More choices menu and choose menu > Extensions > Manage Extensions

Reviewing extensions before they’re published

Before an extension is even accessible to install from the Chrome Web Store, we have two levels of verification to ensure an extension is safe:

  1. An automated review: Each extension gets examined by our machine-learning systems to spot possible violations or suspicious behavior.
  2. A human review: Next, a team member examines the images, descriptions, and public policies of each extension. Depending on the results of both the automated and manual review, we may perform an even deeper and more thorough review of the code.

This review process weeds out the overwhelming majority of bad extensions before they even get published. In 2024, less than 1% of all installs from the Chrome Web Store were found to include malware. We're proud of this record and yet some bad extensions still get through, which is why we also monitor published extensions.

Monitoring published extensions

The same Chrome team that reviews extensions before they get published also reviews extensions that are already on the Chrome Web Store. And just like the pre-check, this monitoring includes both human and machine reviews. We also work closely with trusted security researchers outside of Google, and even pay researchers who report possible threats to Chrome users through our Developer Data Protection Rewards Program.

What about extensions that get updated over time, or are programmed to execute malicious code at a later date? Our systems monitor for that as well, by periodically reviewing what extensions are actually doing and comparing that to the stated objectives defined by each extension in the Chrome Web Store.

If the team finds that an extension poses a severe risk to Chrome users, it’s immediately remove from the Chrome Web Store and the extension gets disabled on all browsers that have it installed.

The extensions page highlights when you have a potentially unsafe extension downloaded

Others steps you can take to stay safe


Review new extensions before installing them

The Chrome Web Store provides useful information about each extension and its developer. The following information should help you decide whether it’s safe to install an extension:

  • Verified and featured badges are awarded by the Chrome team to extensions that follow our technical best practices and meet a high standard of user experience and design
  • Ratings and reviews from our users
  • Information about the developer
  • Privacy practices, including information about how an extension handles your data

Be careful of sites that try to quickly persuade you to install extensions, especially if the site has little in common with the extension.

Review extensions you’ve already installed

Even though Safety Check and your Extensions page (chrome://extensions) warn you of extensions that might pose a risk, it’s still a good idea to review your extensions from time to time.

  1. Uninstall extensions that you no longer use.
  2. Review the description of an extension in the Chrome Web Store, considering the extension’s ratings, reviews, and privacy practices — reviews can change over time.
  3. Compare an extension’s stated goals with 1) the permissions requested by an extension and 2) the privacy practices published by the extension. If requested permissions don’t align with stated goals, consider uninstalling the extension.
  4. Limit the sites an extension has permission to work on.

Enable Enhanced Protection

The Enhanced protection mode of Safe Browsing is Chrome’s highest level of protection that we offer. Not only does this mode provide you with the best protections against phishing and malware, but it also provides additional features targeted to keep you safe against potentially harmful extensions. Threats are constantly evolving and Safe Browsing’s Enhanced protection mode is the best way to ensure that you have the most advanced security features in Chrome. This can be enabled from the Safe Browsing settings page in Chrome (chrome://settings/security) and selecting “Enhanced”.

Detecting browser data theft using Windows Event Logs

Chromium's sandboxed process model defends well from malicious web content, but there are limits to how well the application can protect itself from malware already on the computer. Cookies and other credentials remain a high value target for attackers, and we are trying to tackle this ongoing threat in multiple ways, including working on web standards like DBSC that will help disrupt the cookie theft industry since exfiltrating these cookies will no longer have any value.

Where it is not possible to prevent the theft of credentials and cookies by malware, the next best thing is making the attack more observable by antivirus, endpoint detection agents, or enterprise administrators with basic log analysis tools.

This blog describes one set of signals for use by system administrators or endpoint detection agents that should reliably flag any access to the browser’s protected data from another application on the system. By increasing the likelihood of an attack being detected, this changes the calculus for those attackers who might have a strong desire to remain stealthy, and might cause them to rethink carrying out these types of attacks against our users.

Background

Chromium based browsers on Windows use the DPAPI (Data Protection API) to secure local secrets such as cookies, password etc. against theft. DPAPI protection is based on a key derived from the user's login credential and is designed to protect against unauthorized access to secrets from other users on the system, or when the system is powered off. Because the DPAPI secret is bound to the logged in user, it cannot protect against local malware attacks — malware executing as the user or at a higher privilege level can just call the same APIs as the browser to obtain the DPAPI secret.

Since 2013, Chromium has been applying the CRYPTPROTECT_AUDIT flag to DPAPI calls to request that an audit log be generated when decryption occurs, as well as tagging the data as being owned by the browser. Because all of Chromium's encrypted data storage is backed by a DPAPI-secured key, any application that wishes to decrypt this data, including malware, should always reliably generate a clearly observable event log, which can be used to detect these types of attacks.

There are three main steps involved in taking advantage of this log:

  1. Enable logging on the computer running Google Chrome, or any other Chromium based browser.
  2. Export the event logs to your backend system.
  3. Create detection logic to detect theft.

This blog will also show how the logging works in practice by testing it against a python password stealer.

Step 1: Enable logging on the system

DPAPI events are logged into two places in the system. Firstly, there is the 4693 event that can be logged into the Security Log. This event can be enabled by turning on "Audit DPAPI Activity" and the steps to do this are described here, the policy itself sits deep within Security Settings -> Advanced Audit Policy Configuration -> Detailed Tracking.

Here is what the 4693 event looks like:

<Event xmlns="http://schemas.microsoft.com/win/2004/08/events/event"> <System> <Provider Name="Microsoft-Windows-Security-Auditing" Guid="{...}" /> <EventID>4693</EventID> <Version>0</Version> <Level>0</Level> <Task>13314</Task> <Opcode>0</Opcode> <Keywords>0x8020000000000000</Keywords> <TimeCreated SystemTime="2015-08-22T06:25:14.589407700Z" /> <EventRecordID>175809</EventRecordID> <Correlation /> <Execution ProcessID="520" ThreadID="1340" /> <Channel>Security</Channel> <Computer>DC01.contoso.local</Computer> <Security /> </System> <EventData> <Data Name="SubjectUserSid">S-1-5-21-3457937927-2839227994-823803824-1104</Data> <Data Name="SubjectUserName">dadmin</Data> <Data Name="SubjectDomainName">CONTOSO</Data> <Data Name="SubjectLogonId">0x30d7c</Data> <Data Name="MasterKeyId">0445c766-75f0-4de7-82ad-d9d97aad59f6</Data> <Data Name="RecoveryReason">0x5c005c</Data> <Data Name="RecoveryServer">DC01.contoso.local</Data> <Data Name="RecoveryKeyId" /> <Data Name="FailureId">0x380000</Data> </EventData> </Event>

The issue with the 4693 event is that while it is generated if there is DPAPI activity on the system, it unfortunately does not contain information about which process was performing the DPAPI activity, nor does it contain information about which particular secret is being accessed. This is because the Execution ProcessID field in the event will always be the process id of lsass.exe because it is this process that manages the encryption keys for the system, and there is no entry for the description of the data.

It was for this reason that, in recent versions of Windows a new event type was added to help identify the process making the DPAPI call directly. This event was added to the Microsoft-Windows-Crypto-DPAPI stream which manifests in the Event Log in the Applications and Services Logs > Microsoft > Windows > Crypto-DPAPI part of the Event Viewer tree.

The new event is called DPAPIDefInformationEvent and has id 16385, but unfortunately is only emitted to the Debug channel and by default this is not persisted to an Event Log, unless Debug channel logging is enabled. This can be accomplished by enabling it directly in powershell:

$log = ` New-Object System.Diagnostics.Eventing.Reader.EventLogConfiguration ` Microsoft-Windows-Crypto-DPAPI/Debug $log.IsEnabled = $True $log.SaveChanges()

Once this log is enabled then you should start to see 16385 events generated, and these will contain the real process ids of applications performing DPAPI operations. Note that 16385 events are emitted by the operating system even for data not flagged with CRYPTPROTECT_AUDIT, but to identify the data as owned by the browser, the data description is essential. 16385 events are described later.

You will also want to enable Audit Process Creation in order to be able to know a current mapping of process ids to process names — more details on that later. You might want to also consider enabling logging of full command lines.

Step 2: Collect the events

The events you want to collect are:

  • From Security log:
    • 4688: "A new process was created."

  • From Microsoft-Windows-Crypto-DPAPI/Debug log: (enabled above)
    • 16385: "DPAPIDefInformationEvent"

These should be collected from all workstations, and persisted into your enterprise logging system for analysis.

Step 3: Write detection logic to detect theft.

With these two events is it now possible to detect when an unauthorized application calls into DPAPI to try and decrypt browser secrets.

The general approach is to generate a map of process ids to active processes using the 4688 events, then every time a 16385 event is generated, it is possible to identify the currently running process, and alert if the process does not match an authorized application such as Google Chrome. You might find your enterprise logging software can already keep track of which process ids map to which process names, so feel free to just use that existing functionality.

Let's dive deeper into the events.

A 4688 event looks like this - e.g. here is Chrome browser launching from explorer:

<Event xmlns="http://schemas.microsoft.com/win/2004/08/events/event"> <System> <Provider Name="Microsoft-Windows-Security-Auditing" Guid="{...}" /> <EventID>4688</EventID> <Version>2</Version> <Level>0</Level> <Task>13312</Task> <Opcode>0</Opcode> <Keywords>0x8020000000000000</Keywords> <TimeCreated SystemTime="2024-03-28T20:06:41.9254105Z" /> <EventRecordID>78258343</EventRecordID> <Correlation /> <Execution ProcessID="4" ThreadID="54256" /> <Channel>Security</Channel> <Computer>WIN-GG82ULGC9GO.contoso.local</Computer> <Security /> </System> <EventData> <Data Name="SubjectUserSid">S-1-5-18</Data> <Data Name="SubjectUserName">WIN-GG82ULGC9GO$</Data> <Data Name="SubjectDomainName">CONTOSO</Data> <Data Name="SubjectLogonId">0xe8c85cc</Data> <Data Name="NewProcessId">0x17eac</Data> <Data Name="NewProcessName">C:\Program Files\Google\Chrome\Application\chrome.exe</Data> <Data Name="TokenElevationType">%%1938</Data> <Data Name="ProcessId">0x16d8</Data> <Data Name="CommandLine">"C:\Program Files\Google\Chrome\Application\chrome.exe" </Data> <Data Name="TargetUserSid">S-1-0-0</Data> <Data Name="TargetUserName">-</Data> <Data Name="TargetDomainName">-</Data> <Data Name="TargetLogonId">0x0</Data> <Data Name="ParentProcessName">C:\Windows\explorer.exe</Data> <Data Name="MandatoryLabel">S-1-16-8192</Data> </EventData> </Event>

The important part here is the NewProcessId, in hex 0x17eac which is 97964.

A 16385 event looks like this:

<Event xmlns="http://schemas.microsoft.com/win/2004/08/events/event"> <System> <Provider Name="Microsoft-Windows-Crypto-DPAPI" Guid="{...}" /> <EventID>16385</EventID> <Version>0</Version> <Level>4</Level> <Task>64</Task> <Opcode>0</Opcode> <Keywords>0x2000000000000040</Keywords> <TimeCreated SystemTime="2024-03-28T20:06:42.1772585Z" /> <EventRecordID>826993</EventRecordID> <Correlation ActivityID="{777bf68d-7757-0028-b5f6-7b775777da01}" /> <Execution ProcessID="1392" ThreadID="57108" /> <Channel>Microsoft-Windows-Crypto-DPAPI/Debug</Channel> <Computer>WIN-GG82ULGC9GO.contoso.local</Computer> <Security UserID="S-1-5-18" /> </System> <EventData> <Data Name="OperationType">SPCryptUnprotect</Data> <Data Name="DataDescription">Google Chrome</Data> <Data Name="MasterKeyGUID">{4df0861b-07ea-49f4-9a09-1d66fd1131c3}</Data> <Data Name="Flags">0</Data> <Data Name="ProtectionFlags">16</Data> <Data Name="ReturnValue">0</Data> <Data Name="CallerProcessStartKey">32651097299526713</Data> <Data Name="CallerProcessID">97964</Data> <Data Name="CallerProcessCreationTime">133561300019253302</Data> <Data Name="PlainTextDataSize">32</Data> </EventData> </Event>

The important parts here are the OperationType, the DataDescription and the CallerProcessID.

For DPAPI decrypts, the OperationType will be SPCryptUnprotect.

Each Chromium based browser will tag its data with the product name, e.g. Google Chrome, or Microsoft Edge depending on the owner of the data. This will always appear in the DataDescription field, so it is possible to distinguish browser data from other DPAPI secured data.

Finally, the CallerProcessID will map to the process performing the decryption. In this case, it is 97964 which matches the process ID seen in the 4688 event above, showing that this was likely Google Chrome decrypting its own data! Bear in mind that since these logs only contain the path to the executable, for a full assurance that this is actually Chrome (and not malware pretending to be Chrome, or malware injecting into Chrome), additional protections such as removing administrator access, and application allowlisting could also be used to give a higher assurance of this signal. In recent versions of Chrome or Edge, you might also see logs of decryptions happening in the elevation_service.exe process, which is another legitimate part of the browser's data storage.

To detect unauthorized DPAPI access, you will want to generate a running map of all processes using 4688 events, then look for 16385 events that have a CallerProcessID that does not match a valid caller – Let's try that now.

Testing with a python password stealer

We can test that this works with a public script to decrypt passwords taken from a public blog. It generates two events, as expected:

Here is the 16385 event, showing that a process is decrypting the "Google Chrome" key.

<Event xmlns="http://schemas.microsoft.com/win/2004/08/events/event"> <System> < ... > <EventID>16385</EventID> < ... > <TimeCreated SystemTime="2024-03-28T20:28:13.7891561Z" /> < ... > </System> <EventData> <Data Name="OperationType">SPCryptUnprotect</Data> <Data Name="DataDescription">Google Chrome</Data> < ... > <Data Name="CallerProcessID">68768</Data> <Data Name="CallerProcessCreationTime">133561312936527018</Data> <Data Name="PlainTextDataSize">32</Data> </EventData> </Event>

Since the data description being decrypted was "Google Chrome" we know this is an attempt to read Chrome secrets, but to determine the process behind 68768 (0x10ca0), we need to correlate this with a 4688 event.

Here is the corresponding 4688 event from the Security Log (a process start for python3.exe) with the matching process id:

<Event xmlns="http://schemas.microsoft.com/win/2004/08/events/event"> <System> < ... > <EventID>4688</EventID> < ... > <TimeCreated SystemTime="2024-03-28T20:28:13.6527871Z" /> < ... > </System> <EventData> < ... > <Data Name="NewProcessId">0x10ca0</Data> <Data Name="NewProcessName">C:\python3\bin\python3.exe</Data> <Data Name="TokenElevationType">%%1938</Data> <Data Name="ProcessId">0xca58</Data> <Data Name="CommandLine">"c:\python3\bin\python3.exe" steal_passwords.py</Data> < ... > <Data Name="ParentProcessName">C:\Windows\System32\cmd.exe</Data> </EventData> </Event>

In this case, the process id matches the python3 executable running a potentially malicious script, so we know this is likely very suspicious behavior, and should trigger an alert immediately! Bear in mind process ids on Windows are not unique so you will want to make sure you use the 4688 event with the timestamp closest, but earlier than, the 16385 event.

Summary

This blog has described a technique for strong detection of cookie and credential theft. We hope that all defenders find this post useful. Thanks to Microsoft for adding the DPAPIDefInformationEvent log type, without which this would not be possible.

Uncovering potential threats to your web application by leveraging security reports

The Reporting API is an emerging web standard that provides a generic reporting mechanism for issues occurring on the browsers visiting your production website. The reports you receive detail issues such as security violations or soon-to-be-deprecated APIs, from users’ browsers from all over the world.

Collecting reports is often as simple as specifying an endpoint URL in the HTTP header; the browser will automatically start forwarding reports covering the issues you are interested in to those endpoints. However, processing and analyzing these reports is not that simple. For example, you may receive a massive number of reports on your endpoint, and it is possible that not all of them will be helpful in identifying the underlying problem. In such circumstances, distilling and fixing issues can be quite a challenge.

In this blog post, we'll share how the Google security team uses the Reporting API to detect potential issues and identify the actual problems causing them. We'll also introduce an open source solution, so you can easily replicate Google's approach to processing reports and acting on them.

How does the Reporting API work?

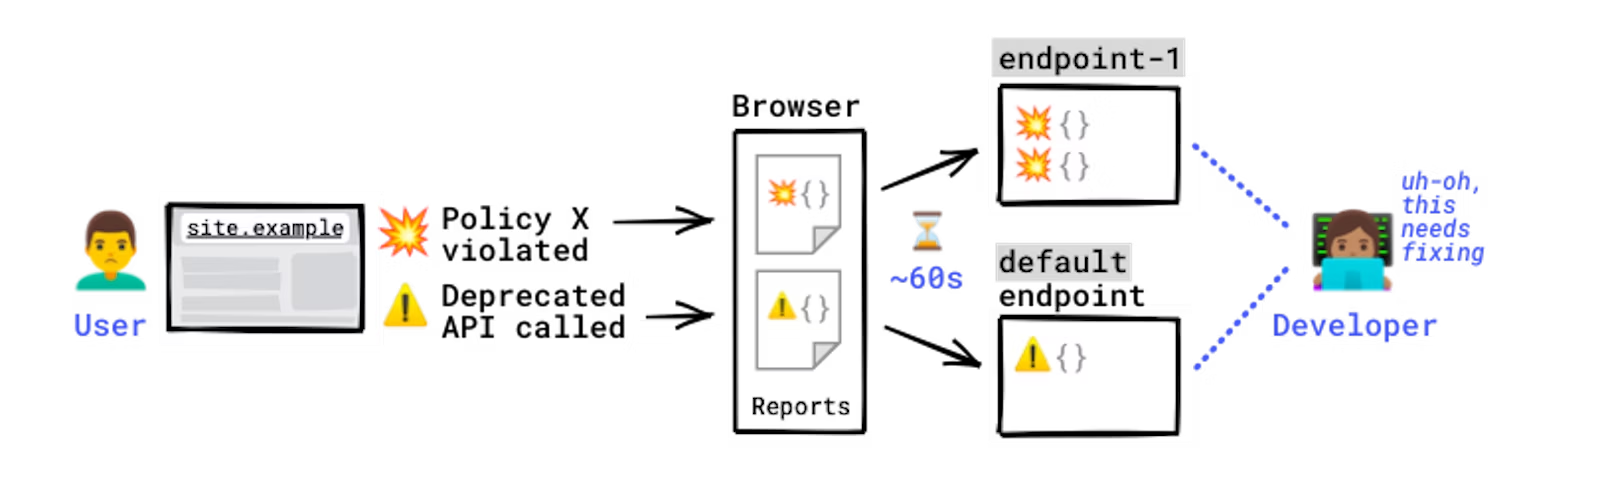
Some errors only occur in production, on users’ browsers to which you have no access. You won't see these errors locally or during development because there could be unexpected conditions real users, real networks, and real devices are in. With the Reporting API, you directly leverage the browser to monitor these errors: the browser catches these errors for you, generates an error report, and sends this report to an endpoint you've specified.

How reports are generated and sent.

Errors you can monitor with the Reporting API include:

For a full list of error types you can monitor, see use cases and report types.

The Reporting API is activated and configured using HTTP response headers: you need to declare the endpoint(s) you want the browser to send reports to, and which error types you want to monitor. The browser then sends reports to your endpoint in POST requests whose payload is a list of reports.

Example setup:

#  Example setup to receive CSP violations reports, Document-Policy violations reports, and Deprecation reports  

Reporting-Endpoints: main-endpoint="https://reports.example/main", default="https://reports.example/default"

# CSP violations and Document-Policy violations will be sent to `main-endpoint`

Content-Security-Policy: script-src 'self'; object-src 'none'; report-to main-endpoint;

Document-Policy: document-write=?0; report-to=main-endpoint;

# Deprecation reports are generated automatically and don't need an explicit endpoint; they're always sent to the `default` endpoint

Note: Some policies support "report-only" mode. This means the policy sends a report, but doesn't actually enforce the restriction. This can help you gauge if the policy is working effectively.

Chrome users whose browsers generate reports can see them in DevTools in the Application panel:

Example of viewing reports in the Application panel of DevTools.

You can generate various violations and see how they are received on a server in the reporting endpoint demo:

Example violation reports

The Reporting API is supported by Chrome, and partially by Safari as of March 2024. For details, see the browser support table.

Google's approach

Google benefits from being able to uplift security at scale. Web platform mitigations like Content Security Policy, Trusted Types, Fetch Metadata, and the Cross-Origin Opener Policy help us engineer away entire classes of vulnerabilities across hundreds of Google products and thousands of individual services, as described in this blogpost.

One of the engineering challenges of deploying security policies at scale is identifying code locations that are incompatible with new restrictions and that would break if those restrictions were enforced. There is a common 4-step process to solve this problem:

  1. Roll out policies in report-only mode (CSP report-only mode example). This instructs browsers to execute client-side code as usual, but gather information on any events where the policy would be violated if it were enforced. This information is packaged in violation reports that are sent to a reporting endpoint.
  2. The violation reports must be triaged to link them to locations in code that are incompatible with the policy. For example, some code bases may be incompatible with security policies because they use a dangerous API or use patterns that mix user data and code.
  3. The identified code locations are refactored to make them compatible, for example by using safe versions of dangerous APIs or changing the way user input is mixed with code. These refactorings uplift the security posture of the code base by helping reduce the usage of dangerous coding patterns.
  4. When all code locations have been identified and refactored, the policy can be removed from report-only mode and fully enforced. Note that in a typical roll out, we iterate steps 1 through 3 to ensure that we have triaged all violation reports.

With the Reporting API, we have the ability to run this cycle using a unified reporting endpoint and a single schema for several security features. This allows us to gather reports for a variety of features across different browsers, code paths, and types of users in a centralized way.

Note: A violation report is generated when an entity is attempting an action that one of your policies forbids. For example, you've set CSP on one of your pages, but the page is trying to load a script that's not allowed by your CSP. Most reports generated via the Reporting API are violation reports, but not all — other types include deprecation reports and crash reports. For details, see Use cases and report types.

Unfortunately, it is common for noise to creep into streams of violation reports, which can make finding incompatible code locations difficult. For example, many browser extensions, malware, antivirus software, and devtools users inject third-party code into the DOM or use forbidden APIs. If the injected code is incompatible with the policy, this can lead to violation reports that cannot be linked to our code base and are therefore not actionable. This makes triaging reports difficult and makes it hard to be confident that all code locations have been addressed before enforcing new policies.

Over the years, Google has developed a number of techniques to collect, digest, and summarize violation reports into root causes. Here is a summary of the most useful techniques we believe developers can use to filter out noise in reported violations:

Focus on root causes

It is often the case that a piece of code that is incompatible with the policy executes several times throughout the lifetime of a browser tab. Each time this happens, a new violation report is created and queued to be sent to the reporting endpoint. This can quickly lead to a large volume of individual reports, many of which contain redundant information. Because of this, grouping violation reports into clusters enables developers to abstract away individual violations and think in terms of root causes. Root causes are simpler to understand and can speed up the process of identifying useful refactorings.

Let's take a look at an example to understand how violations may be grouped. For instance, a report-only CSP that forbids the use of inline JavaScript event handlers is deployed. Violation reports are created on every instance of those handlers and have the following fields set:

  • The blockedURL field is set to inline, which describes the type of violation.
  • The scriptSample field is set to the first few bytes of the contents of the event handler in the field.
  • The documentURL field is set to the URL of the current browser tab.

Most of the time, these three fields uniquely identify the inline handlers in a given URL, even if the values of other fields differ. This is common when there are tokens, timestamps, or other random values across page loads. Depending on your application or framework, the values of these fields can differ in subtle ways, so being able to do fuzzy matches on reporting values can go a long way in grouping violations into actionable clusters. In some cases, we can group violations whose URL fields have known prefixes, for example all violations with URLs that start with chrome-extension, moz-extension, or safari-extension can be grouped together to set root causes in browser extensions aside from those in our codebase with a high degree of confidence.

Developing your own grouping strategies helps you stay focused on root causes and can significantly reduce the number of violation reports you need to triage. In general, it should always be possible to select fields that uniquely identify interesting types of violations and use those fields to prioritize the most important root causes.

Leverage ambient information

Another way of distinguishing non-actionable from actionable violation reports is ambient information. This is data that is contained in requests to our reporting endpoint, but that is not included in the violation reports themselves. Ambient information can hint at sources of noise in a client's set up that can help with triage:

  • User Agent or User Agent client hints: User agents are a great tell-tale sign of non-actionable violations. For example, crawlers, bots, and some mobile applications use custom user agents whose behavior differs from well-supported browser engines and that can trigger unique violations. In other cases, some violations may only trigger in a specific browser or be caused by changes in nightly builds or newer versions of browsers. Without user agent information, these violations would be significantly more difficult to investigate.
  • Trusted users: Browsers will attach any available cookies to requests made to a reporting endpoint by the Reporting API, if the endpoint is same-site with the document where the violation occurs. Capturing cookies is useful for identifying the type of user that caused a violation. Often, the most actionable violations come from trusted users that are not likely to have invasive extensions or malware, like company employees or website administrators. If you are not able to capture authentication information through your reporting endpoint, consider rolling out report-only policies to trusted users first. Doing so allows you to build a baseline of actionable violations before rolling out your policies to the general public.
  • Number of unique users: As a general principle, users of typical features or code paths should generate roughly the same violations. This allows us to flag violations seen by a small number of users as potentially suspicious, since they suggest that a user's particular setup might be at fault, rather than our application code. One way of 'counting users' is to keep note of the number of unique IP addresses that reported a violation. Approximate counting algorithms are simple to use and can help gather this information without tracking specific IP addresses. For example, the HyperLogLog algorithm requires just a few bytes to approximate the number of unique elements in a set with a high degree of confidence.

Map violations to source code (advanced)

Some types of violations have a source_file field or equivalent. This field represents the JavaScript file that triggered the violation and is usually accompanied by a line and column number. These three bits of data are a high-quality signal that can point directly to lines of code that need to be refactored.

Nevertheless, it is often the case that source files fetched by browsers are compiled or minimized and don't map directly to your code base. In this case, we recommend you use JavaScript source maps to map line and column numbers between deployed and authored files. This allows you to translate directly from violation reports to lines of source code, yielding highly actionable report groups and root causes.

Establish your own solution

The Reporting API sends browser-side events, such as security violations, deprecated API calls, and browser interventions, to the specified endpoint on a per-event basis. However, as explained in the previous section, to distill the real issues out of those reports, you need a data processing system on your end.

Fortunately, there are plenty of options in the industry to set up the required architecture, including open source products. The fundamental pieces of the required system are the following:

  • API endpoint: A web server that accepts HTTP requests and handles reports in a JSON format
  • Storage: A storage server that stores received reports and reports processed by the pipeline
  • Data pipeline: A pipeline that filters out noise and extracts and aggregates required metadata into constellations
  • Data visualizer: A tool that provides insights on the processed reports

Solutions for each of the components listed above are made available by public cloud platforms, SaaS services, and as open source software. See the Alternative solutions section for details, and the following section outlining a sample application.

Sample application: Reporting API Processor

To help you understand how to receive reports from browsers and how to handle these received reports, we created a small sample application that demonstrates the following processes that are required for distilling web application security issues from reports sent by browsers:

  • Report ingestion to the storage
  • Noise reduction and data aggregation
  • Processed report data visualization

Although this sample is relying on Google Cloud, you can replace each of the components with your preferred technologies. An overview of the sample application is illustrated in the following diagram:


Components described as green boxes are components that you need to implement by yourself. Forwarder is a simple web server that receives reports in the JSON format and converts them to the schema for Bigtable. Beam-collector is a simple Apache Beam pipeline that filters noisy reports, aggregates relevant reports into the shape of constellations, and saves them as CSV files. These two components are the key parts to make better use of reports from the Reporting API.

Try it yourself

Because this is a runnable sample application, you are able to deploy all components to a Google Cloud project and see how it works by yourself. The detailed prerequisites and the instructions to set up the sample system are documented in the README.md file.

Alternative solutions

Aside from the open source solution we shared, there are a number of tools available to assist in your usage of the Reporting API. Some of them include:

  • Report-collecting services like report-uri and uriports.
  • Application error monitoring platforms like Sentry, Datadog, etc.

Besides pricing, consider the following points when selecting alternatives:

  • Are you comfortable sharing any of your application's URLs with a third-party report collector? Even if the browser strips sensitive information from these URLs, sensitive information may get leaked this way. If this sounds too risky for your application, operate your own reporting endpoint.
  • Does this collector support all report types you need? For example, not all reporting endpoint solutions support COOP/COEP violation reports.

Summary

In this article, we explained how web developers can collect client-side issues by using the Reporting API, and the challenges of distilling the real problems out of the collected reports. We also introduced how Google solves those challenges by filtering and processing reports, and shared an open source project that you can use to replicate a similar solution. We hope this information will motivate more developers to take advantage of the Reporting API and, in consequence, make their website more secure and sustainable.

Learning resources

Prevent Generative AI Data Leaks with Chrome Enterprise DLP

Generative AI has emerged as a powerful and popular tool to automate content creation and simple tasks. From customized content creation to source code generation, it can increase both our productivity and creative potential.

Businesses want to leverage the power of LLMs, like Gemini, but many may have security concerns and want more control around how employees make sure of these new tools. For example, companies may want to ensure that various forms of sensitive data, such as Personally Identifiable Information (PII), financial records and internal intellectual property, is not to be shared publicly on Generative AI platforms. Security leaders face the challenge of finding the right balance — enabling employees to leverage AI to boost efficiency, while also safeguarding corporate data.

In this blog post, we'll explore reporting and enforcement policies that enterprise security teams can implement within Chrome Enterprise Premium for data loss prevention (DLP).

1. View login events* to understand usage of Generative AI services within the organization. With Chrome Enterprise's Reporting Connector, security and IT teams can see when a user successfully signs into a specific domain, including Generative AI websites. Security Operations teams can further leverage this telemetry to detect anomalies and threats by streaming the data into Chronicle or other third-party SIEMs at no additional cost.

2. Enable URL Filtering to warn users about sensitive data policies and let them decide whether or not they want to navigate to the URL, or to block users from navigating to certain groups of sites altogether.


For example, with Chrome Enterprise URL Filtering, IT admins can create rules that warn developers not to submit source code to specific Generative AI apps or tools, or block them.

3. Warn, block or monitor sensitive data actions within Generative AI websites with dynamic content-based rules for actions like paste, file uploads/downloads, and print. Chrome Enterprise DLP rules give IT admins granular control over browser activities, such as entering financial information in Gen AI websites. Admins can customize DLP rules to restrict the type and amount of data entered into these websites from managed browsers.

For most organizations, safely leveraging Generative AI requires a certain amount of control. As enterprises work through their policies and processes involving GenAI, Chrome Enterprise Premium empowers them to strike the balance that works best. Hear directly from security leaders at Snap on their use of DLP for Gen AI in this recording here.

Learn more about how Chrome Enterprise can secure businesses just like yours here.

*Available at no additional cost in Chrome Enterprise Core

Real-time, privacy-preserving URL protection

For more than 15 years, Google Safe Browsing has been protecting users from phishing, malware, unwanted software and more, by identifying and warning users about potentially abusive sites on more than 5 billion devices around the world. As attackers grow more sophisticated, we've seen the need for protections that can adapt as quickly as the threats they defend against. That’s why we're excited to announce a new version of Safe Browsing that will provide real-time, privacy-preserving URL protection for people using the Standard protection mode of Safe Browsing in Chrome.

Current landscape

Chrome automatically protects you by flagging potentially dangerous sites and files, hand in hand with Safe Browsing which discovers thousands of unsafe sites every day and adds them to its lists of harmful sites and files.

So far, for privacy and performance reasons, Chrome has first checked sites you visit against a locally-stored list of known unsafe sites which is updated every 30 to 60 minutes – this is done using hash-based checks.


Hash-based check overview

But unsafe sites have adapted — today, the majority of them exist for less than 10 minutes, meaning that by the time the locally-stored list of known unsafe sites is updated, many have slipped through and had the chance to do damage if users happened to visit them during this window of opportunity. Further, Safe Browsing’s list of harmful websites continues to grow at a rapid pace. Not all devices have the resources necessary to maintain this growing list, nor are they always able to receive and apply updates to the list at the frequency necessary to benefit from full protection.

Safe Browsing’s Enhanced protection mode already stays ahead of such threats with technologies such as real-time list checks and AI-based classification of malicious URLs and web pages. We built this mode as an opt-in to give users the choice of sharing more security-related data in order to get stronger security. This mode has shown that checking lists in real time brings significant value, so we decided to bring that to the default Standard protection mode through a new API – one that doesn't share the URLs of sites you visit with Google.

Introducing real-time, privacy-preserving Safe Browsing

How it works

In order to transition to real-time protection, checks now need to be performed against a list that is maintained on the Safe Browsing server. The server-side list can include unsafe sites as soon as they are discovered, so it is able to capture sites that switch quickly. It can also grow as large as needed because the Safe Browsing server is not constrained in the same way that user devices are.

Behind the scenes, here's what is happening in Chrome:

  1. When you visit a site, Chrome first checks its cache to see if the address (URL) of the site is already known to be safe (see the “Staying speedy and reliable” section for details).
  2. If the visited URL is not in the cache, it may be unsafe, so a real-time check is necessary.
  3. Chrome obfuscates the URL by following the URL hashing guidance to convert the URL into 32-byte full hashes.
  4. Chrome truncates the full hashes into 4-byte long hash prefixes.
  5. Chrome encrypts the hash prefixes and sends them to a privacy server (see the “Keeping your data private” section for details).
  6. The privacy server removes potential user identifiers and forwards the encrypted hash prefixes to the Safe Browsing server via a TLS connection that mixes requests with many other Chrome users.
  7. The Safe Browsing server decrypts the hash prefixes and matches them against the server-side database, returning full hashes of all unsafe URLs that match one of the hash prefixes sent by Chrome.
  8. After receiving the unsafe full hashes, Chrome checks them against the full hashes of the visited URL.
  9. If any match is found, Chrome will show a warning.

Keeping your data private

In order to preserve user privacy, we have partnered with Fastly, an edge cloud platform that provides content delivery, edge compute, security, and observability services, to operate an Oblivious HTTP (OHTTP) privacy server between Chrome and Safe Browsing – you can learn more about Fastly's commitment to user privacy on their Customer Trust page. With OHTTP, Safe Browsing does not see your IP address, and your Safe Browsing checks are mixed amongst those sent by other Chrome users. This means Safe Browsing cannot correlate the URL checks you send as you browse the web.

Before hash prefixes leave your device, Chrome encrypts them using a public key from Safe Browsing. These encrypted hash prefixes are then sent to the privacy server. Since the privacy server doesn’t know the private key, it cannot decrypt the hash prefixes, which offers privacy from the privacy server itself.

The privacy server then removes potential user identifiers such as your IP address and forwards the encrypted hash prefixes to the Safe Browsing server. The privacy server is operated independently by Fastly, meaning that Google doesn’t have access to potential user identifiers (including IP address and User Agent) from the original request. Once the Safe Browsing server receives the encrypted hash prefixes from the privacy server, it decrypts the hash prefixes with its private key and then continues to check the server-side list.

Ultimately, Safe Browsing sees the hash prefixes of your URL but not your IP address, and the privacy server sees your IP address but not the hash prefixes. No single party has access to both your identity and the hash prefixes. As such, your browsing activity remains private.

Real-time check overview

Staying speedy and reliable

Compared with the hash-based check, the real-time check requires sending a request to a server, which adds additional latency. We have employed a few techniques to make sure your browsing experience continues to be smooth and responsive.

First, before performing the real-time check, Chrome checks against a global and local cache on your device to avoid unnecessary delay.

  • The global cache is a list of hashes of known-safe URLs that is served by Safe Browsing. Chrome fetches it in the background. If any full hash of the URL is found in the global cache, Chrome will consider it less risky and perform a hash-based check instead.
  • The local cache, on the other hand, is a list of full hashes that are saved from previous Safe Browsing checks. If there is a match in the local cache, and the cache has not yet expired, Chrome will not send a real-time request to the Safe Browsing server.

Both caches are stored in memory, so it is much faster to check them than sending a real-time request over the network.

In addition, Chrome follows a fallback mechanism in case of unsuccessful or slow requests. If the real-time request fails consecutively, Chrome will enter a back-off mode and downgrade the checks to hash-based checks for a certain period.

We are also in the process of introducing an asynchronous mechanism, which will allow the site to load while the real-time check is in progress. This will improve the user experience, as the real-time check won’t block page load.

What real-time, privacy-preserving URL protection means for you

Chrome users

With the latest release of Chrome for desktop, Android, and iOS, we’re upgrading the Standard protection mode of Safe Browsing so it will now check sites using Safe Browsing’s real-time protection protocol, without sharing your browsing history with Google. You don't need to take any action to benefit from this improved functionality.

If you want more protection, we still encourage you to turn on the Enhanced protection mode of Safe Browsing. You might wonder why you need enhanced protection when you'll be getting real-time URL protection in Standard protection – this is because in Standard protection mode, the real-time feature can only protect you from sites that Safe Browsing has already confirmed to be unsafe. On the other hand, Enhanced protection mode is able to use additional information together with advanced machine learning models to protect you from sites that Safe Browsing may not yet have confirmed to be unsafe, for example because the site was only very recently created or is cloaking its true behavior to Safe Browsing’s detection systems.

Enhanced protection also continues to offer protection beyond real-time URL checks, for example by providing deep scans for suspicious files and extra protection from suspicious Chrome extensions.

Enterprises

The real-time feature of the Standard protection mode of Safe Browsing is on by default for Chrome. If needed, it may be configured using the policy SafeBrowsingProxiedRealTimeChecksAllowed. It is also worth noting that in order for this feature to work in Chrome, enterprises may need to explicitly allow traffic to the Fastly privacy server. If the server is not reachable, Chrome will downgrade the checks to hash-based checks.

Developers

While Chrome is the first surface where these protections are available, we plan to make them available to eligible developers for non-commercial use cases via the Safe Browsing API. Using the API, developers and privacy server operators can partner to better protect their products’ users from fast-moving malicious actors in a privacy-preserving manner. To learn more, keep an eye out for our upcoming developer documentation to be published on the Google for Developers site.

MiraclePtr: protecting users from use-after-free vulnerabilities on more platforms

Welcome back to our latest update on MiraclePtr, our project to protect against use-after-free vulnerabilities in Google Chrome. If you need a refresher, you can read our previous blog post detailing MiraclePtr and its objectives.

More platforms

We are thrilled to announce that since our last update, we have successfully enabled MiraclePtr for more platforms and processes:

  • In June 2022, we enabled MiraclePtr for the browser process on Windows and Android.
  • In September 2022, we expanded its coverage to include all processes except renderer processes.
  • In June 2023, we enabled MiraclePtr for ChromeOS, macOS, and Linux.

Furthermore, we have changed security guidelines to downgrade MiraclePtr-protected issues by one severity level!

Evaluating Security Impact

First let’s focus on its security impact. Our analysis is based on two primary information sources: incoming vulnerability reports and crash reports from user devices. Let's take a closer look at each of these sources and how they inform our understanding of MiraclePtr's effectiveness.

Bug reports

Chrome vulnerability reports come from various sources, such as:

For the purposes of this analysis, we focus on vulnerabilities that affect platforms where MiraclePtr was enabled at the time the issues were reported. We also exclude bugs that occur inside a sandboxed renderer process. Since the initial launch of MiraclePtr in 2022, we have received 168 use-after-free reports matching our criteria.

What does the data tell us? MiraclePtr effectively mitigated 57% of these use-after-free vulnerabilities in privileged processes, exceeding our initial estimate of 50%. Reaching this level of effectiveness, however, required additional work. For instance, we not only rewrote class fields to use MiraclePtr, as discussed in the previous post, but also added MiraclePtr support for bound function arguments, such as Unretained pointers. These pointers have been a significant source of use-after-frees in Chrome, and the additional protection allowed us to mitigate 39 more issues.

Moreover, these vulnerability reports enable us to pinpoint areas needing improvement. We're actively working on adding support for select third-party libraries that have been a source of use-after-free bugs, as well as developing a more advanced rewriter tool that can handle transformations like converting std::vector<T*> into std::vector<raw_ptr<T>>. We've also made several smaller fixes, such as extending the lifetime of the task state object to cover several issues in the “this pointer” category.

Crash reports

Crash reports offer a different perspective on MiraclePtr's effectiveness. As explained in the previous blog post, when an allocation is quarantined, its contents are overwritten with a special bit pattern. If the allocation is used later, the pattern will often be interpreted as an invalid memory address, causing a crash when the process attempts to access memory at that address. Since the dereferenced address remains within a small, predictable memory range, we can distinguish MiraclePtr crashes from other crashes.

Although this approach has its limitations — such as not being able to obtain stack traces from allocation and deallocation times like AddressSanitizer does — it has enabled us to detect and fix vulnerabilities. Last year, six critical severity vulnerabilities were identified in the default setup of Chrome Stable, the version most people use. Impressively, five of the six were discovered while investigating MiraclePtr crash reports! One particularly interesting example is CVE-2022-3038. The issue was discovered through MiraclePtr crash reports and fixed in Chrome 105. Several months later, Google's Threat Analysis Group discovered an exploit for that vulnerability used in the wild against clients of a different Chromium-based browser that hadn’t shipped the fix yet.

To further enhance our crash analysis capabilities, we've recently launched an experimental feature that allows us to collect additional information for MiraclePtr crashes, including stack traces. This effectively shortens the average crash report investigation time.

Performance

MiraclePtr enables us to have robust protection against use-after-free bug exploits, but there is a performance cost associated with it. Therefore, we have conducted experiments on each platform where we have shipped MiraclePtr, which we used in our decision-making process.

The main cost of MiraclePtr is memory. Specifically, the memory usage of the browser process increased by 5.5-8% on desktop platforms and approximately 2% on Android. Yet, when examining the holistic memory usage across all processes, the impact remains within a moderate 1-3% range to lower percentiles only.

The main cause of the additional memory usage is the extra size to allocate the reference count. One might think that adding 4 bytes to each allocation wouldn’t be a big deal. However, there are many small allocations in Chrome, so even the 4B overhead is not negligible. Moreover, PartitionAlloc also uses pre-defined allocation bucket sizes, so this extra 4B pushes certain allocations (particularly power-of-2 sized) into a larger bucket, e.g. 4096B → 5120B.

We also considered the performance cost. We verified that there were no regressions to the majority of our top-level performance metrics, including all of the page load metrics, like Largest Contentful Paint, First Contentful Paint and Cumulative Layout Shift. We did find a few regressions, such as a 10% increase in the 99th percentile of the browser process main thread contention metric, a 1.5% regression in First Input Delay on ChromeOS, and a 1.5% regression in tab startup time on Android. The main thread contention metric tries to estimate how often a user input can be delayed and so for example on Windows this was a change from 1.6% to 1.7% at the 99th percentile only. These are all minor regressions. There has been zero change in daily active usage, and we do not anticipate these regressions to have any noticeable impact on users.

Conclusion

In summary, MiraclePtr has proven to be effective in mitigating use-after-free vulnerabilities and enhancing the overall security of the Chrome browser. While there are performance costs associated with the implementation of MiraclePtr, our analysis suggests that the benefits in terms of security improvements far outweigh these. We are committed to continually refining and expanding the feature to cover more areas. For example we are working to add coverage to third-party libraries used by the GPU process, and we plan to enable BRP on the renderer process. By sharing our findings and experiences, we hope to contribute to the broader conversation surrounding browser security and inspire further innovation in this crucial area.

Celebrating SLSA v1.0: securing the software supply chain for everyone

Last week the Open Source Security Foundation (OpenSSF) announced the release of SLSA v1.0, a framework that helps secure the software supply chain. Ten years of using an internal version of SLSA at Google has shown that it’s crucial to warding off tampering and keeping software secure. It’s especially gratifying to see SLSA reaching v1.0 as an open source project—contributors have come together to produce solutions that will benefit everyone.

SLSA for safer supply chains

Developers and organizations that adopt SLSA will be protecting themselves against a variety of supply chain attacks, which have continued rising since Google first donated SLSA to OpenSSF in 2021. In that time, the industry has also seen a U.S. Executive Order on Cybersecurity and the associated NIST Secure Software Development Framework (SSDF) to guide national standards for software used by the U.S. government, as well as the Network and Information Security (NIS2) Directive in the European Union. SLSA offers not only an onramp to meeting these standards, but also a way to prepare for a climate of increased scrutiny on software development practices.

As organizations benefit from using SLSA, it’s also up to them to shoulder part of the burden of spreading these benefits to open source projects. Many maintainers of the critical open source projects that underpin the internet are volunteers; they cannot be expected to do all the work when so many of the rewards of adopting SLSA roll out across the supply chain to benefit everyone.

Supply chain security for all

That’s why beyond contributing to SLSA, we’ve also been laying the foundation to integrate supply chain solutions directly into the ecosystems and platforms used to create open source projects. We’re also directly supporting open source maintainers, who often cite lack of time or resources as limiting factors when making security improvements to their projects.

Our Open Source Security Upstream Team consists of developers who spend 100% of their time contributing to critical open source projects to make security improvements. For open source developers who choose to adopt SLSA on their own, we’ve funded the Secure Open Source Rewards Program, which pays developers directly for these types of security improvements.

Currently, open source developers who want to secure their builds can use the free SLSA L3 GitHub Builder, which requires only a one-time adjustment to the traditional build process implemented through GitHub actions. There’s also the SLSA Verifier tool for software consumers. Users of npm—or Node Package Manager, the world’s largest software repository—can take advantage of their recently released beta SLSA integration, which streamlines the process of creating and verifying SLSA provenance through the npm command line interface. We’re also supporting the integration of Sigstore into many major package ecosystems, meaning that users can sign and verify artifacts directly from package management tooling, without having to manage keys. Our intention is to continue to expand these types of integrations across open source ecosystems so supply chain security solutions are universal and easily accessible.

We’re also making it easier for everyone to understand their dependencies. Vulnerabilities like Log4Shell have shown the importance (and difficulty) of knowing what projects you depend on and where their security weaknesses might be. Developers can use the deps.dev API to generate real dependency graphs, with OpenSSF Scorecard security scores and other security metadata for each dependency they use. They can also use OSV-Scanner to generate a high quality list of actionable vulnerabilities in those dependencies. In the future, we hope to support automatic remediation and patching through the OSV database service, minimizing the effort that open source developers spend on securing their projects.

Continued community contributions

Ultimately, our goal is to make supply chain security invisible and available to everyone, built directly into each ecosystem for frictionless adoption. To get there, we’ll continue contributing to these efforts and encouraging other organizations who rely on open source to similarly dedicate developers to upstream support. The internet as we know it today wouldn’t be available without open source software, and it’s in everyone’s best interests to give back to the communities that make modern software development possible.

Securely Hosting User Data in Modern Web Applications

Many web applications need to display user-controlled content. This can be as simple as serving user-uploaded images (e.g. profile photos), or as complex as rendering user-controlled HTML (e.g. a web development tutorial). This has always been difficult to do securely, so we’ve worked to find easy, but secure solutions that can be applied to most types of web applications.

Classical Solutions for Isolating Untrusted Content

The classic solution for securely serving user-controlled content is to use what are known as “sandbox domains”. The basic idea is that if your application's main domain is example.com, you could serve all untrusted content on exampleusercontent.com. Since these two domains are cross-site, any malicious content on exampleusercontent.com can’t impact example.com.

This approach can be used to safely serve all kinds of untrusted content including images, downloads, and HTML. While it may not seem like it is necessary to use this for images or downloads, doing so helps avoid risks from content sniffing, especially in legacy browsers.

Sandbox domains are widely used across the industry and have worked well for a long time. But, they have two major downsides:

  1. Applications often need to restrict content access to a single user, which requires implementing authentication and authorization. Since sandbox domains purposefully do not share cookies with the main application domain, this is very difficult to do securely. To support authentication, sites either have to rely on capability URLs, or they have to set separate authentication cookies for the sandbox domain. This second method is especially problematic in the modern web where many browsers restrict cross-site cookies by default.
  2. While user content is isolated from the main site, it isn’t isolated from other user content. This creates the risk of malicious user content attacking other data on the sandbox domain (e.g. via reading same-origin data).

It is also worth noting that sandbox domains help mitigate phishing risks since resources are clearly segmented onto an isolated domain.

Modern Solutions for Serving User Content

Over time the web has evolved, and there are now easier, more secure ways to serve untrusted content. There are many different approaches here, so we will outline two solutions that are currently in wide use at Google.

Approach 1: Serving Inactive User Content

If a site only needs to serve inactive user content (i.e. content that is not HTML/JS, for example images and downloads), this can now be safely done without an isolated sandbox domain. There are two key steps:

  1. Always set the Content-Type header to a well-known MIME type that is supported by all browsers and guaranteed not to contain active content (when in doubt, application/octet-stream is a safe choice).
  2. In addition, always set the below response headers to ensure that the browser fully isolates the response.

Response Header

Purpose

X-Content-Type-Options: nosniff

Prevents content sniffing

Content-Disposition: attachment; filename="download"

Triggers a download rather than rendering

Content-Security-Policy: sandbox

Sandboxes the content as if it was served on a separate domain

Content-Security-Policy: default-src ‘none’

Disables JS execution (and inclusion of any subresources)

Cross-Origin-Resource-Policy: same-site

Prevents the page from being included cross-site

This combination of headers ensures that the response can only be loaded as a subresource by your application, or downloaded as a file by the user. Furthermore, the headers provide multiple layers of protection against browser bugs through the CSP sandbox header and the default-src restriction. Overall, the setup outlined above provides a high degree of confidence that responses served in this way cannot lead to injection or isolation vulnerabilities.

Defense In Depth

While the above solution represents a generally sufficient defense against XSS, there are a number of additional hardening measures that you can apply to provide additional layers of security:

  • Set a X-Content-Security-Policy: sandbox header for compatibility with IE11
  • Set a Content-Security-Policy: frame-ancestors 'none' header to block the endpoint from being embedded
  • Sandbox user content on an isolated subdomain by:
    • Serving user content on an isolated subdomain (e.g. Google uses domains such as product.usercontent.google.com)
    • Set Cross-Origin-Opener-Policy: same-origin and Cross-Origin-Embedder-Policy: require-corp to enable cross-origin isolation

Approach 2: Serving Active User Content

Safely serving active content (e.g. HTML or SVG images) can also be done without the weaknesses of the classic sandbox domain approach.

The simplest option is to take advantage of the Content-Security-Policy: sandbox header to tell the browser to isolate the response. While not all web browsers currently implement process isolation for sandbox documents, ongoing refinements to browser process models are likely to improve the separation of sandboxed content from embedding applications. If SpectreJS and renderer compromise attacks are outside of your threat model, then using CSP sandbox is likely a sufficient solution.

At Google, we’ve developed a solution that can fully isolate untrusted active content by modernizing the concept of sandbox domains. The core idea is to:

  1. Create a new sandbox domain that is added to the public suffix list. For example, by adding exampleusercontent.com to the PSL, you can ensure that foo.exampleusercontent.com and bar.exampleusercontent.com are cross-site and thus fully isolated from each other.
  2. URLs matching *.exampleusercontent.com/shim are all routed to a static shim file. This shim file contains a short HTML/JS snippet that listens to the message event handler and renders any content it receives.
  3. To use this, the product creates either an iframe or a popup to $RANDOM_VALUE.exampleusercontent.com/shim and uses postMessage to send the untrusted content to the shim for rendering.
  4. The rendered content is transformed to a Blob and rendered inside a sandboxed iframe.

Compared to the classic sandbox domain approach, this ensures that all content is fully isolated on a unique site. And, by having the main application deal with retrieving the data to be rendered, it is no longer necessary to use capability URLs.

Conclusion

Together, these two solutions make it possible to migrate off of classic sandbox domains like googleusercontent.com to more secure solutions that are compatible with third-party cookie blocking. At Google, we’ve already migrated many products to use these solutions and have more migrations planned for the next year. We hope that by sharing these solutions, we can help other websites easily serve untrusted content in a secure manner.