Author Archives: Google Testing Bloggers

Testing on the Toilet: Prefer Testing Public APIs Over Implementation-Detail Classes

by Andrew Trenk

This article was adapted from a Google Testing on the Toilet (TotT) episode. You can download a printer-friendly version of this TotT episode and post it in your office.


Does this class need to have tests?
class UserInfoValidator {
public void validate(UserInfo info) {
if (info.getDateOfBirth().isInFuture()) { throw new ValidationException()); }
}
}
Its method has some logic, so it may be good idea to test it. But what if its only user looks like this?
public class UserInfoService {
private UserInfoValidator validator;
public void save(UserInfo info) {
validator.validate(info); // Throw an exception if the value is invalid.
writeToDatabase(info);
}
}
The answer is: it probably doesn’t need tests, since all paths can be tested through UserInfoService. The key distinction is that the class is an implementation detail, not a public API.

A public API can be called by any number of users, who can pass in any possible combination of inputs to its methods. You want to make sure these are well-tested, which ensures users won’t see issues when they use the API. Examples of public APIs include classes that are used in a different part of a codebase (e.g., a server-side class that’s used by the client-side) and common utility classes that are used throughout a codebase.

An implementation-detail class exists only to support public APIs and is called by a very limited number of users (often only one). These classes can sometimes be tested indirectly by testing the public APIs that use them.

Testing implementation-detail classes is still useful in many cases, such as if the class is complex or if the tests would be difficult to write for the public API class. When you do test them, they often don’t need to be tested in as much depth as a public API, since some inputs may never be passed into their methods (in the above code sample, if UserInfoService ensured that UserInfo were never null, then it wouldn’t be useful to test what happens when null is passed as an argument to UserInfoValidator.validate, since it would never happen).

Implementation-detail classes can sometimes be thought of as private methods that happen to be in a separate class, since you typically don’t want to test private methods directly either. You should also try to restrict the visibility of implementation-detail classes, such as by making them package-private in Java.

Testing implementation-detail classes too often leads to a couple problems:

- Code is harder to maintain since you need to update tests more often, such as when changing a method signature of an implementation-detail class or even when doing a refactoring. If testing is done only through public APIs, these changes wouldn’t affect the tests at all.

- If you test a behavior only through an implementation-detail class, you may get false confidence in your code, since the same code path may not work properly when exercised through the public API. You also have to be more careful when refactoring, since it can be harder to ensure that all the behavior of the public API will be preserved if not all paths are tested through the public API.

Testing on the Toilet: Truth: a fluent assertion framework

by Dori Reuveni and Kurt Alfred Kluever

This article was adapted from a Google Testing on the Toilet (TotT) episode. You can download a printer-friendly version of this TotT episode and post it in your office.


As engineers, we spend most of our time reading existing code, rather than writing new code. Therefore, we must make sure we always write clean, readable code. The same goes for our tests; we need a way to clearly express our test assertions.

Truth is an open source, fluent testing framework for Java designed to make your test assertions and failure messages more readable. The fluent API makes reading (and writing) test assertions much more natural, prose-like, and discoverable in your IDE via autocomplete. For example, compare how the following assertion reads with JUnit vs. Truth:
assertEquals("March", monthMap.get(3));          // JUnit
assertThat(monthMap).containsEntry(3, "March"); // Truth
Both statements are asserting the same thing, but the assertion written with Truth can be easily read from left to right, while the JUnit example requires "mental backtracking".

Another benefit of Truth over JUnit is the addition of useful default failure messages. For example:
ImmutableSet<String> colors = ImmutableSet.of("red", "green", "blue", "yellow");
assertTrue(colors.contains("orange")); // JUnit
assertThat(colors).contains("orange"); // Truth
In this example, both assertions will fail, but JUnit will not provide a useful failure message. However, Truth will provide a clear and concise failure message:

AssertionError: <[red, green, blue, yellow]> should have contained <orange>

Truth already supports specialized assertions for most of the common JDK types (Objects, primitives, arrays, Strings, Classes, Comparables, Iterables, Collections, Lists, Sets, Maps, etc.), as well as some Guava types (Optionals). Additional support for other popular types is planned as well (Throwables, Iterators, Multimaps, UnsignedIntegers, UnsignedLongs, etc.).

Truth is also user-extensible: you can easily write a Truth subject to make fluent assertions about your own custom types. By creating your own custom subject, both your assertion API and your failure messages can be domain-specific.

Truth's goal is not to replace JUnit assertions, but to improve the readability of complex assertions and their failure messages. JUnit assertions and Truth assertions can (and often do) live side by side in tests.

To get started with Truth, check out http://google.github.io/truth/

GTAC 2014 Wrap-up

by Anthony Vallone on behalf of the GTAC Committee

On October 28th and 29th, GTAC 2014, the eighth GTAC (Google Test Automation Conference), was held at the beautiful Google Kirkland office. The conference was completely packed with presenters and attendees from all over the world (Argentina, Australia, Canada, China, many European countries, India, Israel, Korea, New Zealand, Puerto Rico, Russia, Taiwan, and many US states), bringing with them a huge diversity of experiences.


Speakers from numerous companies and universities (Adobe, American Express, Comcast, Dropbox, Facebook, FINRA, Google, HP, Medidata Solutions, Mozilla, Netflix, Orange, and University of Waterloo) spoke on a variety of interesting and cutting edge test automation topics.

All of the slides and video recordings are now available on the GTAC site. Photos will be available soon as well.


This was our most popular GTAC to date, with over 1,500 applicants and almost 200 of those for speaking. About 250 people filled our venue to capacity, and the live stream had a peak of about 400 concurrent viewers with 4,700 playbacks during the event. And, there was plenty of interesting Twitter and Google+ activity during the event.


Our goal in hosting GTAC is to make the conference highly relevant and useful for, not only attendees, but the larger test engineering community as a whole. Our post-conference survey shows that we are close to achieving that goal:


If you have any suggestions on how we can improve, please comment on this post.

Thank you to all the speakers, attendees, and online viewers who made this a special event once again. To receive announcements about the next GTAC, subscribe to the Google Testing Blog.

Protractor: Angular testing made easy

By Hank Duan, Julie Ralph, and Arif Sukoco in Seattle

Have you worked with WebDriver but been frustrated with all the waits needed for WebDriver to sync with the website, causing flakes and prolonged test times? If you are working with AngularJS apps, then Protractor is the right tool for you.

Protractor (protractortest.org) is an end-to-end test framework specifically for AngularJS apps. It was built by a team in Google and released to open source. Protractor is built on top of WebDriverJS and includes important improvements tailored for AngularJS apps. Here are some of Protractor’s key benefits:

  • You don’t need to add waits or sleeps to your test. Protractor can communicate with your AngularJS app automatically and execute the next step in your test the moment the webpage finishes pending tasks, so you don’t have to worry about waiting for your test and webpage to sync. 
  • It supports Angular-specific locator strategies (e.g., binding, model, repeater) as well as native WebDriver locator strategies (e.g., ID, CSS selector, XPath). This allows you to test Angular-specific elements without any setup effort on your part. 
  • It is easy to set up page objects. Protractor does not execute WebDriver commands until an action is needed (e.g., get, sendKeys, click). This way you can set up page objects so tests can manipulate page elements without touching the HTML. 
  • It uses Jasmine, the framework you use to write AngularJS unit tests, and Javascript, the same language you use to write AngularJS apps.

Follow these simple steps, and in minutes, you will have you first Protractor test running:

1) Set up environment

Install the command line tools ‘protractor’ and ‘webdriver-manager’ using npm:
npm install -g protractor

Start up an instance of a selenium server:
webdriver-manager update & webdriver-manager start

This downloads the necessary binary, and starts a new webdriver session listening on http://localhost:4444.

2) Write your test
// It is a good idea to use page objects to modularize your testing logic
var angularHomepage = {
nameInput : element(by.model('yourName')),
greeting : element(by.binding('yourName')),
get : function() {
browser.get('index.html');
},
setName : function(name) {
this.nameInput.sendKeys(name);
}
};

// Here we are using the Jasmine test framework
// See http://jasmine.github.io/2.0/introduction.html for more details
describe('angularjs homepage', function() {
it('should greet the named user', function(){
angularHomepage.get();
angularHomepage.setName('Julie');
expect(angularHomepage.greeting.getText()).
toEqual('Hello Julie!');
});
});

3) Write a Protractor configuration file to specify the environment under which you want your test to run:
exports.config = {
seleniumAddress: 'http://localhost:4444/wd/hub',

specs: ['testFolder/*'],

multiCapabilities: [{
'browserName': 'chrome',
// browser-specific tests
specs: 'chromeTests/*'
}, {
'browserName': 'firefox',
// run tests in parallel
shardTestFiles: true
}],

baseUrl: 'http://www.angularjs.org',
};

4) Run the test:

Start the test with the command:
protractor conf.js

The test output should be:
1 test, 1 assertions, 0 failures


If you want to learn more, here’s a full tutorial that highlights all of Protractor’s features: http://angular.github.io/protractor/#/tutorial

GTAC 2014 is this Week!

by Anthony Vallone on behalf of the GTAC Committee

The eighth GTAC commences on Tuesday at the Google Kirkland office. You can find the latest details on the conference at our site, including speaker profiles.

If you are watching remotely, we'll soon be updating the live stream page with the stream link and a Google Moderator link for remote Q&A.

If you have been selected to attend or speak, be sure to note the updated parking information. Google visitors will use off-site parking and shuttles.

We look forward to connecting with the greater testing community and sharing new advances and ideas.

Testing on the Toilet: Writing Descriptive Test Names

by Andrew Trenk

This article was adapted from a Google Testing on the Toilet (TotT) episode. You can download a printer-friendly version of this TotT episode and post it in your office.

How long does it take you to figure out what behavior is being tested in the following code?

@Test public void isUserLockedOut_invalidLogin() {
authenticator.authenticate(username, invalidPassword);
assertFalse(authenticator.isUserLockedOut(username));

authenticator.authenticate(username, invalidPassword);
assertFalse(authenticator.isUserLockedOut(username));

authenticator.authenticate(username, invalidPassword);
assertTrue(authenticator.isUserLockedOut(username));
}

You probably had to read through every line of code (maybe more than once) and understand what each line is doing. But how long would it take you to figure out what behavior is being tested if the test had this name?

isUserLockedOut_lockOutUserAfterThreeInvalidLoginAttempts

You should now be able to understand what behavior is being tested by reading just the test name, and you don’t even need to read through the test body. The test name in the above code sample hints at the scenario being tested (“invalidLogin”), but it doesn’t actually say what the expected outcome is supposed to be, so you had to read through the code to figure it out.

Putting both the scenario and the expected outcome in the test name has several other benefits:

- If you want to know all the possible behaviors a class has, all you need to do is read through the test names in its test class, compared to spending minutes or hours digging through the test code or even the class itself trying to figure out its behavior. This can also be useful during code reviews since you can quickly tell if the tests cover all expected cases.

- By giving tests more explicit names, it forces you to split up testing different behaviors into separate tests. Otherwise you may be tempted to dump assertions for different behaviors into one test, which over time can lead to tests that keep growing and become difficult to understand and maintain.

- The exact behavior being tested might not always be clear from the test code. If the test name isn’t explicit about this, sometimes you might have to guess what the test is actually testing.

- You can easily tell if some functionality isn’t being tested. If you don’t see a test name that describes the behavior you’re looking for, then you know the test doesn’t exist.

- When a test fails, you can immediately see what functionality is broken without looking at the test’s source code.

There are several common patterns for structuring the name of a test (one example is to name tests like an English sentence with “should” in the name, e.g., shouldLockOutUserAfterThreeInvalidLoginAttempts). Whichever pattern you use, the same advice still applies: Make sure test names contain both the scenario being tested and the expected outcome.

Sometimes just specifying the name of the method under test may be enough, especially if the method is simple and has only a single behavior that is obvious from its name.

Announcing the GTAC 2014 Agenda

by Anthony Vallone on behalf of the GTAC Committee

We have completed selection and confirmation of all speakers and attendees for GTAC 2014. You can find the detailed agenda at:
  developers.google.com/gtac/2014/schedule

Thank you to all who submitted proposals! It was very hard to make selections from so many fantastic submissions.

There was a tremendous amount of interest in GTAC this year with over 1,500 applicants (up from 533 last year) and 194 of those for speaking (up from 88 last year). Unfortunately, our venue only seats 250. However, don’t despair if you did not receive an invitation. Just like last year, anyone can join us via YouTube live streaming. We’ll also be setting up Google Moderator, so remote attendees can get involved in Q&A after each talk. Information about live streaming, Moderator, and other details will be posted on the GTAC site soon and announced here.

Chrome – Firefox WebRTC Interop Test – Pt 2

by Patrik Höglund

This is the second in a series of articles about Chrome’s WebRTC Interop Test. See the first.

In the previous blog post we managed to write an automated test which got a WebRTC call between Firefox and Chrome to run. But how do we verify that the call actually worked?

Verifying the Call

Now we can launch the two browsers, but how do we figure out the whether the call actually worked? If you try opening two apprtc.appspot.com tabs in the same room, you will notice the video feeds flip over using a CSS transform, your local video is relegated to a small frame and a new big video feed with the remote video shows up. For the first version of the test, I just looked at the page in the Chrome debugger and looked for some reliable signal. As it turns out, the remoteVideo.style.opacity property will go from 0 to 1 when the call goes up and from 1 to 0 when it goes down. Since we can execute arbitrary JavaScript in the Chrome tab from the test, we can simply implement the check like this:

bool WaitForCallToComeUp(content::WebContents* tab_contents) {
// Apprtc will set remoteVideo.style.opacity to 1 when the call comes up.
std::string javascript =
"window.domAutomationController.send(remoteVideo.style.opacity)";
return test::PollingWaitUntil(javascript, "1", tab_contents);
}

Verifying Video is Playing

So getting a call up is good, but what if there is a bug where Firefox and Chrome cannot send correct video streams to each other? To check that, we needed to step up our game a bit. We decided to use our existing video detector, which looks at a video element and determines if the pixels are changing. This is a very basic check, but it’s better than nothing. To do this, we simply evaluate the .js file’s JavaScript in the context of the Chrome tab, making the functions in the file available to us. The implementation then becomes

bool DetectRemoteVideoPlaying(content::WebContents* tab_contents) {
if (!EvalInJavascriptFile(tab_contents, GetSourceDir().Append(
FILE_PATH_LITERAL(
"chrome/test/data/webrtc/test_functions.js"))))
return false;
if (!EvalInJavascriptFile(tab_contents, GetSourceDir().Append(
FILE_PATH_LITERAL(
"chrome/test/data/webrtc/video_detector.js"))))
return false;

// The remote video tag is called remoteVideo in the AppRTC code.
StartDetectingVideo(tab_contents, "remoteVideo");
WaitForVideoToPlay(tab_contents);
return true;
}

where StartDetectingVideo and WaitForVideoToPlay call the corresponding JavaScript methods in video_detector.js. If the video feed is frozen and unchanging, the test will time out and fail.

What to Send in the Call

Now we can get a call up between the browsers and detect if video is playing. But what video should we send? For chrome, we have a convenient --use-fake-device-for-media-stream flag that will make Chrome pretend there’s a webcam and present a generated video feed (which is a spinning green ball with a timestamp). This turned out to be useful since Firefox and Chrome cannot acquire the same camera at the same time, so if we didn’t use the fake device we would have two webcams plugged into the bots executing the tests!

Bots running in Chrome’s regular test infrastructure do not have either software or hardware webcams plugged into them, so this test must run on bots with webcams for Firefox to be able to acquire a camera. Fortunately, we have that in the WebRTC waterfalls in order to test that we can actually acquire hardware webcams on all platforms. We also added a check to just succeed the test when there’s no real webcam on the system since we don’t want it to fail when a dev runs it on a machine without a webcam:

if (!HasWebcamOnSystem())
return;

It would of course be better if Firefox had a similar fake device, but to my knowledge it doesn’t.

Downloading all Code and Components 

Now we have all we need to run the test and have it verify something useful. We just have the hard part left: how do we actually download all the resources we need to run this test? Recall that this is actually a three-way integration test between Chrome, Firefox and AppRTC, which require the following:

  • The AppEngine SDK in order to bring up the local AppRTC instance, 
  • The AppRTC code itself, 
  • Chrome (already present in the checkout), and 
  • Firefox nightly.

While developing the test, I initially just hand-downloaded these and installed and hard-coded the paths. This is a very bad idea in the long run. Recall that the Chromium infrastructure is comprised of thousands and thousands of machines, and while this test will only run on perhaps 5 at a time due to its webcam requirements, we don’t want manual maintenance work whenever we replace a machine. And for that matter, we definitely don’t want to download a new Firefox by hand every night and put it on the right location on the bots! So how do we automate this?

Downloading the AppEngine SDK
First, let’s start with the easy part. We don’t really care if the AppEngine SDK is up-to-date, so a relatively stale version is fine. We could have the test download it from the authoritative source, but that’s a bad idea for a couple reasons. First, it updates outside our control. Second, there could be anti-robot measures on the page. Third, the download will likely be unreliable and fail the test occasionally.

The way we solved this was to upload a copy of the SDK to a Google storage bucket under our control and download it using the depot_tools script download_from_google_storage.py. This is a lot more reliable than an external website and will not download the SDK if we already have the right version on the bot.

Downloading the AppRTC Code
This code is on GitHub. Experience has shown that git clone commands run against GitHub will fail every now and then, and fail the test. We could either write some retry mechanism, but we have found it’s better to simply mirror the git repository in Chromium’s internal mirrors, which are closer to our bots and thereby more reliable from our perspective. The pull is done by a Chromium DEPS file (which is Chromium’s dependency provisioning framework).

Downloading Firefox
It turns out that Firefox supplies handy libraries for this task. We’re using mozdownload in this script in order to download the Firefox nightly build. Unfortunately this fails every now and then so we would like to have some retry mechanism, or we could write some mechanism to “mirror” the Firefox nightly build in some location we control.

Putting it Together

With that, we have everything we need to deploy the test. You can see the final code here.

The provisioning code above was put into a separate “.gclient solution” so that regular Chrome devs and bots are not burdened with downloading hundreds of megs of SDKs and code that they will not use. When this test runs, you will first see a Chrome browser pop up, which will ensure the local apprtc instance is up. Then a Firefox browser will pop up. They will each acquire the fake device and real camera, respectively, and after a short delay the AppRTC call will come up, proving that video interop is working.

This is a complicated and expensive test, but we believe it is worth it to keep the main interop case under automation this way, especially as the spec evolves and the browsers are in varying states of implementation.

Future Work

  • Also run on Windows/Mac. 
  • Also test Opera. 
  • Interop between Chrome/Firefox mobile and desktop browsers. 
  • Also ensure audio is playing. 
  • Measure bandwidth stats, video quality, etc.


Chrome – Firefox WebRTC Interop Test – Pt 1

by Patrik Höglund

WebRTC enables real time peer-to-peer video and voice transfer in the browser, making it possible to build, among other things, a working video chat with a small amount of Python and JavaScript. As a web standard, it has several unusual properties which makes it hard to test. A regular web standard generally accepts HTML text and yields a bitmap as output (what you see in the browser). For WebRTC, we have real-time RTP media streams on one side being sent to another WebRTC-enabled endpoint. These RTP packets have been jumping across NAT, through firewalls and perhaps through TURN servers to deliver hopefully stutter-free and low latency media.

WebRTC is probably the only web standard in which we need to test direct communication between Chrome and other browsers. Remember, WebRTC builds on peer-to-peer technology, which means we talk directly between browsers rather than through a server. Chrome, Firefox and Opera have announced support for WebRTC so far. To test interoperability, we set out to build an automated test to ensure that Chrome and Firefox can get a call up. This article describes how we implemented such a test and the tradeoffs we made along the way.

Calling in WebRTC

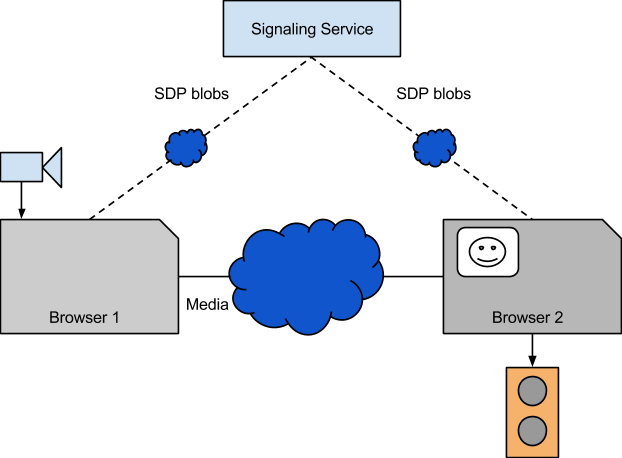
Setting up a WebRTC call requires passing SDP blobs over a signaling connection. These blobs contain information on the capabilities of the endpoint, such as what media formats it supports and what preferences it has (for instance, perhaps the endpoint has VP8 decoding hardware, which means the endpoint will handle VP8 more efficiently than, say, H.264). By sending these blobs the endpoints can agree on what media format they will be sending between themselves and how to traverse the network between them. Once that is done, the browsers will talk directly to each other, and nothing gets sent over the signaling connection.

Figure 1. Signaling and media connections.

How these blobs are sent is up to the application. Usually the browsers connect to some server which mediates the connection between the browsers, for instance by using a contact list or a room number. The AppRTC reference application uses room numbers to pair up browsers and sends the SDP blobs from the browsers through the AppRTC server.

Test Design

Instead of designing a new signaling solution from scratch, we chose to use the AppRTC application we already had. This has the additional benefit of testing the AppRTC code, which we are also maintaining. We could also have used the small peerconnection_server binary and some JavaScript, which would give us additional flexibility in what to test. We chose to go with AppRTC since it effectively implements the signaling for us, leading to much less test code.

We assumed we would be able to get hold of the latest nightly Firefox and be able to launch that with a given URL. For the Chrome side, we assumed we would be running in a browser test, i.e. on a complete Chrome with some test scaffolding around it. For the first sketch of the test, we imagined just connecting the browsers to the live apprtc.appspot.com with some random room number. If the call got established, we would be able to look at the remote video feed on the Chrome side and verify that video was playing (for instance using the video+canvas grab trick). Furthermore, we could verify that audio was playing, for instance by using WebRTC getStats to measure the audio track energy level.

Figure 2. Basic test design.

However, since we like tests to be hermetic, this isn’t a good design. I can see several problems. For example, if the network between us and AppRTC is unreliable. Also, what if someone has occupied myroomid? If that were the case, the test would fail and we would be none the wiser. So to make this thing work, we would have to find some way to bring up the AppRTC instance on localhost to make our test hermetic.

Bringing up AppRTC on localhost

AppRTC is a Google App Engine application. As this hello world example demonstrates, one can test applications locally with
google_appengine/dev_appserver.py apprtc_code/

So why not just call this from our test? It turns out we need to solve some complicated problems first, like how to ensure the AppEngine SDK and the AppRTC code is actually available on the executing machine, but we’ll get to that later. Let’s assume for now that stuff is just available. We can now write the browser test code to launch the local instance:
bool LaunchApprtcInstanceOnLocalhost() 
// ... Figure out locations of SDK and apprtc code ...
CommandLine command_line(CommandLine::NO_PROGRAM);
EXPECT_TRUE(GetPythonCommand(&command_line));

command_line.AppendArgPath(appengine_dev_appserver);
command_line.AppendArgPath(apprtc_dir);
command_line.AppendArg("--port=9999");
command_line.AppendArg("--admin_port=9998");
command_line.AppendArg("--skip_sdk_update_check");

VLOG(1) << "Running " << command_line.GetCommandLineString();
return base::LaunchProcess(command_line, base::LaunchOptions(),
&dev_appserver_);
}

That’s pretty straightforward [1].

Figuring out Whether the Local Server is Up 

Then we ran into a very typical test problem. So we have the code to get the server up, and launching the two browsers to connect to http://localhost:9999?r=some_room is easy. But how do we know when to connect? When I first ran the test, it would work sometimes and sometimes not depending on if the server had time to get up.

It’s tempting in these situations to just add a sleep to give the server time to get up. Don’t do that. That will result in a test that is flaky and/or slow. In these situations we need to identify what we’re really waiting for. We could probably monitor the stdout of the dev_appserver.py and look for some message that says “Server is up!” or equivalent. However, we’re really waiting for the server to be able to serve web pages, and since we have two browsers that are really good at connecting to servers, why not use them? Consider this code.
bool LocalApprtcInstanceIsUp() {
// Load the admin page and see if we manage to load it right.
ui_test_utils::NavigateToURL(browser(), GURL("localhost:9998"));
content::WebContents* tab_contents =
browser()->tab_strip_model()->GetActiveWebContents();
std::string javascript =
"window.domAutomationController.send(document.title)";
std::string result;
if (!content::ExecuteScriptAndExtractString(tab_contents,
javascript,
&result))
return false;

return result == kTitlePageOfAppEngineAdminPage;
}

Here we ask Chrome to load the AppEngine admin page for the local server (we set the admin port to 9998 earlier, remember?) and ask it what its title is. If that title is “Instances”, the admin page has been displayed, and the server must be up. If the server isn’t up, Chrome will fail to load the page and the title will be something like “localhost:9999 is not available”.

Then, we can just do this from the test:
while (!LocalApprtcInstanceIsUp())
VLOG(1) << "Waiting for AppRTC to come up...";

If the server never comes up, for whatever reason, the test will just time out in that loop. If it comes up we can safely proceed with the rest of test.

Launching the Browsers 

A browser window launches itself as a part of every Chromium browser test. It’s also easy for the test to control the command line switches the browser will run under.

We have less control over the Firefox browser since it is the “foreign” browser in this test, but we can still pass command-line options to it when we invoke the Firefox process. To make this easier, Mozilla provides a Python library called mozrunner. Using that we can set up a launcher python script we can invoke from the test:
from mozprofile import profile
from mozrunner import runner

WEBRTC_PREFERENCES = {
'media.navigator.permission.disabled': True,
}

def main():
# Set up flags, handle SIGTERM, etc
# ...
firefox_profile =
profile.FirefoxProfile(preferences=WEBRTC_PREFERENCES)
firefox_runner = runner.FirefoxRunner(
profile=firefox_profile, binary=options.binary,
cmdargs=[options.webpage])

firefox_runner.start()

Notice that we need to pass special preferences to make Firefox accept the getUserMedia prompt. Otherwise, the test would get stuck on the prompt and we would be unable to set up a call. Alternatively, we could employ some kind of clickbot to click “Allow” on the prompt when it pops up, but that is way harder to set up.

Without going into too much detail, the code for launching the browsers becomes
GURL room_url = 
GURL(base::StringPrintf("http://localhost:9999?r=room_%d",
base::RandInt(0, 65536)));
content::WebContents* chrome_tab =
OpenPageAndAcceptUserMedia(room_url);
ASSERT_TRUE(LaunchFirefoxWithUrl(room_url));

Where LaunchFirefoxWithUrl essentially runs this:
run_firefox_webrtc.py --binary /path/to/firefox --webpage http://localhost::9999?r=my_room

Now we can launch the two browsers. Next time we will look at how we actually verify that the call worked, and how we actually download all resources needed by the test in a maintainable and automated manner. Stay tuned!


1The explicit ports are because the default ports collided on the bots we were running on, and the --skip_sdk_update_check was because the SDK stopped and asked us something if there was an update.

Testing on the Toilet: Web Testing Made Easier: Debug IDs

by Ruslan Khamitov 

This article was adapted from a Google Testing on the Toilet (TotT) episode. You can download a printer-friendly version of this TotT episode and post it in your office.

Adding ID attributes to elements can make it much easier to write tests that interact with the DOM (e.g., WebDriver tests). Consider the following DOM with two buttons that differ only by inner text:
Save buttonEdit button
<div class="button">Save</div>
<div class="button">Edit</div>

How would you tell WebDriver to interact with the “Save” button in this case? You have several options. One option is to interact with the button using a CSS selector:
div.button

However, this approach is not sufficient to identify a particular button, and there is no mechanism to filter by text in CSS. Another option would be to write an XPath, which is generally fragile and discouraged:
//div[@class='button' and text()='Save']

Your best option is to add unique hierarchical IDs where each widget is passed a base ID that it prepends to the ID of each of its children. The IDs for each button will be:
contact-form.save-button
contact-form.edit-button

In GWT you can accomplish this by overriding onEnsureDebugId()on your widgets. Doing so allows you to create custom logic for applying debug IDs to the sub-elements that make up a custom widget:
@Override protected void onEnsureDebugId(String baseId) {
super.onEnsureDebugId(baseId);
saveButton.ensureDebugId(baseId + ".save-button");
editButton.ensureDebugId(baseId + ".edit-button");
}

Consider another example. Let’s set IDs for repeated UI elements in Angular using ng-repeat. Setting an index can help differentiate between repeated instances of each element:
<tr id="feedback-{{$index}}" class="feedback" ng-repeat="feedback in ctrl.feedbacks" >

In GWT you can do this with ensureDebugId(). Let’s set an ID for each of the table cells:
@UiField FlexTable table;
UIObject.ensureDebugId(table.getCellFormatter().getElement(rowIndex, columnIndex),
baseID + colIndex + "-" + rowIndex);

Take-away: Debug IDs are easy to set and make a huge difference for testing. Please add them early.