Author Archives: Google Testing Bloggers

Audio Testing – Automatic Gain Control

By: Patrik Höglund

What is Automatic Gain Control? 

It’s time to talk about advanced media quality tests again! As experienced Google testing blog readers know, when I write an article it’s usually about WebRTC, and the unusual testing solutions we build to test it. This article is no exception. Today we’re going to talk about Automatic Gain Control, or AGC. This is a feature that’s on by default for WebRTC applications, such as http://apprtc.appspot.com. It uses various means to adjust the microphone signal so your voice makes it loud and clear to the other side of the peer connection. For instance, it can attempt to adjust your microphone gain or try to amplify the signal digitally.

Figure 1. How Auto Gain Control works [code here].

This is an example of automatic control engineering (another example would be the classic PID controller) and happens in real time. Therefore, if you move closer to the mic while speaking, the AGC will notice the output stream is too loud, and reduce mic volume and/or digital gain. When you move further away, it tries to adapt up again. The fancy voice activity detector is there so we only amplify speech, and not, say, the microwave oven your spouse just started in the other room.

Testing the AGC

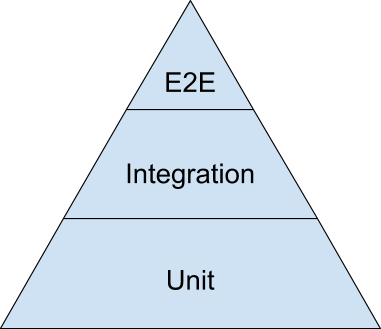
Now, how do we make sure the AGC works? The first thing is obviously to write unit tests and integration tests. You didn’t think about building that end-to-end test first, did you? Once we have the lower-level tests in place, we can start looking at a bigger test. While developing the WebRTC implementation in Chrome, we had several bugs where the AGC code was working by itself, but was misconfigured in Chrome. In one case, it was simply turned off for all users. In another, it was only turned off in Hangouts.

Only an end-to-end test can catch these integration issues, and we already had stable, low-maintenance audio quality tests with the ability to record Chrome’s output sound for analysis. I encourage you to read that article, but the bottom line is that those tests can run a WebRTC call in two tabs and record the audio output to a file. Those tests run the PESQ algorithm on input and output to see how similar they are.

That’s a good framework to have, but I needed to make two changes:

  • Add file support to Chrome’s fake audio input device, so we can play a known file. The original audio test avoided this by using WebAudio, but AGC doesn’t run in the WebAudio path, just the microphone capture path, so that won’t work.
  • Instead of running PESQ, run an analysis that compares the gain between input and output.

Adding Fake File Support

This is always a big part of the work in media testing: controlling the input and output. It’s unworkable to tape microphones to loudspeakers or point cameras to screens to capture the media, so the easiest solution is usually to add a debug flag. It is exactly what I did here. It was a lot of work, but I won’t go into much detail since Chrome’s audio pipeline is complex. The core is this:

int FileSource::OnMoreData(AudioBus* audio_bus, uint32 total_bytes_delay) {
// Load the file if we haven't already. This load needs to happen on the
// audio thread, otherwise we'll run on the UI thread on Mac for instance.
// This will massively delay the first OnMoreData, but we'll catch up.
if (!wav_audio_handler_)
LoadWavFile(path_to_wav_file_);
if (load_failed_)
return 0;

DCHECK(wav_audio_handler_.get());

// Stop playing if we've played out the whole file.
if (wav_audio_handler_->AtEnd(wav_file_read_pos_))
return 0;

// This pulls data from ProvideInput.
file_audio_converter_->Convert(audio_bus);
return audio_bus->frames();
}

This code runs every 10 ms and reads a small chunk from the file, converts it to Chrome’s preferred audio format and sends it on through the audio pipeline. After implementing this, I could simply run:

chrome --use-fake-device-for-media-stream 
--use-file-for-fake-audio-capture=/tmp/file.wav

and whenever I hit a webpage that used WebRTC, the above file would play instead of my microphone input. Sweet!

The Analysis Stage

Next I had to get the analysis stage figured out. It turned out there was something called an AudioPowerMonitor in the Chrome code, which you feed audio data into and get the average audio power for the data you fed in. This is a measure of how “loud” the audio is. Since the whole point of the AGC is getting to the right audio power level, we’re looking to compute

Adiff = Aout - Ain

Or, really, how much louder or weaker is the output compared to the input audio? Then we can construct different scenarios: Adiff should be 0 if the AGC is turned off and it should be > 0 dB if the AGC is on and we feed in a low power audio file. Computing the average energy of an audio file was straightforward to implement:

  // ...
size_t bytes_written;
wav_audio_handler->CopyTo(audio_bus.get(), 0, &bytes_written);
CHECK_EQ(bytes_written, wav_audio_handler->data().size())
<< "Expected to write entire file into bus.";

// Set the filter coefficient to the whole file's duration; this will make
// the power monitor take the entire file into account.
media::AudioPowerMonitor power_monitor(wav_audio_handler->sample_rate(),
file_duration);
power_monitor.Scan(*audio_bus, audio_bus->frames());
// ...
return power_monitor.ReadCurrentPowerAndClip().first;

I wrote a new test, and hooked up the above logic instead of PESQ. I could compute Ain by running the above algorithm on the reference file (which I fed in using the flag I implemented above) and Aout on the recording of the output audio. At this point I pretty much thought I was done. I ran a WebRTC call with the AGC turned off, expecting to get zero… and got a huge number. Turns out I wasn’t done.

What Went Wrong?

I needed more debugging information to figure out what went wrong. Since the AGC was off, I would expect the power curves for output and input to be identical. All I had was the average audio power over the entire file, so I started plotting the audio power for each 10 millisecond segment instead to understand where the curves diverged. I could then plot the detected audio power over the time of the test. I started by plotting Adiff :

Figure 2. Plot of Adiff.

The difference is quite small in the beginning, but grows in amplitude over time. Interesting. I then plotted Aout and Ain next to each other:

Figure 3. Plot of Aout and Ain.

A-ha! The curves drift apart over time; the above shows about 10 seconds of time, and the drift is maybe 80 ms at the end. The more they drift apart, the bigger the diff becomes. Exasperated, I asked our audio engineers about the above. Had my fancy test found its first bug? No, as it turns out - it was by design.

Clock Drift and Packet Loss

Let me explain. As a part of WebRTC audio processing, we run a complex module called NetEq on the received audio stream. When sending audio over the Internet, there will inevitably be packet loss and clock drift. Packet losses always happen on the Internet, depending on the network path between sender and receiver. Clock drift happens because the sample clocks on the sending and receiving sound cards are not perfectly synced.

In this particular case, the problem was not packet loss since we have ideal network conditions (one machine, packets go over the machine’s loopback interface = zero packet loss). But how can we have clock drift? Well, recall the fake device I wrote earlier that reads a file? It never touches the sound card like when the sound comes from the mic, so it runs on the system clock. That clock will drift against the machine’s sound card clock, even when we are on the same machine.

NetEq uses clever algorithms to conceal clock drift and packet loss. Most commonly it applies time compression or stretching on the audio it plays out, which means it makes the audio a little shorter or longer when needed to compensate for the drift. We humans mostly don’t even notice that, whereas a drift left uncompensated would result in a depleted or flooded receiver buffer – very noticeable. Anyway, I digress. This drift of the recording vs. the reference file was natural and I would just have to deal with it.

Silence Splitting to the Rescue!

I could probably have solved this with math and postprocessing of the results (least squares maybe?), but I had another idea. The reference file happened to be comprised of five segments with small pauses between them. What if I made these pauses longer, split the files on the pauses and trimmed away all the silence? This would effectively align the start of each segment with its corresponding segment in the reference file.

Figure 4. Before silence splitting.

Figure 5. After silence splitting.

We would still have NetEQ drift, but as you can see its effects will not stack up towards the end, so if the segments are short enough we should be able to mitigate this problem.

Result

Here is the final test implementation:

  base::FilePath reference_file = 
test::GetReferenceFilesDir().Append(reference_filename);
base::FilePath recording = CreateTemporaryWaveFile();

ASSERT_NO_FATAL_FAILURE(SetupAndRecordAudioCall(
reference_file, recording, constraints,
base::TimeDelta::FromSeconds(30)));

base::ScopedTempDir split_ref_files;
ASSERT_TRUE(split_ref_files.CreateUniqueTempDir());
ASSERT_NO_FATAL_FAILURE(
SplitFileOnSilenceIntoDir(reference_file, split_ref_files.path()));
std::vector<base::FilePath> ref_segments =
ListWavFilesInDir(split_ref_files.path());

base::ScopedTempDir split_actual_files;
ASSERT_TRUE(split_actual_files.CreateUniqueTempDir());
ASSERT_NO_FATAL_FAILURE(
SplitFileOnSilenceIntoDir(recording, split_actual_files.path()));

// Keep the recording and split files if the analysis fails.
base::FilePath actual_files_dir = split_actual_files.Take();
std::vector<base::FilePath> actual_segments =
ListWavFilesInDir(actual_files_dir);

AnalyzeSegmentsAndPrintResult(
ref_segments, actual_segments, reference_file, perf_modifier);

DeleteFileUnlessTestFailed(recording, false);
DeleteFileUnlessTestFailed(actual_files_dir, true);

Where AnalyzeSegmentsAndPrintResult looks like this:

void AnalyzeSegmentsAndPrintResult(
const std::vector<base::FilePath>& ref_segments,
const std::vector<base::FilePath>& actual_segments,
const base::FilePath& reference_file,
const std::string& perf_modifier) {
ASSERT_GT(ref_segments.size(), 0u)
<< "Failed to split reference file on silence; sox is likely broken.";
ASSERT_EQ(ref_segments.size(), actual_segments.size())
<< "The recording did not result in the same number of audio segments "
<< "after on splitting on silence; WebRTC must have deformed the audio "
<< "too much.";

for (size_t i = 0; i < ref_segments.size(); i++) {
float difference_in_decibel = AnalyzeOneSegment(ref_segments[i],
actual_segments[i],
i);
std::string trace_name = MakeTraceName(reference_file, i);
perf_test::PrintResult("agc_energy_diff", perf_modifier, trace_name,
difference_in_decibel, "dB", false);
}
}

The results look like this:

Figure 6. Average Adiff values for each segment on the y axis, Chromium revisions on the x axis.

We can clearly see the AGC applies about 6 dB of gain to the (relatively low-energy) audio file we feed in. The maximum amount of gain the digital AGC can apply is 12 dB, and 7 dB is the default, so in this case the AGC is pretty happy with the level of the input audio. If we run with the AGC turned off, we get the expected 0 dB of gain. The diff varies a bit per segment, since the segments are different in audio power.

Using this test, we can detect if the AGC accidentally gets turned off or malfunctions on windows, mac or linux. If that happens, the with_agc graph will drop from ~6 db to 0, and we’ll know something is up. Same thing if the amount of digital gain changes.

A more advanced version of this test would also look at the mic level the AGC sets. This mic level is currently ignored in the test, but it could take it into account by artificially amplifying the reference file when played through the fake device. We could also try throwing curveballs at the AGC, like abruptly raising the volume mid-test (as if the user leaned closer to the mic), and look at the gain for the segments to ensure it adapted correctly.

The Deadline to Apply for GTAC 2015 is Monday Aug 10

Posted by Anthony Vallone on behalf of the GTAC Committee


The deadline to apply for GTAC 2015 is this Monday, August 10th, 2015. There is a great deal of interest to both attend and speak, and we’ve received many outstanding proposals. However, it’s not too late to submit your proposal for consideration. If you would like to speak or attend, be sure to complete the form by Monday.

We will be making regular updates to the GTAC site (developers.google.com/gtac/2015/) over the next several weeks, and you can find conference details there.

For those that have already signed up to attend or speak, we will contact you directly by mid-September.

GTAC 2015: Call for Proposals & Attendance

Posted by Anthony Vallone on behalf of the GTAC Committee

The GTAC (Google Test Automation Conference) 2015 application process is now open for presentation proposals and attendance. GTAC will be held at the Google Cambridge office (near Boston, Massachusetts, USA) on November 10th - 11th, 2015.

GTAC will be streamed live on YouTube again this year, so even if you can’t attend in person, you’ll be able to watch the conference remotely. We will post the live stream information as we get closer to the event, and recordings will be posted afterward.

Speakers
Presentations are targeted at student, academic, and experienced engineers working on test automation. Full presentations are 30 minutes and lightning talks are 10 minutes. Speakers should be prepared for a question and answer session following their presentation.

Application
For presentation proposals and/or attendance, complete this form. We will be selecting about 25 talks and 200 attendees for the event. The selection process is not first come first serve (no need to rush your application), and we select a diverse group of engineers from various locations, company sizes, and technical backgrounds (academic, industry expert, junior engineer, etc).

Deadline
The due date for both presentation and attendance applications is August 10th, 2015.

Fees
There are no registration fees, but speakers and attendees must arrange and pay for their own travel and accommodations.

More information
You can find more details at developers.google.com/gtac.

GTAC 2015 Coming to Cambridge (Greater Boston) in November

Posted by Anthony Vallone on behalf of the GTAC Committee


We are pleased to announce that the ninth GTAC (Google Test Automation Conference) will be held in Cambridge (Greatah Boston, USA) on November 10th and 11th (Toozdee and Wenzdee), 2015. So, tell everyone to save the date for this wicked good event.

GTAC is an annual conference hosted by Google, bringing together engineers from industry and academia to discuss advances in test automation and the test engineering computer science field. It’s a great opportunity to present, learn, and challenge modern testing technologies and strategies.

You can browse presentation abstracts, slides, and videos from previous years on the GTAC site.

Stay tuned to this blog and the GTAC website for application information and opportunities to present at GTAC. Subscribing to this blog is the best way to get notified. We're looking forward to seeing you there!

Multi-Repository Development

Author: Patrik Höglund

As we all know, software development is a complicated activity where we develop features and applications to provide value to our users. Furthermore, any nontrivial modern software is composed out of other software. For instance, the Chrome web browser pulls roughly a hundred libraries into its third_party folder when you build the browser. The most significant of these libraries is Blink, the rendering engine, but there’s also ffmpeg for image processing, skia for low-level 2D graphics, and WebRTC for real-time communication (to name a few).

Figure 1. Holy dependencies, Batman!

There are many reasons to use software libraries. Why write your own phone number parser when you can use libphonenumber, which is battle-tested by real use in Android and Chrome and available under a permissive license? Using such software frees you up to focus on the core of your software so you can deliver a unique experience to your users. On the other hand, you need to keep your application up to date with changes in the library (you want that latest bug fix, right?), and you also run a risk of such a change breaking your application. This article will examine that integration problem and how you can reduce the risks associated with it.

Updating Dependencies is Hard

The simplest solution is to check in a copy of the library, build with it, and avoid touching it as much as possible. This solution, however, can be problematic because you miss out on bug fixes and new features in the library. What if you need a new feature or bug fix that just made it in? You have a few options:
  • Update the library to its latest release. If it’s been a long time since you did this, it can be quite risky and you may have to spend significant testing resources to ensure all the accumulated changes don’t break your application. You may have to catch up to interface changes in the library as well. 
  • Cherry-pick the feature/bug fix you want into your copy of the library. This is even riskier because your cherry-picked patches may depend on other changes in the library in subtle ways. Also, you still are not up to date with the latest version. 
  • Find some way to make do without the feature or bug fix.
None of the above options are very good. Using this ad-hoc updating model can work if there’s a low volume of changes in the library and our requirements on the library don’t change very often. Even if that is the case, what will you do if a critical zero-day exploit is discovered in your socket library?

One way to mitigate the update risk is to integrate more often with your dependencies. As an extreme example, let’s look at Chrome.

In Chrome development, there’s a massive amount of change going into its dependencies. The Blink rendering engine lives in a separate code repository from the browser. Blink sees hundreds of code changes per day, and Chrome must integrate with Blink often since it’s an important part of the browser. Another example is the WebRTC implementation, where a large part of Chrome’s implementation resides in the webrtc.org repository. This article will focus on the latter because it’s the team I happen to work on.

How “Rolling” Works 

The open-sourced WebRTC codebase is used by Chrome but also by a number of other companies working on WebRTC. Chrome uses a toolchain called depot_tools to manage dependencies, and there’s a checked-in text file called DEPS where dependencies are managed. It looks roughly like this:
{
# ...
'src/third_party/webrtc':
'https://chromium.googlesource.com/' +
'external/webrtc/trunk/webrtc.git' +
'@' + '5727038f572c517204e1642b8bc69b25381c4e9f',
}

The above means we should pull WebRTC from the specified git repository at the 572703... hash, similar to other dependency-provisioning frameworks. To build Chrome with a new version, we change the hash and check in a new version of the DEPS file. If the library’s API has changed, we must update Chrome to use the new API in the same patch. This process is known as rolling WebRTC to a new version.

Now the problem is that we have changed the code going into Chrome. Maybe getUserMedia has started crashing on Android, or maybe the browser no longer boots on Windows. We don’t know until we have built and run all the tests. Therefore a roll patch is subject to the same presubmit checks as any Chrome patch (i.e. many tests, on all platforms we ship on). However, roll patches can be considerably more painful and risky than other patches.


Figure 2. Life of a Roll Patch.

On the WebRTC team we found ourselves in an uncomfortable position a couple years back. Developers would make changes to the webrtc.org code and there was a fair amount of churn in the interface, which meant we would have to update Chrome to adapt to those changes. Also we frequently broke tests and WebRTC functionality in Chrome because semantic changes had unexpected consequences in Chrome. Since rolls were so risky and painful to make, they started to happen less often, which made things even worse. There could be two weeks between rolls, which meant Chrome was hit by a large number of changes in one patch.

Bots That Can See the Future: “FYI Bots” 

We found a way to mitigate this which we called FYI (for your information) bots. A bot is Chrome lingo for a continuous build machine which builds Chrome and runs tests.

All the existing Chrome bots at that point would build Chrome as specified in the DEPS file, which meant they would build the WebRTC version we had rolled to up to that point. FYI bots replace that pinned version with WebRTC HEAD, but otherwise build and run Chrome-level tests as usual. Therefore:

  • If all the FYI bots were green, we knew a roll most likely would go smoothly. 
  • If the bots didn’t compile, we knew we would have to adapt Chrome to an interface change in the next roll patch. 
  • If the bots were red, we knew we either had a bug in WebRTC or that Chrome would have to be adapted to some semantic change in WebRTC.
The FYI “waterfall” (a set of bots that builds and runs tests) is a straight copy of the main waterfall, which is expensive in resources. We could have cheated and just set up FYI bots for one platform (say, Linux), but the most expensive regressions are platform-specific, so we reckoned the extra machines and maintenance were worth it.

Making Gradual Interface Changes 

This solution helped but wasn’t quite satisfactory. We initially had the policy that it was fine to break the FYI bots since we could not update Chrome to use a new interface until the new interface had actually been rolled into Chrome. This, however, often caused the FYI bots to be compile-broken for days. We quickly started to suffer from red blindness [1] and had no idea if we would break tests on the roll, especially if an interface change was made early in the roll cycle.

The solution was to move to a more careful update policy for the WebRTC API. For the more technically inclined, “careful” here means “following the API prime directive[2]. Consider this example:
class WebRtcAmplifier {
...
int SetOutputVolume(float volume);
}

Normally we would just change the method’s signature when we needed to:
class WebRtcAmplifier {
...
int SetOutputVolume(float volume, bool allow_eleven1);
}

… but this would compile-break Chome until it could be updated. So we started doing it like this instead:
class WebRtcAmplifier {
...
int SetOutputVolume(float volume);
int SetOutputVolume2(float volume, bool allow_eleven);
}

Then we could:
  1. Roll into Chrome 
  2. Make Chrome use SetOutputVolume2 
  3. Update SetOutputVolume’s signature 
  4. Roll again and make Chrome use SetOutputVolume 
  5. Delete SetOutputVolume2
This approach requires several steps but we end up with the right interface and at no point do we break Chrome.

Results

When we implemented the above, we could fix problems as they came up rather than in big batches on each roll. We could institute the policy that the FYI bots should always be green, and that changes breaking them should be immediately rolled back. This made a huge difference. The team could work smoother and roll more often. This reduced our risk quite a bit, particularly when Chrome was about to cut a new version branch. Instead of doing panicked and risky rolls around a release, we could work out issues in good time and stay in control.

Another benefit of FYI bots is more granular performance tests. Before the FYI bots, it would frequently happen that a bunch of metrics regressed. However, it’s not fun to find which of the 100 patches in the roll caused the regression! With the FYI bots, we can see precisely which WebRTC revision caused the problem.

Future Work: Optimistic Auto-rolling

The final step on this ladder (short of actually merging the repositories) is auto-rolling. The Blink team implemented this with their ARB (AutoRollBot). The bot wakes up periodically and tries to do a roll patch. If it fails on the trybots, it waits and tries again later (perhaps the trybots failed because of a flake or other temporary error, or perhaps the error was real but has been fixed).

To pull auto-rolling off, you are going to need very good tests. That goes for any roll patch (or any patch, really), but if you’re edging closer to a release and an unstoppable flood of code changes keep breaking you, you’re not in a good place.


References

[1] Martin Fowler (May 2006) “Continuous Integration”
[2] Dani Megert, Remy Chi Jian Suen, et. al. (Oct 2014) “Evolving Java-based APIs”

Footnotes

  1. We actually did have a hilarious bug in WebRTC where it was possible to set the volume to 1.1, but only 0.0-1.0 was supposed to be allowed. No, really. Thus, our WebRTC implementation must be louder than the others since everybody knows 1.1 must be louder than 1.0.

Just Say No to More End-to-End Tests

by Mike Wacker

At some point in your life, you can probably recall a movie that you and your friends all wanted to see, and that you and your friends all regretted watching afterwards. Or maybe you remember that time your team thought they’d found the next "killer feature" for their product, only to see that feature bomb after it was released.

Good ideas often fail in practice, and in the world of testing, one pervasive good idea that often fails in practice is a testing strategy built around end-to-end tests.

Testers can invest their time in writing many types of automated tests, including unit tests, integration tests, and end-to-end tests, but this strategy invests mostly in end-to-end tests that verify the product or service as a whole. Typically, these tests simulate real user scenarios.

End-to-End Tests in Theory 

While relying primarily on end-to-end tests is a bad idea, one could certainly convince a reasonable person that the idea makes sense in theory.

To start, number one on Google's list of ten things we know to be true is: "Focus on the user and all else will follow." Thus, end-to-end tests that focus on real user scenarios sound like a great idea. Additionally, this strategy broadly appeals to many constituencies:
  • Developers like it because it offloads most, if not all, of the testing to others. 
  • Managers and decision-makers like it because tests that simulate real user scenarios can help them easily determine how a failing test would impact the user. 
  • Testers like it because they often worry about missing a bug or writing a test that does not verify real-world behavior; writing tests from the user's perspective often avoids both problems and gives the tester a greater sense of accomplishment. 

End-to-End Tests in Practice 

So if this testing strategy sounds so good in theory, then where does it go wrong in practice? To demonstrate, I present the following composite sketch based on a collection of real experiences familiar to both myself and other testers. In this sketch, a team is building a service for editing documents online (e.g., Google Docs).

Let's assume the team already has some fantastic test infrastructure in place. Every night:
  1. The latest version of the service is built. 
  2. This version is then deployed to the team's testing environment. 
  3. All end-to-end tests then run against this testing environment. 
  4. An email report summarizing the test results is sent to the team.

The deadline is approaching fast as our team codes new features for their next release. To maintain a high bar for product quality, they also require that at least 90% of their end-to-end tests pass before features are considered complete. Currently, that deadline is one day away:

Days LeftPass %Notes
15%Everything is broken! Signing in to the service is broken. Almost all tests sign in a user, so almost all tests failed.
04%A partner team we rely on deployed a bad build to their testing environment yesterday.
-154%A dev broke the save scenario yesterday (or the day before?). Half the tests save a document at some point in time. Devs spent most of the day determining if it's a frontend bug or a backend bug.
-254%It's a frontend bug, devs spent half of today figuring out where.
-354%A bad fix was checked in yesterday. The mistake was pretty easy to spot, though, and a correct fix was checked in today.
-41%Hardware failures occurred in the lab for our testing environment.
-584%Many small bugs hiding behind the big bugs (e.g., sign-in broken, save broken). Still working on the small bugs.
-687%We should be above 90%, but are not for some reason.
-789.54%(Rounds up to 90%, close enough.) No fixes were checked in yesterday, so the tests must have been flaky yesterday.

Analysis 

Despite numerous problems, the tests ultimately did catch real bugs.

What Went Well 

  • Customer-impacting bugs were identified and fixed before they reached the customer.

What Went Wrong 

  • The team completed their coding milestone a week late (and worked a lot of overtime). 
  • Finding the root cause for a failing end-to-end test is painful and can take a long time. 
  • Partner failures and lab failures ruined the test results on multiple days. 
  • Many smaller bugs were hidden behind bigger bugs. 
  • End-to-end tests were flaky at times. 
  • Developers had to wait until the following day to know if a fix worked or not. 

So now that we know what went wrong with the end-to-end strategy, we need to change our approach to testing to avoid many of these problems. But what is the right approach?

The True Value of Tests 

Typically, a tester's job ends once they have a failing test. A bug is filed, and then it's the developer's job to fix the bug. To identify where the end-to-end strategy breaks down, however, we need to think outside this box and approach the problem from first principles. If we "focus on the user (and all else will follow)," we have to ask ourselves how a failing test benefits the user. Here is the answer:

A failing test does not directly benefit the user. 

While this statement seems shocking at first, it is true. If a product works, it works, whether a test says it works or not. If a product is broken, it is broken, whether a test says it is broken or not. So, if failing tests do not benefit the user, then what does benefit the user?

A bug fix directly benefits the user.

The user will only be happy when that unintended behavior - the bug - goes away. Obviously, to fix a bug, you must know the bug exists. To know the bug exists, ideally you have a test that catches the bug (because the user will find the bug if the test does not). But in that entire process, from failing test to bug fix, value is only added at the very last step.

StageFailing TestBug OpenedBug Fixed
Value AddedNoNoYes

Thus, to evaluate any testing strategy, you cannot just evaluate how it finds bugs. You also must evaluate how it enables developers to fix (and even prevent) bugs.

Building the Right Feedback Loop

Tests create a feedback loop that informs the developer whether the product is working or not. The ideal feedback loop has several properties:
  • It's fast. No developer wants to wait hours or days to find out if their change works. Sometimes the change does not work - nobody is perfect - and the feedback loop needs to run multiple times. A faster feedback loop leads to faster fixes. If the loop is fast enough, developers may even run tests before checking in a change. 
  • It's reliable. No developer wants to spend hours debugging a test, only to find out it was a flaky test. Flaky tests reduce the developer's trust in the test, and as a result flaky tests are often ignored, even when they find real product issues. 
  • It isolates failures. To fix a bug, developers need to find the specific lines of code causing the bug. When a product contains millions of lines of codes, and the bug could be anywhere, it's like trying to find a needle in a haystack. 

Think Smaller, Not Larger

So how do we create that ideal feedback loop? By thinking smaller, not larger.

Unit Tests

Unit tests take a small piece of the product and test that piece in isolation. They tend to create that ideal feedback loop:

  • Unit tests are fast. We only need to build a small unit to test it, and the tests also tend to be rather small. In fact, one tenth of a second is considered slow for unit tests. 
  • Unit tests are reliable. Simple systems and small units in general tend to suffer much less from flakiness. Furthermore, best practices for unit testing - in particular practices related to hermetic tests - will remove flakiness entirely. 
  • Unit tests isolate failures. Even if a product contains millions of lines of code, if a unit test fails, you only need to search that small unit under test to find the bug. 

Writing effective unit tests requires skills in areas such as dependency management, mocking, and hermetic testing. I won't cover these skills here, but as a start, the typical example offered to new Googlers (or Nooglers) is how Google builds and tests a stopwatch.

Unit Tests vs. End-to-End Tests

With end-to-end tests, you have to wait: first for the entire product to be built, then for it to be deployed, and finally for all end-to-end tests to run. When the tests do run, flaky tests tend to be a fact of life. And even if a test finds a bug, that bug could be anywhere in the product.

Although end-to-end tests do a better job of simulating real user scenarios, this advantage quickly becomes outweighed by all the disadvantages of the end-to-end feedback loop:

UnitEnd-toEnd
Fast


Reliable


Isolates Failures


Simulates a Real User


Integration Tests

Unit tests do have one major disadvantage: even if the units work well in isolation, you do not know if they work well together. But even then, you do not necessarily need end-to-end tests. For that, you can use an integration test. An integration test takes a small group of units, often two units, and tests their behavior as a whole, verifying that they coherently work together.

If two units do not integrate properly, why write an end-to-end test when you can write a much smaller, more focused integration test that will detect the same bug? While you do need to think larger, you only need to think a little larger to verify that units work together.

Testing Pyramid

Even with both unit tests and integration tests, you probably still will want a small number of end-to-end tests to verify the system as a whole. To find the right balance between all three test types, the best visual aid to use is the testing pyramid. Here is a simplified version of the testing pyramid from the opening keynote of the 2014 Google Test Automation Conference:


The bulk of your tests are unit tests at the bottom of the pyramid. As you move up the pyramid, your tests gets larger, but at the same time the number of tests (the width of your pyramid) gets smaller.

As a good first guess, Google often suggests a 70/20/10 split: 70% unit tests, 20% integration tests, and 10% end-to-end tests. The exact mix will be different for each team, but in general, it should retain that pyramid shape. Try to avoid these anti-patterns:
  • Inverted pyramid/ice cream cone. The team relies primarily on end-to-end tests, using few integration tests and even fewer unit tests. 
  • Hourglass. The team starts with a lot of unit tests, then uses end-to-end tests where integration tests should be used. The hourglass has many unit tests at the bottom and many end-to-end tests at the top, but few integration tests in the middle. 
Just like a regular pyramid tends to be the most stable structure in real life, the testing pyramid also tends to be the most stable testing strategy.


Quantum Quality

UPDATE: Hey, this was an April fool's joke but in fact we wished we could
have realized this idea and we are looking forward to the day this has
been worked out and becomes a reality.

by Kevin Graney

Here at Google we have a long history of capitalizing on the latest research and technology to improve the quality of our software. Over our past 16+ years as a company, what started with some humble unit tests has grown into a massive operation. As our software complexity increased, ever larger and more complex tests were dreamed up by our Software Engineers in Test (SETs).

What we have come to realize is that our love of testing is a double-edged sword. On the one hand, large-scale testing keeps us honest and gives us confidence. It ensures our products remain reliable, our users' data is kept safe, and our engineers are able to work productively without fear of breaking things. On the other hand, it's expensive in both engineer and machine time. Our SETs have been working tirelessly to reduce the expense and latency of software tests at Google, while continuing to increase their quality.

Today, we're excited to reveal how Google is tackling this challenge. In collaboration with the Quantum AI Lab, SETs at Google have been busy revolutionizing how software is tested. The theory is relatively simple: bits in a traditional computer are either zero or one, but bits in a quantum computer can be both one and zero at the same time. This is known as superposition, and the classic example is Schrodinger's cat. Through some clever math and cutting edge electrical engineering, researchers at Google have figured out how to utilize superposition to vastly improve the quality of our software testing and the speed at which our tests run.


Figure 1 Some qubits inside a Google quantum device.

With superposition, tests at Google are now able to simultaneously model every possible state of the application under test. The state of the application can be thought of as an n bit sequential memory buffer, consistent with the traditional Von Neuman architecture of computing. Because each bit under superposition is simultaneously a 0 and a 1, these tests can simulate 2n different application states at any given instant in time in O(n) space. Each of these application states can be mutated by application logic to another state in constant time using quantum algorithms developed by Google researchers. These two properties together allow us to build a state transition graph of the application under test that shows every possible application state and all possible transitions to other application states. Using traditional computing methods this problem has intractable time complexity, but after leveraging superposition and our quantum algorithms it becomes relatively fast and cheap.

Figure 2 The application state graph for a demonstrative 3-bit application. If the start state is 001 then 000, 110, 111, and 011 are all unreachable states. States 010 and 100 both result in deadlock.

Once we have the state transition graph for the application under test, testing it becomes almost trivial. Given the initial startup state of the application, i.e. the executable bits of the application stored on disk, we can find from the application's state transition graph all reachable states. Assertions that ensure proper behavior are then written against the reachable subset of the transition graph. This paradigm of test writing allows both Google's security engineers and software engineers to work more productively. A security engineer can write a test, for example, that asserts "no executable memory regions become mutated in any reachable state". This one test effectively eliminates the potential for security flaws that result from memory safety violations. A test engineer can write higher level assertions using graph traversal methods that ensure data integrity is maintained across a subset of application state transitions. Tests of this nature can detect data corruption bugs.

We're excited about the work our team has done so far to push the envelope in the field of quantum software quality. We're just getting started, but based on early dogfood results among Googlers we believe the potential of this work is huge. Stay tuned!


Android UI Automated Testing

by Mona El Mahdy

Overview

This post reviews four strategies for Android UI testing with the goal of creating UI tests that are fast, reliable, and easy to debug.

Before we begin, let’s not forget an important rule: whatever can be unit tested should be unit tested. Robolectric and gradle unit tests support are great examples of unit test frameworks for Android. UI tests, on the other hand, are used to verify that your application returns the correct UI output in response to a sequence of user actions on a device. Espresso is a great framework for running UI actions and verifications in the same process. For more details on the Espresso and UI Automator tools, please see: test support libraries.

The Google+ team has performed many iterations of UI testing. Below we discuss the lessons learned during each strategy of UI testing. Stay tuned for more posts with more details and code samples.

Strategy 1: Using an End-To-End Test as a UI Test

Let’s start with some definitions. A UI test ensures that your application returns the correct UI output in response to a sequence of user actions on a device. An end-to-end (E2E) test brings up the full system of your app including all backend servers and client app. E2E tests will guarantee that data is sent to the client app and that the entire system functions correctly.

Usually, in order to make the application UI functional, you need data from backend servers, so UI tests need to simulate the data but not necessarily the backend servers. In many cases UI tests are confused with E2E tests because E2E is very similar to manual test scenarios. However, debugging and stabilizing E2E tests is very difficult due to many variables like network flakiness, authentication against real servers, size of your system, etc.


When you use UI tests as E2E tests, you face the following problems:
  • Very large and slow tests. 
  • High flakiness rate due to timeouts and memory issues. 
  • Hard to debug/investigate failures. 
  • Authentication issues (ex: authentication from automated tests is very tricky).

Let’s see how these problems can be fixed using the following strategies.

Strategy 2: Hermetic UI Testing using Fake Servers

In this strategy, you avoid network calls and external dependencies, but you need to provide your application with data that drives the UI. Update your application to communicate to a local server rather than external one, and create a fake local server that provides data to your application. You then need a mechanism to generate the data needed by your application. This can be done using various approaches depending on your system design. One approach is to record server responses and replay them in your fake server.

Once you have hermetic UI tests talking to a local fake server, you should also have server hermetic tests. This way you split your E2E test into a server side test, a client side test, and an integration test to verify that the server and client are in sync (for more details on integration tests, see the backend testing section of blog).

Now, the client test flow looks like:


While this approach drastically reduces the test size and flakiness rate, you still need to maintain a separate fake server as well as your test. Debugging is still not easy as you have two moving parts: the test and the local server. While test stability will be largely improved by this approach, the local server will cause some flakes.

Let’s see how this could this be improved...

Strategy 3: Dependency Injection Design for Apps.

To remove the additional dependency of a fake server running on Android, you should use dependency injection in your application for swapping real module implementations with fake ones. One example is Dagger, or you can create your own dependency injection mechanism if needed.

This will improve the testability of your app for both unit testing and UI testing, providing your tests with the ability to mock dependencies. In instrumentation testing, the test apk and the app under test are loaded in the same process, so the test code has runtime access to the app code. Not only that, but you can also use classpath override (the fact that test classpath takes priority over app under test) to override a certain class and inject test fakes there. For example, To make your test hermetic, your app should support injection of the networking implementation. During testing, the test injects a fake networking implementation to your app, and this fake implementation will provide seeded data instead of communicating with backend servers.


Strategy 4: Building Apps into Smaller Libraries

If you want to scale your app into many modules and views, and plan to add more features while maintaining stable and fast builds/tests, then you should build your app into small components/libraries. Each library should have its own UI resources and user dependency management. This strategy not only enables mocking dependencies of your libraries for hermetic testing, but also serves as an experimentation platform for various components of your application.

Once you have small components with dependency injection support, you can build a test app for each component.

The test apps bring up the actual UI of your libraries, fake data needed, and mock dependencies. Espresso tests will run against these test apps. This enables testing of smaller libraries in isolation.

For example, let’s consider building smaller libraries for login and settings of your app.


The settings component test now looks like:


Conclusion

UI testing can be very challenging for rich apps on Android. Here are some UI testing lessons learned on the Google+ team:
  1. Don’t write E2E tests instead of UI tests. Instead write unit tests and integration tests beside the UI tests. 
  2. Hermetic tests are the way to go. 
  3. Use dependency injection while designing your app. 
  4. Build your application into small libraries/modules, and test each one in isolation. You can then have a few integration tests to verify integration between components is correct . 
  5. Componentized UI tests have proven to be much faster than E2E and 99%+ stable. Fast and stable tests have proven to drastically improve developer productivity.

The First Annual Testing on the Toilet Awards

By Andrew Trenk

The Testing on the Toilet (TotT) series was created in 2006 as a way to spread unit-testing knowledge across Google by posting flyers in bathroom stalls. It quickly became a part of Google culture and is still going strong today, with new episodes published every week and read in hundreds of bathrooms by thousands of engineers in Google offices across the world. Initially focused on content related to testing, TotT now covers a variety of technical topics, such as tips on writing cleaner code and ways to prevent security bugs.

While TotT episodes often have a big impact on many engineers across Google, until now we never did anything to formally thank authors for their contributions. To fix that, we decided to honor the most popular TotT episodes of 2014 by establishing the Testing on the Toilet Awards. The winners were chosen through a vote that was open to all Google engineers. The Google Testing Blog is proud to present the winners that were posted on this blog (there were two additional winners that weren’t posted on this blog since we only post testing-related TotT episodes).

And the winners are ...

Erik Kuefler: Test Behaviors, Not Methods and Don't Put Logic in Tests 
Alex Eagle: Change-Detector Tests Considered Harmful

The authors of these episodes received their very own Flushy trophy, which they can proudly display on their desks.


(The logo on the trophy is the same one we put on the printed version of each TotT episode, which you can see by looking for the “printer-friendly version” link in the TotT blog posts).

Congratulations to the winners!

Testing on the Toilet: Change-Detector Tests Considered Harmful

by Alex Eagle

This article was adapted from a Google Testing on the Toilet (TotT) episode. You can download a printer-friendly version of this TotT episode and post it in your office.


You have just finished refactoring some code without modifying its behavior. Then you run the tests before committing and… a bunch of unit tests are failing. While fixing the tests, you get a sense that you are wasting time by mechanically applying the same transformation to many tests. Maybe you introduced a parameter in a method, and now must update 100 callers of that method in tests to pass an empty string.

What does it look like to write tests mechanically? Here is an absurd but obvious way:
// Production code:
def abs(i: Int)
return (i < 0) ? i * -1 : i

// Test code:
for (line: String in File(prod_source).read_lines())
switch (line.number)
1: assert line.content equals def abs(i: Int)
2: assert line.content equals return (i < 0) ? i * -1 : i

That test is clearly not useful: it contains an exact copy of the code under test and acts like a checksum. A correct or incorrect program is equally likely to pass a test that is a derivative of the code under test. No one is really writing tests like that, but how different is it from this next example?
// Production code:
def process(w: Work)
firstPart.process(w)
secondPart.process(w)

// Test code:
part1 = mock(FirstPart)
part2 = mock(SecondPart)
w = Work()
Processor(part1, part2).process(w)
verify_in_order
was_called part1.process(w)
was_called part2.process(w)

It is tempting to write a test like this because it requires little thought and will run quickly. This is a change-detector test—it is a transformation of the same information in the code under test—and it breaks in response to any change to the production code, without verifying correct behavior of either the original or modified production code.

Change detectors provide negative value, since the tests do not catch any defects, and the added maintenance cost slows down development. These tests should be re-written or deleted.