 |
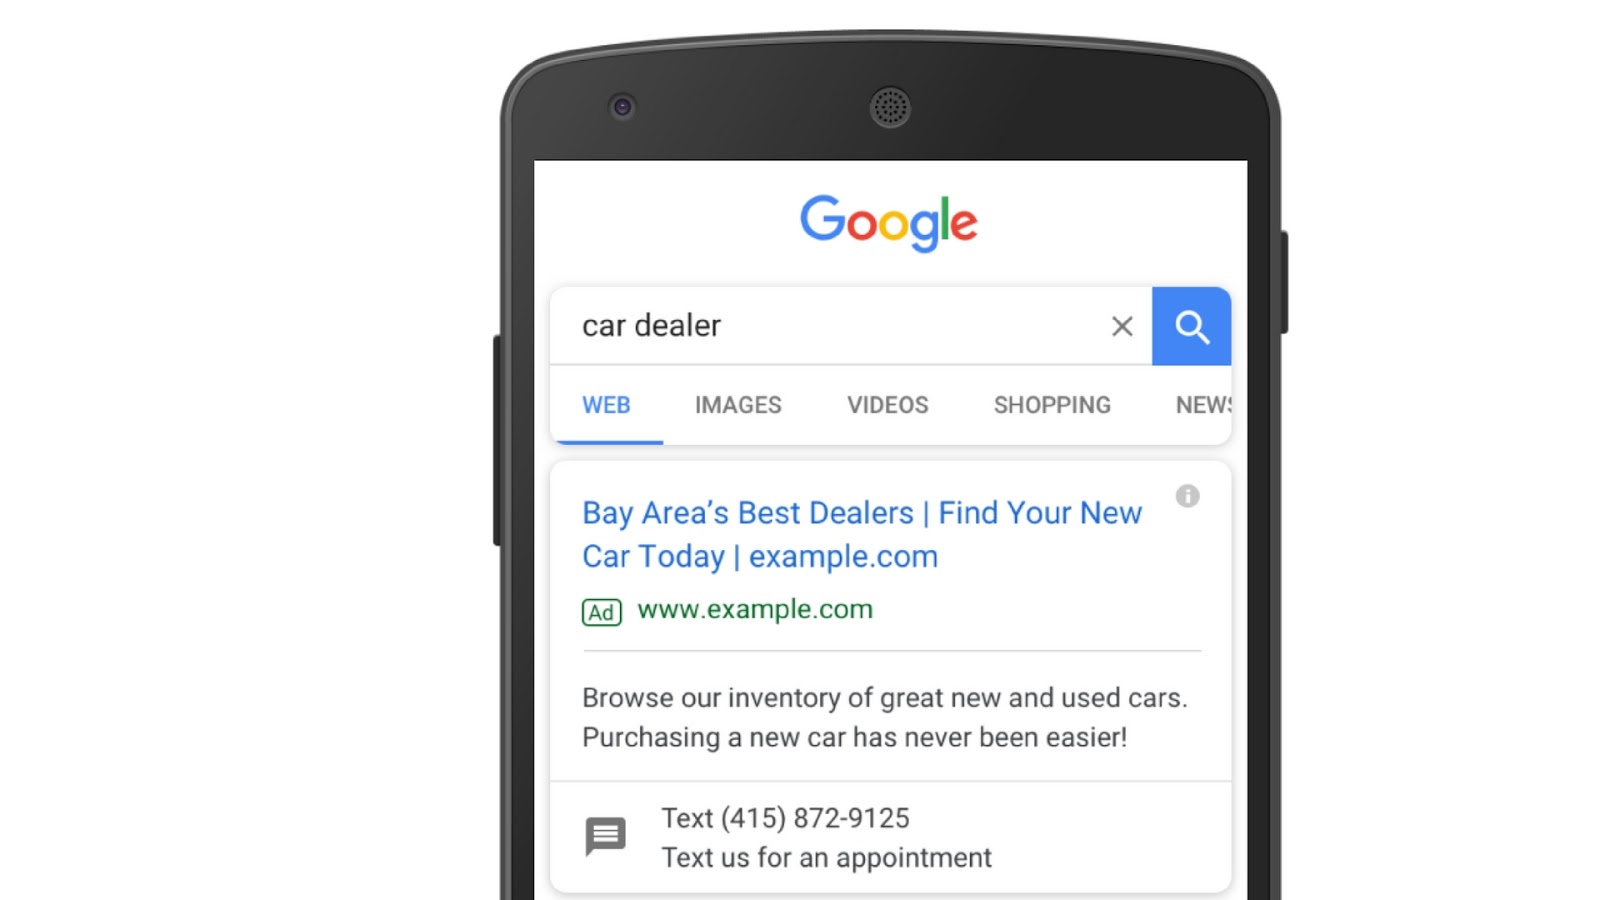
| Example of a click-to-message ad |
Message reporting offers new performance insights including:
Chat rate - how often users start a conversation with you (“Chats”) after seeing your message extension (“Message impressions”).
Example: A law firm discovers that consumers prefer messaging over calls when asking questions about real estate law. To improve the chat rate, it tailors its extension text to be more relevant by replacing the generic, “Text us to learn more” with “Text a real estate lawyer now.” It also enhances its message text to better reflect the user’s voice and how they’d really speak. It changes, “I’d like to know more, please text me back.” to “Hi, I’m looking for a real estate lawyer. Please reply back with more information.”
Chat start time - the timestamp for when a user sends you a message to initiate a conversation. Use this insight to help schedule your message extensions.
Example: A travel tour company sees that its chat volume peaks at noon when people are sending the most booking requests. This also coincides with when their “Time to first reply” takes the longest. As a result, they add an extra sales representative to assist customers more quickly.
Messages - the total number of messages exchanged between you and a user within a single chat. Use this insight to evaluate which campaigns are driving the longest or most in-depth conversations compared to the average.
Example: A furniture retailer sees that in one campaign, chats tend to last for fifteen messages, which is more than double the average. It discovers that users are actually dropping off once a sales representative requests payment information. Using this insight, it decides to give users the option of transferring to a phone call or web form to complete the transaction.


Visit the Help Center to learn the full range of insights available with message reporting and how you can use them to optimize your click-to-message performance. Also read our best practices for driving more valuable customer conversations with messaging.
1. Google Consumer Surveys, US, Canada, UK, Australia, October 2016, Base: Respondents who own a smartphone and use it to access the Internet (n = 1,036 in US, n = 1,032 in UK, n = 489 in Canada, n = 485 in Australia).
